| Param | Original file | Final file |
|---|---|---|
| Filename | modeM0/AS1G05_248T01_9000000486_03769cztM0_level2.evt | modeM0/AS1G05_248T01_9000000486_03769cztM0_level2_quad_clean.evt |
| Size (bytes) | 537,382,080 | 87,707,520 |
| Size | 512.5 MB | 83.6 MB |
| Events in quadrant A | 4,627,905 | 535,795 |
| Events in quadrant B | 4,249,346 | 540,672 |
| Events in quadrant C | 3,221,267 | 541,538 |
| Events in quadrant D | 3,675,503 | 524,251 |
| Mode SS | |||
|---|---|---|---|
| Quadrant | BADHDUFLAG | Total packets | Discarded packets |
| A | 0 | 150 | 0 |
| B | 0 | 150 | 0 |
| C | 0 | 150 | 0 |
| D | 0 | 150 | 0 |
| Mode M9 | |||
|---|---|---|---|
| Quadrant | BADHDUFLAG | Total packets | Discarded packets |
| A | 0 | 4 | 0 |
| B | 0 | 4 | 0 |
| C | 0 | 4 | 0 |
| D | 0 | 4 | 0 |
| Mode M0 | |||
|---|---|---|---|
| Quadrant | BADHDUFLAG | Total packets | Discarded packets |
| A | 0 | 18786 | 3 |
| B | 0 | 17548 | 2 |
| C | 0 | 15022 | 5 |
| D | 0 | 16269 | 2 |
| Quadrant | Total seconds | Saturated seconds | Saturation percentage |
|---|---|---|---|
| A | 7377 | 227 | 3.077132% |
| B | 7377 | 75 | 1.016673% |
| C | 7376 | 13 | 0.176247% |
| D | 7377 | 38 | 0.515115% |
Noise dominated data is calculated using 1-second bins in cleaned event files. If a bin has >2000 counts, and if more than 50% of those come from <1% of pixels, then it is considered to be noise-dominated and hence unusable.
| Quadrant | # 1 sec bins | Bins with >0 counts | Bins with >2000 counts | High rate bins dominated by noise | Noise dominated (total time) | Noise dominated (detector-on time) | Marked lightcurve |
|---|---|---|---|---|---|---|---|
| A | 7802 | 7378 | 153 | 153 | 1.96% | 2.07% | 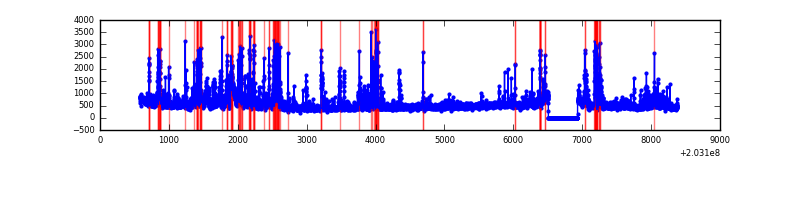 |
| B | 7802 | 7378 | 29 | 29 | 0.37% | 0.39% | 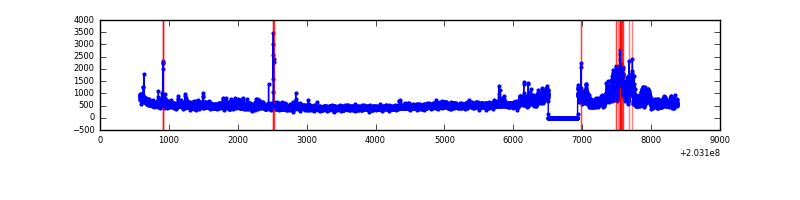 |
| C | 7802 | 7378 | 0 | 0 | 0.00% | 0.00% | 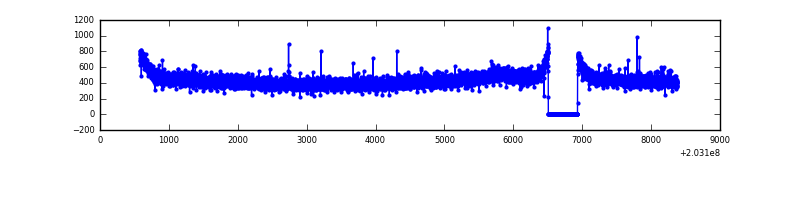 |
| D | 7802 | 7378 | 26 | 26 | 0.33% | 0.35% | 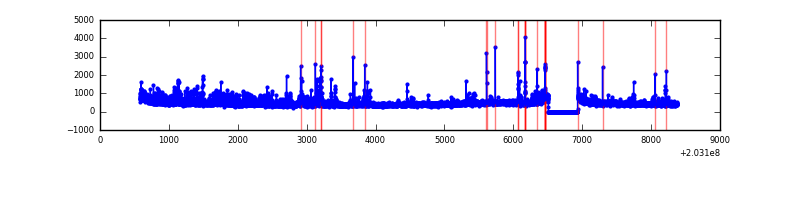 |
Top three noisy pixels from each quadrant. If the there are fewer than three noisy pixels in the level2.evt file, extra rows are filled as -1
| Pixel properties | Quadrant properties | ||||||
|---|---|---|---|---|---|---|---|
| Quadrant | DetID | PixID | Counts | Sigma | Mean | Median | Sigma |
| A | 13 | 251 | 691040 | 4016.23 | 832 | 811 | 171.9 |
| A | 0 | 118 | 547515 | 3181.1 | 832 | 811 | 171.9 |
| A | 0 | 50 | 75708 | 435.8 | 832 | 811 | 171.9 |
| B | 15 | 204 | 770197 | 4693.58 | 849 | 828 | 163.9 |
| B | 5 | 70 | 49704 | 298.17 | 849 | 828 | 163.9 |
| B | 4 | 81 | 45701 | 273.75 | 849 | 828 | 163.9 |
| C | 13 | 61 | 7108 | 32.59 | 821 | 823 | 192.8 |
| C | 8 | 128 | 4709 | 20.15 | 821 | 823 | 192.8 |
| C | 12 | 4 | 3519 | 13.98 | 821 | 823 | 192.8 |
| D | 1 | 84 | 241705 | 1217.58 | 819 | 795 | 197.9 |
| D | 13 | 249 | 78219 | 391.31 | 819 | 795 | 197.9 |
| D | 13 | 239 | 50848 | 252.97 | 819 | 795 | 197.9 |
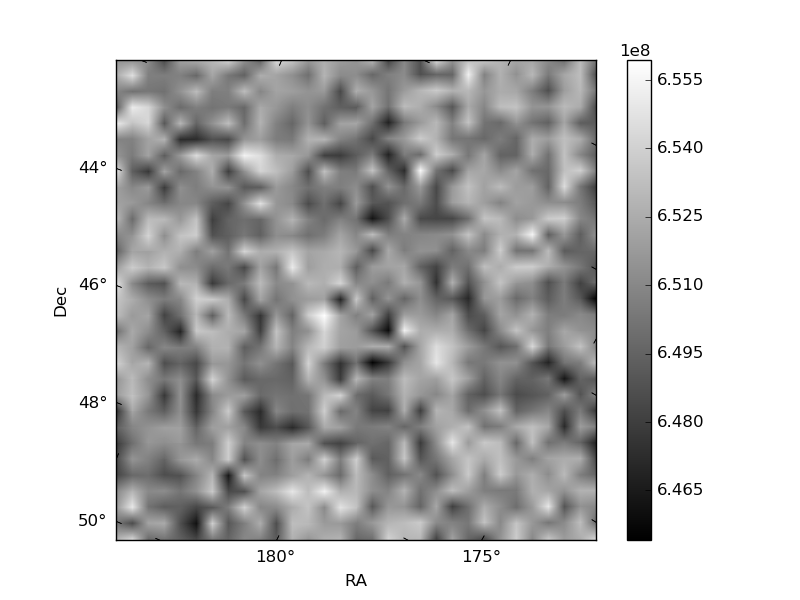
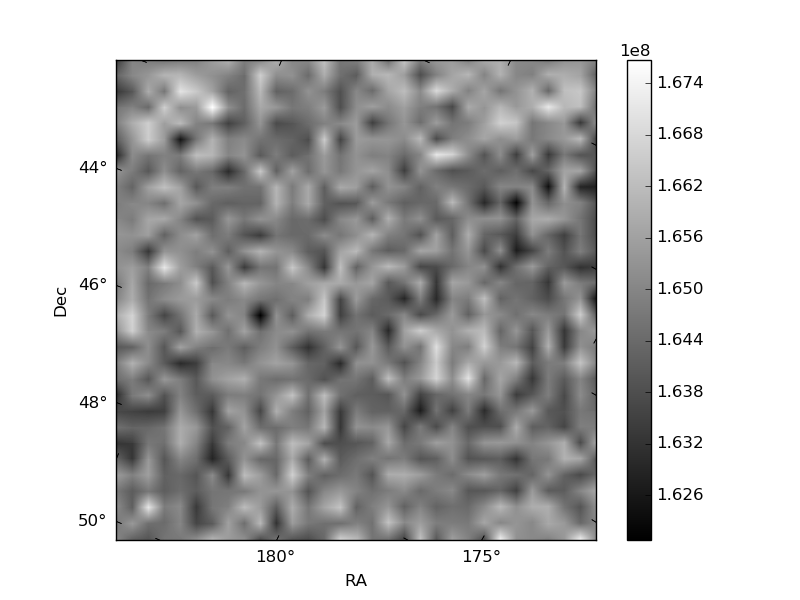
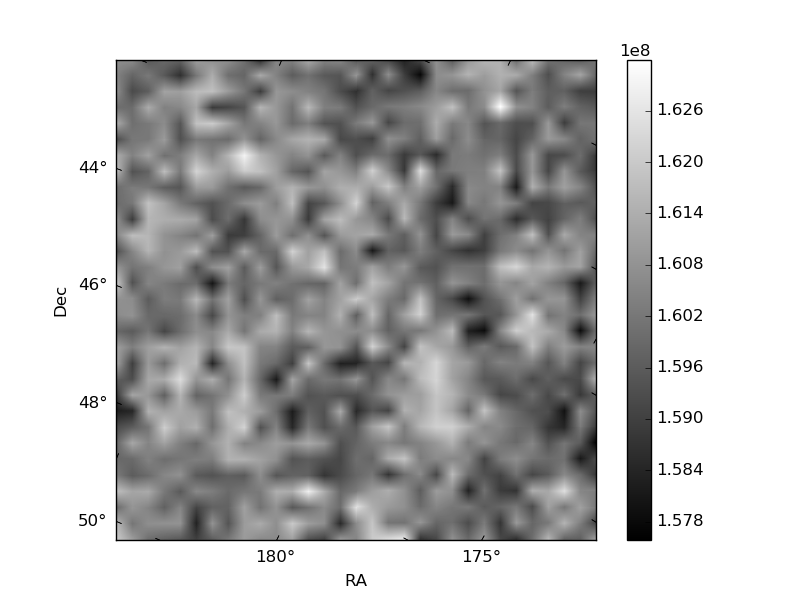
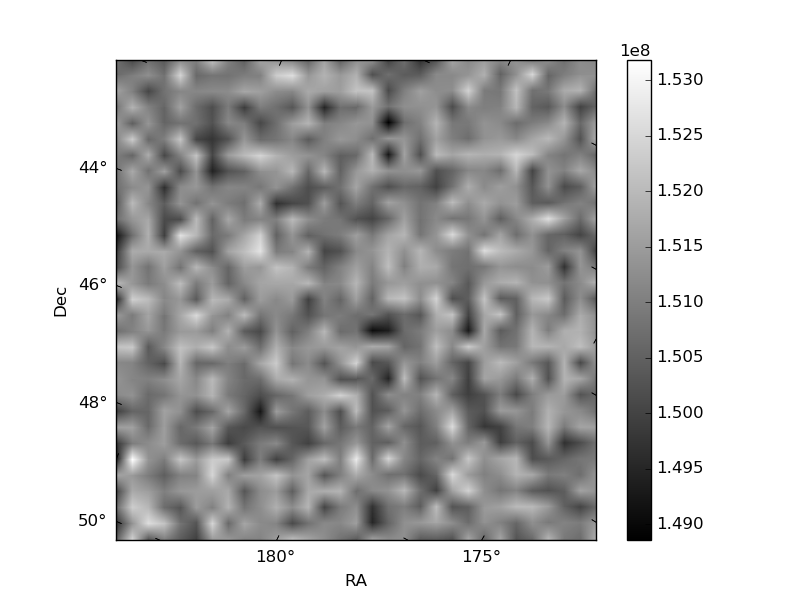
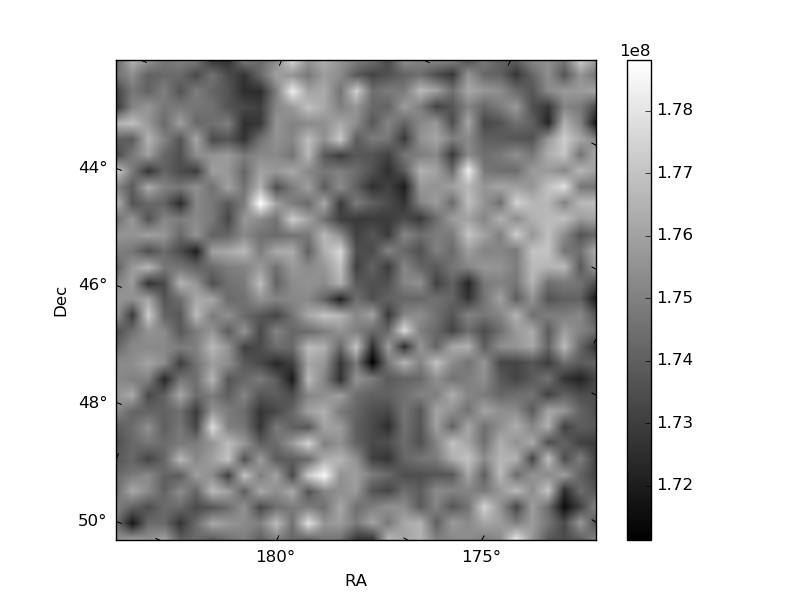
Histogram calculated using DETX and DETY for each event in the final _common_clean file
| Quadrant A | 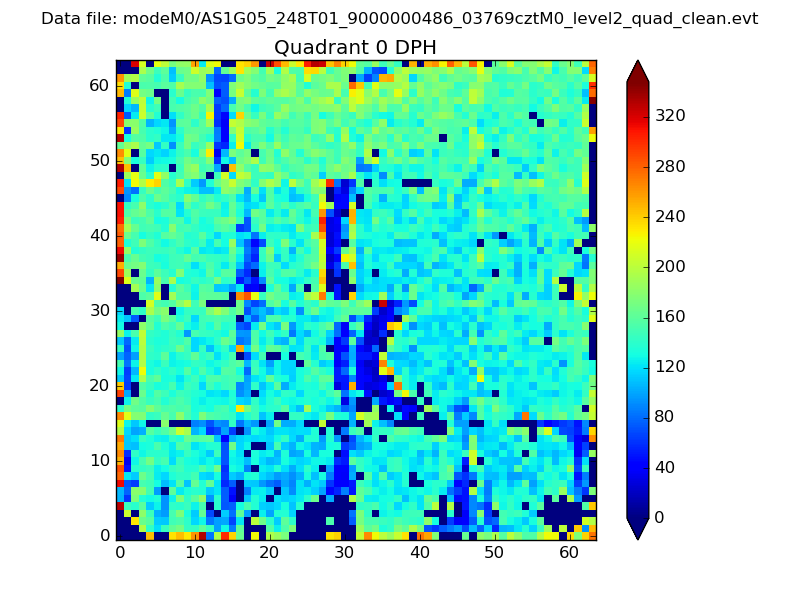 |
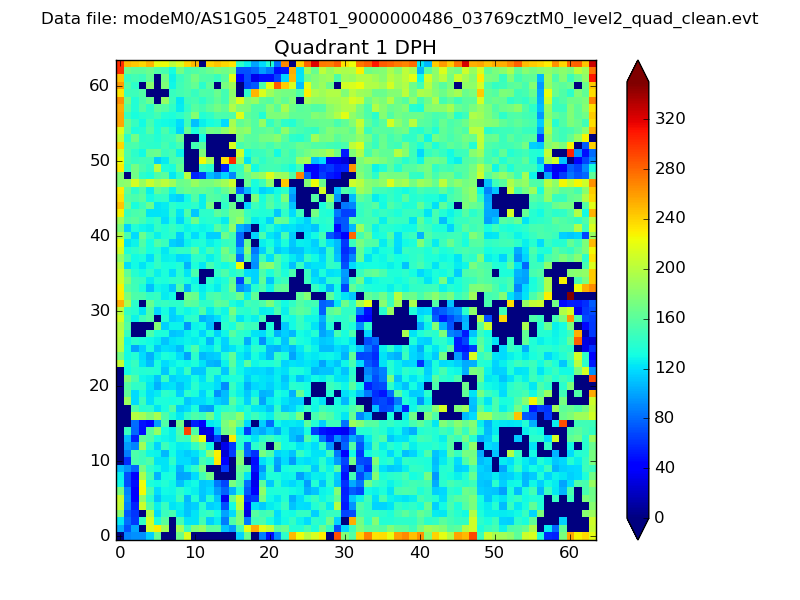 |
Quadrant B |
|---|---|---|---|
| Quadrant D |  |
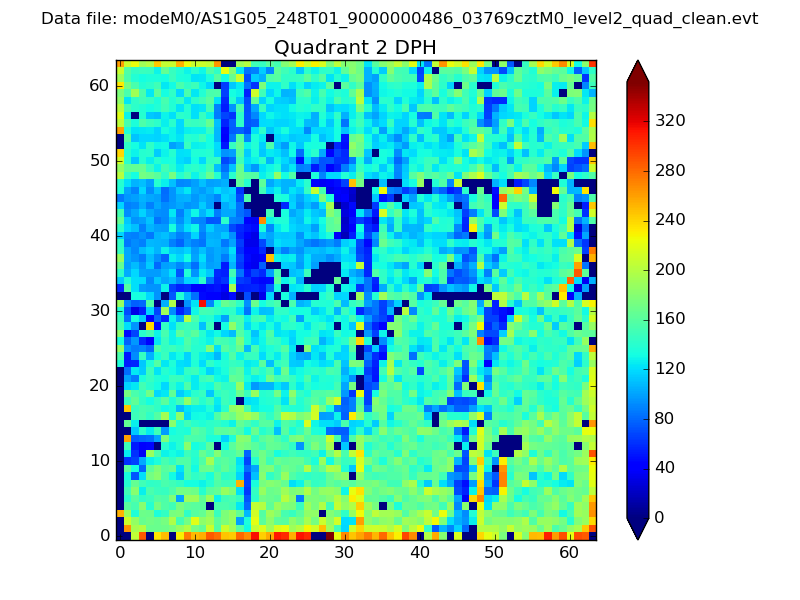 |
Quadrant C |
| Plot type | Count rate plots | Images |
|---|---|---|
| Comparison with Poisson distribution Blue bars denote a histogram of data divided into 1 sec bins. Red curve is a Poisson curve with rate = median count rate of data. |
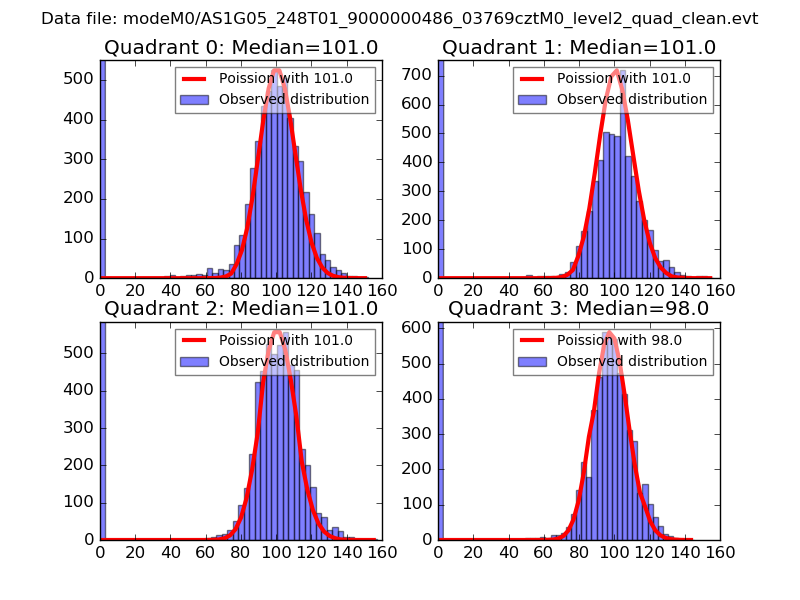 |
 |
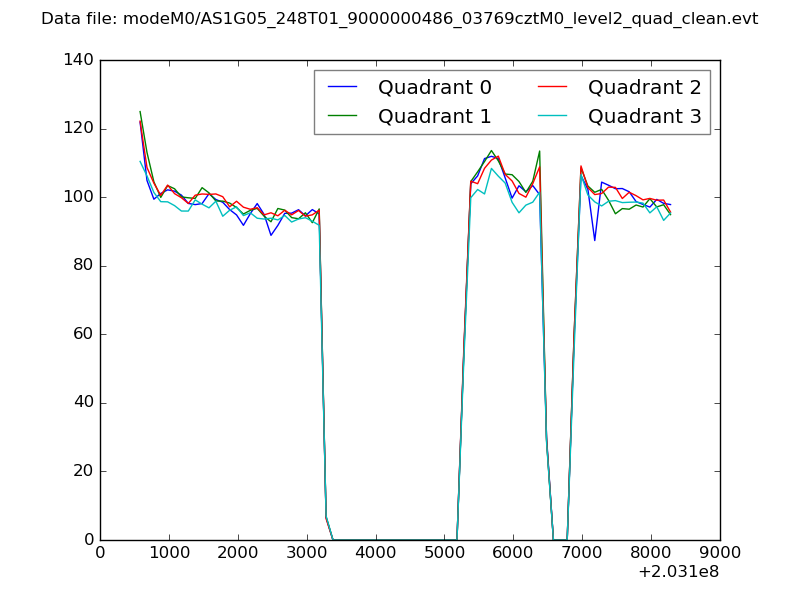
| Quadrant-wise count rates Data is divided into 100 sec bins |
 |
|
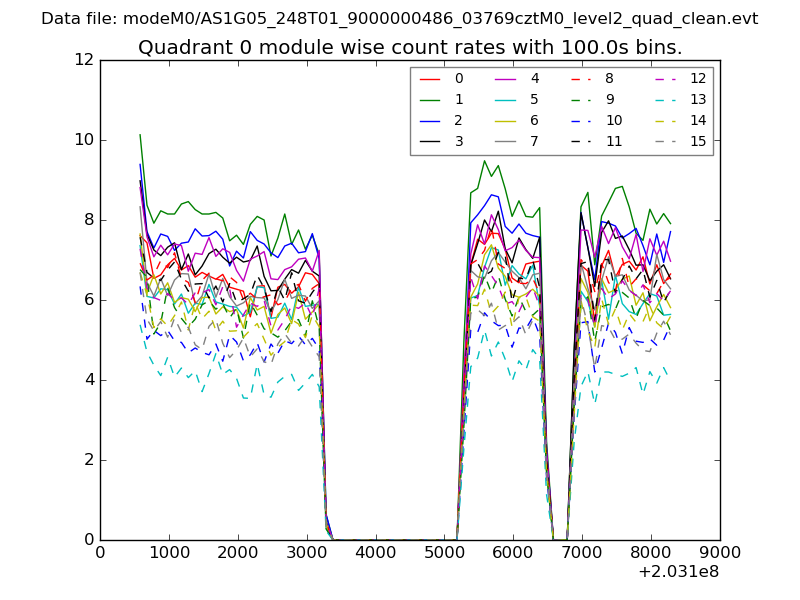
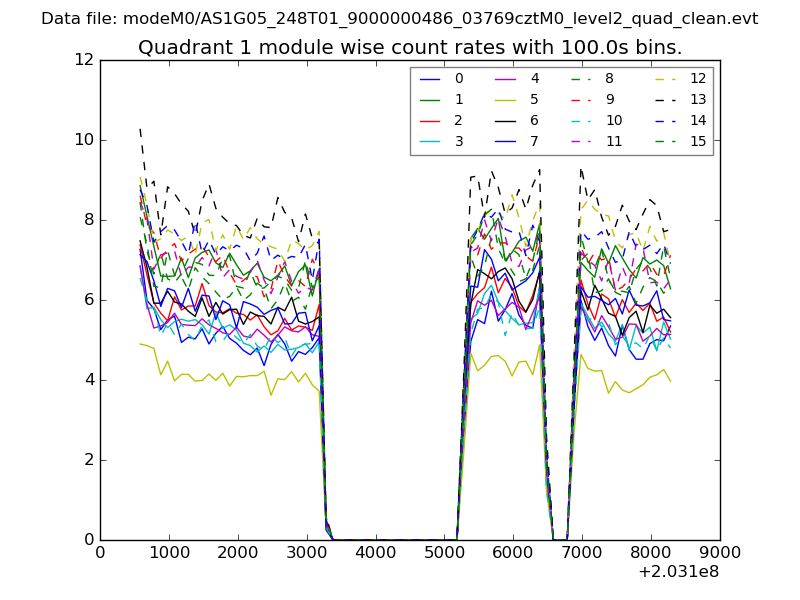
| Module-wise count rates for Quadrant A Data is divided into 100 sec bins |
 |
 |
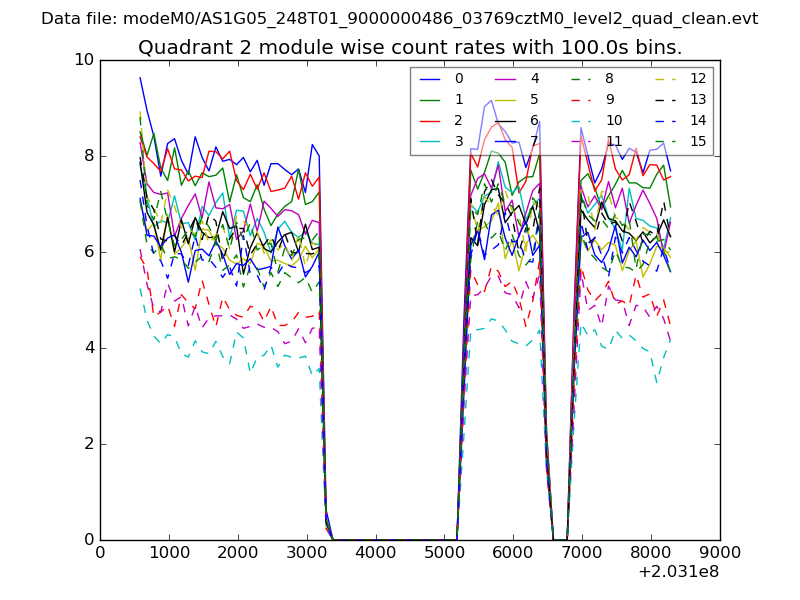
| Module-wise count rates for Quadrant B Data is divided into 100 sec bins |
 |
 |
| Module-wise count rates for Quadrant C Data is divided into 100 sec bins |
 |
 |
| Module-wise count rates for Quadrant D Data is divided into 100 sec bins |
 |
 |
| Parameter | Plot |
|---|---|
| CZT HV Monitor | 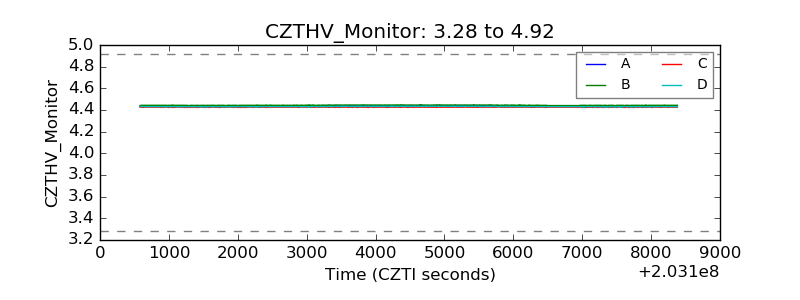 |
| D_VDD | 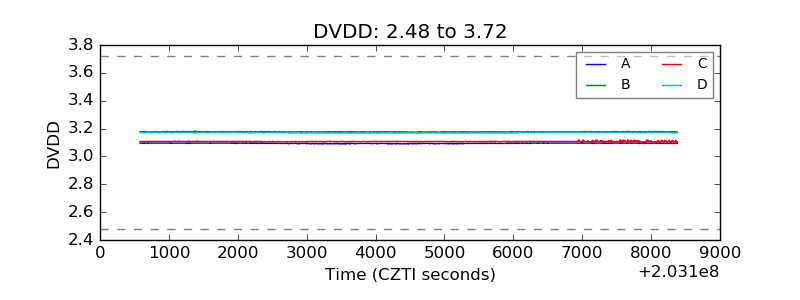 |
| Temperature 1 | 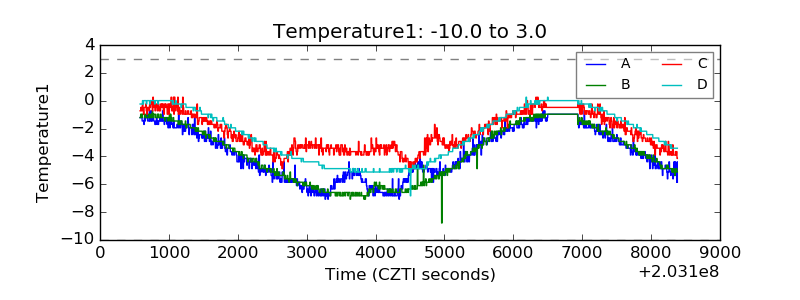 |
| Veto HV Monitor |  |
| Veto LLD | 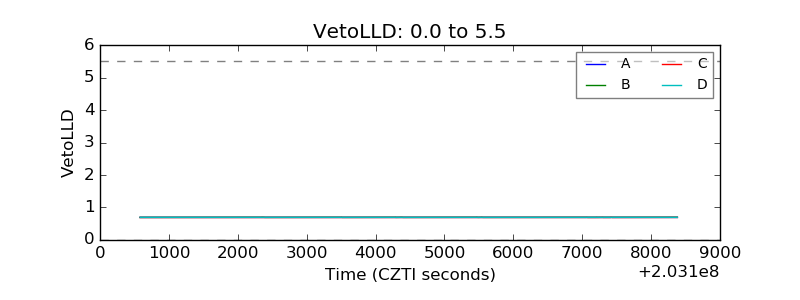 |
| Alpha Counter | 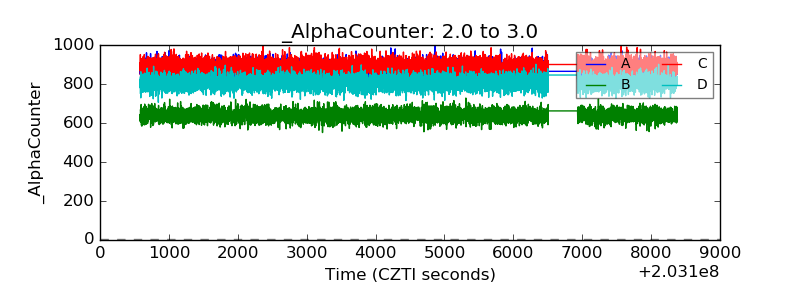 |
| _CPM_Rate | 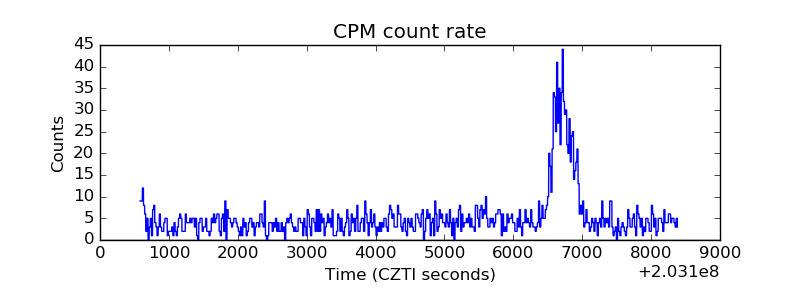 |
| CZT Counter | 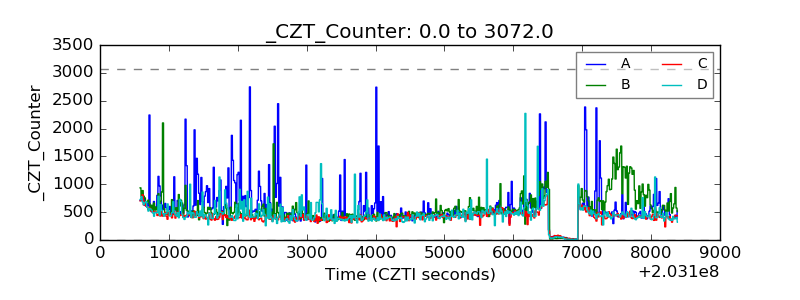 |
| +2.5 Volts monitor |  |
| +5 Volts monitor |  |
| Veto Counter | 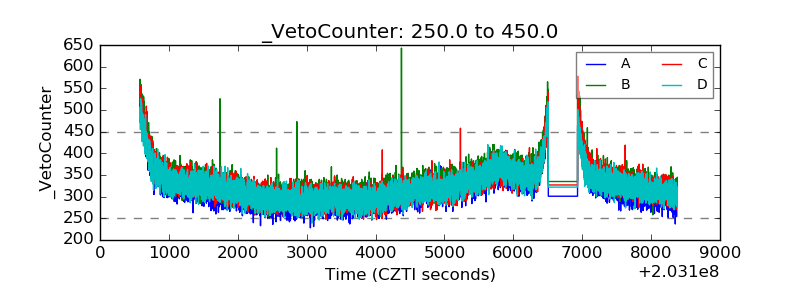 |