| Param | Original file | Final file |
|---|---|---|
| Filename | modeM0/AS1G05_248T01_9000000486_03772cztM0_level2.evt | modeM0/AS1G05_248T01_9000000486_03772cztM0_level2_quad_clean.evt |
| Size (bytes) | 539,020,800 | 88,263,360 |
| Size | 514.1 MB | 84.2 MB |
| Events in quadrant A | 4,394,403 | 533,081 |
| Events in quadrant B | 4,141,888 | 542,087 |
| Events in quadrant C | 3,463,872 | 534,855 |
| Events in quadrant D | 3,793,665 | 519,335 |
| Mode SS | |||
|---|---|---|---|
| Quadrant | BADHDUFLAG | Total packets | Discarded packets |
| A | 0 | 162 | 0 |
| B | 0 | 162 | 0 |
| C | 0 | 162 | 0 |
| D | 0 | 162 | 0 |
| Mode M9 | |||
|---|---|---|---|
| Quadrant | BADHDUFLAG | Total packets | Discarded packets |
| A | 0 | 16 | 0 |
| B | 0 | 16 | 0 |
| C | 0 | 16 | 0 |
| D | 0 | 16 | 0 |
| Mode M0 | |||
|---|---|---|---|
| Quadrant | BADHDUFLAG | Total packets | Discarded packets |
| A | 0 | 18542 | 3 |
| B | 0 | 17681 | 2 |
| C | 0 | 15879 | 2 |
| D | 0 | 16946 | 2 |
| Quadrant | Total seconds | Saturated seconds | Saturation percentage |
|---|---|---|---|
| A | 7808 | 233 | 2.984119% |
| B | 7808 | 70 | 0.896516% |
| C | 7808 | 23 | 0.294570% |
| D | 7808 | 83 | 1.063012% |
Noise dominated data is calculated using 1-second bins in cleaned event files. If a bin has >2000 counts, and if more than 50% of those come from <1% of pixels, then it is considered to be noise-dominated and hence unusable.
| Quadrant | # 1 sec bins | Bins with >0 counts | Bins with >2000 counts | High rate bins dominated by noise | Noise dominated (total time) | Noise dominated (detector-on time) | Marked lightcurve |
|---|---|---|---|---|---|---|---|
| A | 9458 | 7810 | 114 | 114 | 1.21% | 1.46% | 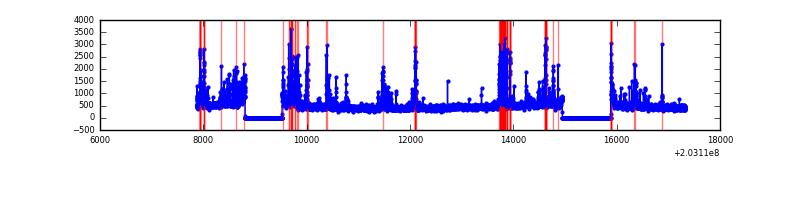 |
| B | 9458 | 7809 | 2 | 2 | 0.02% | 0.03% | 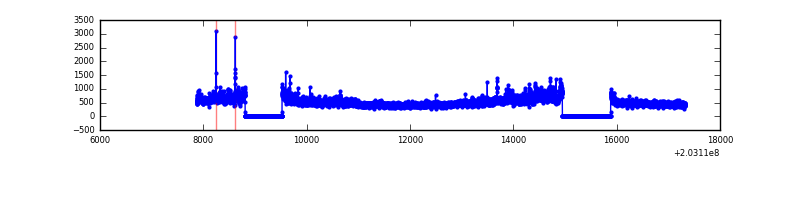 |
| C | 9458 | 7810 | 0 | 0 | 0.00% | 0.00% | 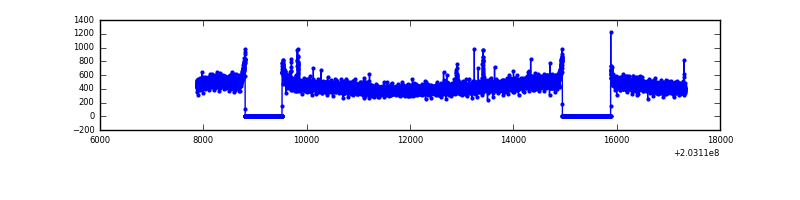 |
| D | 9458 | 7810 | 53 | 53 | 0.56% | 0.68% | 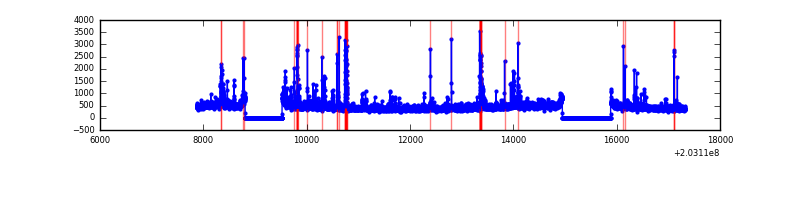 |
Top three noisy pixels from each quadrant. If the there are fewer than three noisy pixels in the level2.evt file, extra rows are filled as -1
| Pixel properties | Quadrant properties | ||||||
|---|---|---|---|---|---|---|---|
| Quadrant | DetID | PixID | Counts | Sigma | Mean | Median | Sigma |
| A | 0 | 118 | 295067 | 1596.91 | 892 | 871 | 184.2 |
| A | 0 | 50 | 269551 | 1458.4 | 892 | 871 | 184.2 |
| A | 13 | 251 | 266004 | 1439.15 | 892 | 871 | 184.2 |
| B | 15 | 204 | 501771 | 2795.12 | 914 | 889 | 179.2 |
| B | 15 | 54 | 19068 | 101.45 | 914 | 889 | 179.2 |
| B | 5 | 200 | 19030 | 101.23 | 914 | 889 | 179.2 |
| C | 2 | 53 | 15345 | 69.97 | 880 | 881 | 206.7 |
| C | 12 | 4 | 8051 | 34.69 | 880 | 881 | 206.7 |
| C | 13 | 61 | 7417 | 31.62 | 880 | 881 | 206.7 |
| D | 1 | 84 | 105443 | 490.62 | 875 | 848 | 213.2 |
| D | 13 | 223 | 89661 | 416.59 | 875 | 848 | 213.2 |
| D | 9 | 35 | 69551 | 322.26 | 875 | 848 | 213.2 |
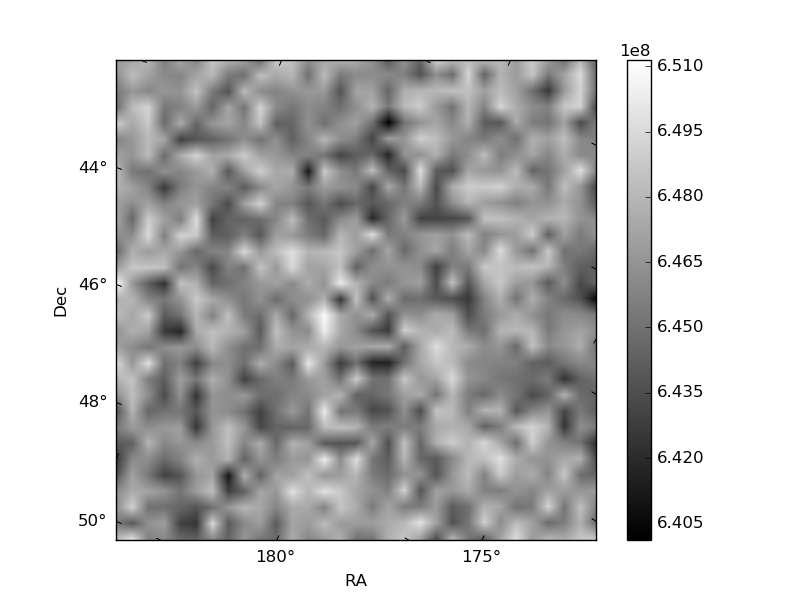
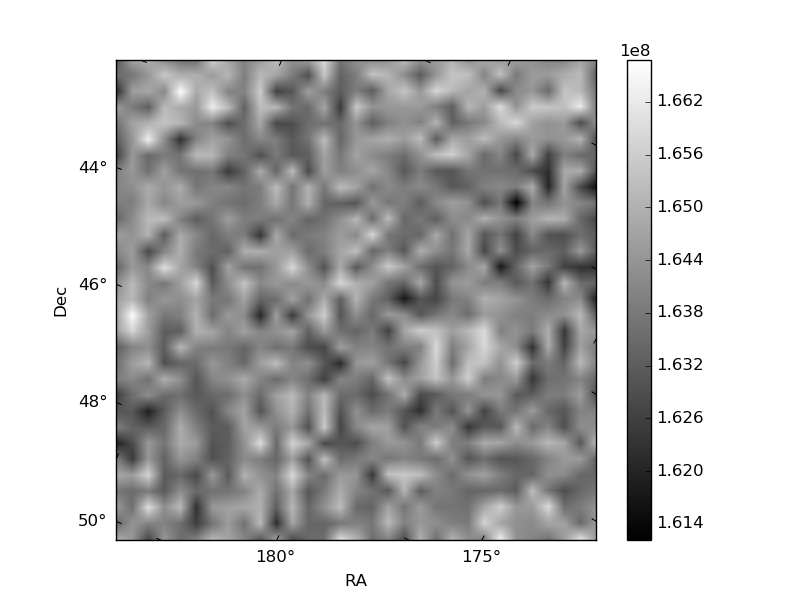
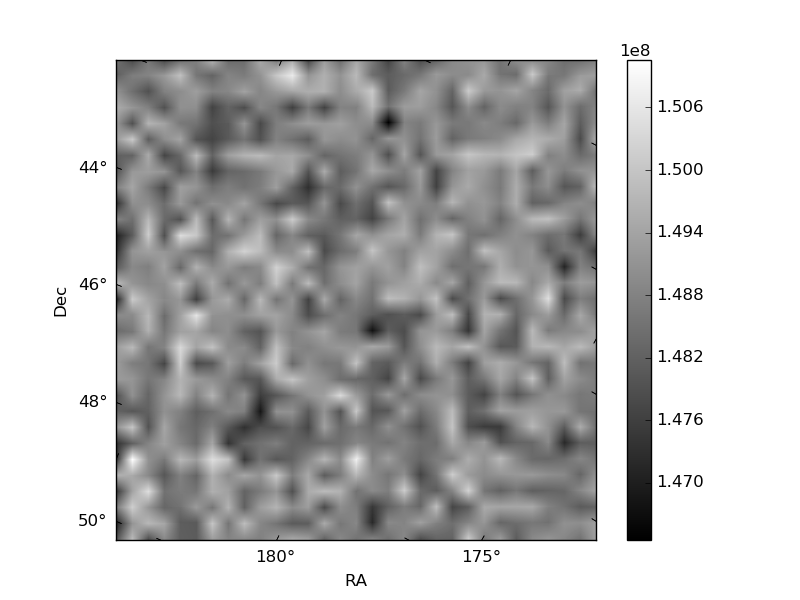
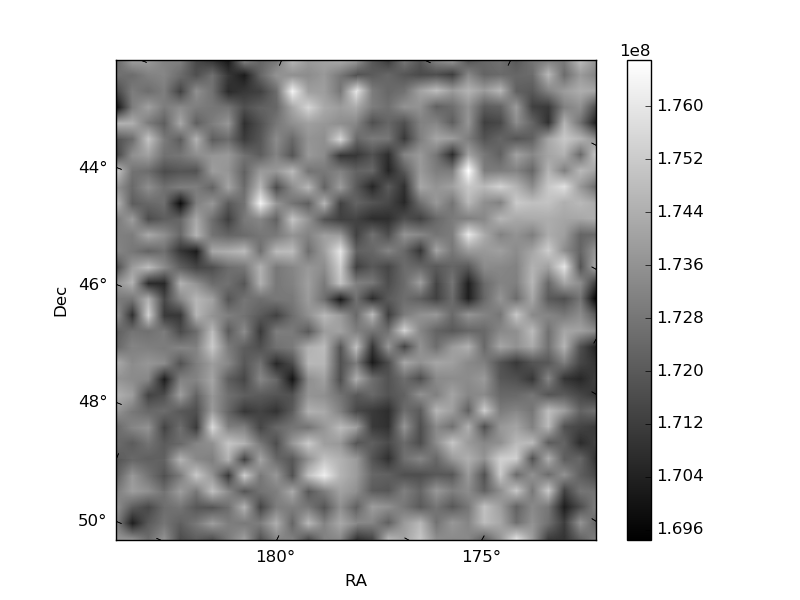
Histogram calculated using DETX and DETY for each event in the final _common_clean file
| Quadrant A | 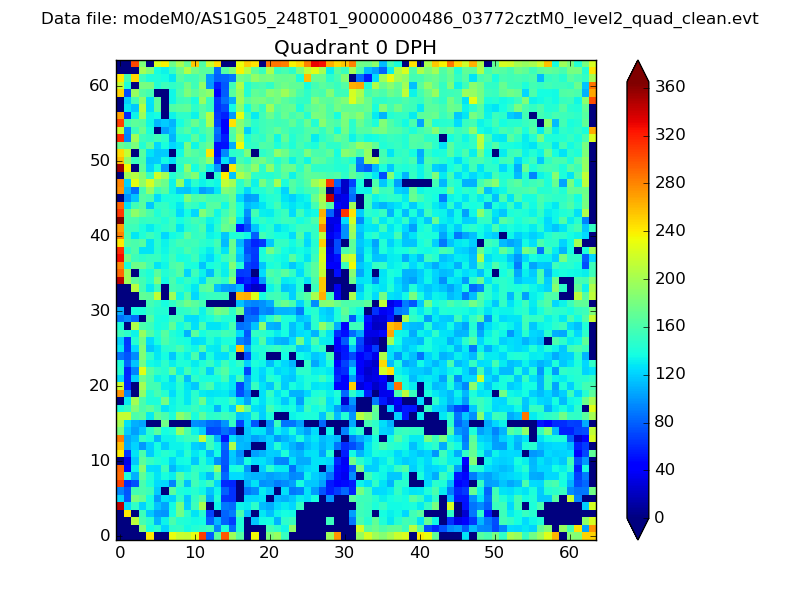 |
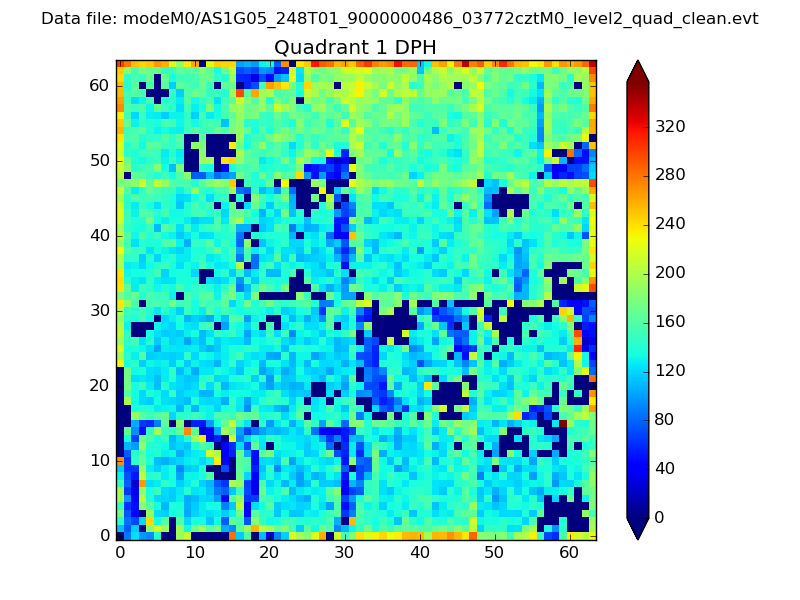 |
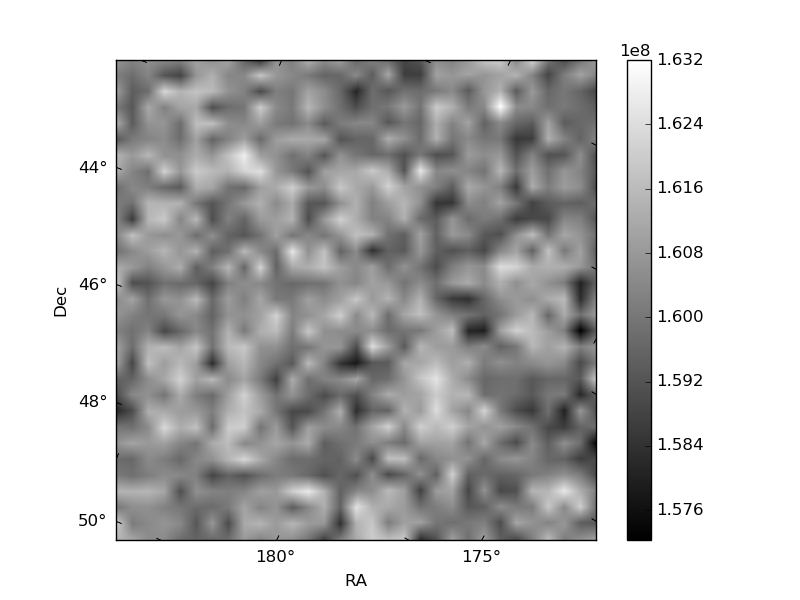
Quadrant B |
|---|---|---|---|
| Quadrant D | 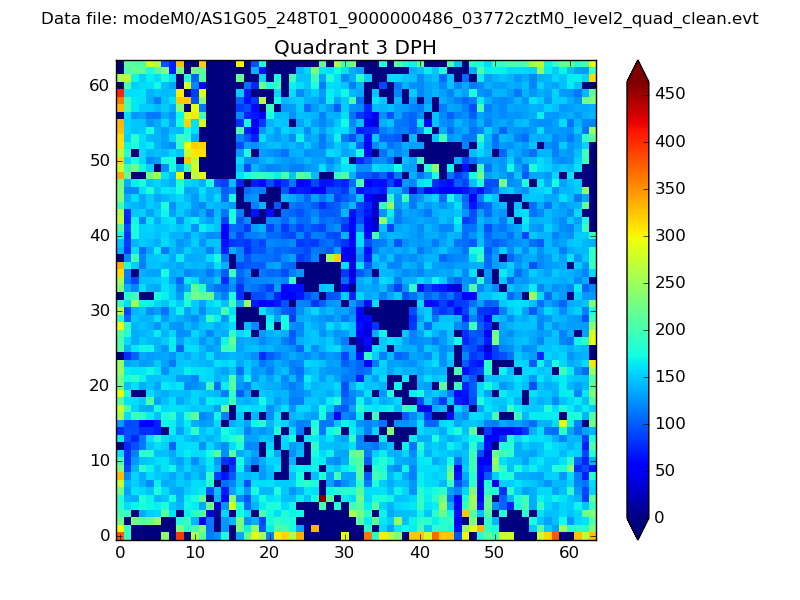 |
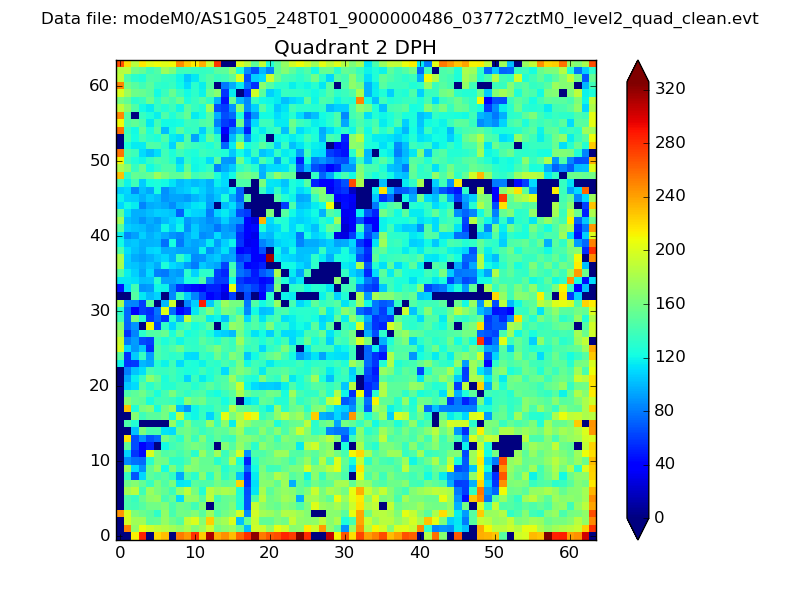 |
Quadrant C |
| Plot type | Count rate plots | Images |
|---|---|---|
| Comparison with Poisson distribution Blue bars denote a histogram of data divided into 1 sec bins. Red curve is a Poisson curve with rate = median count rate of data. |
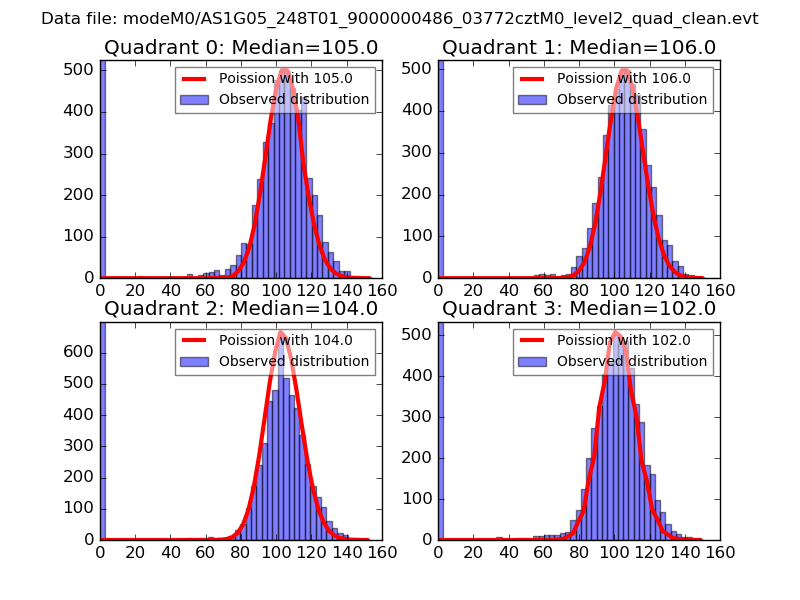 |
 |
| Quadrant-wise count rates Data is divided into 100 sec bins |
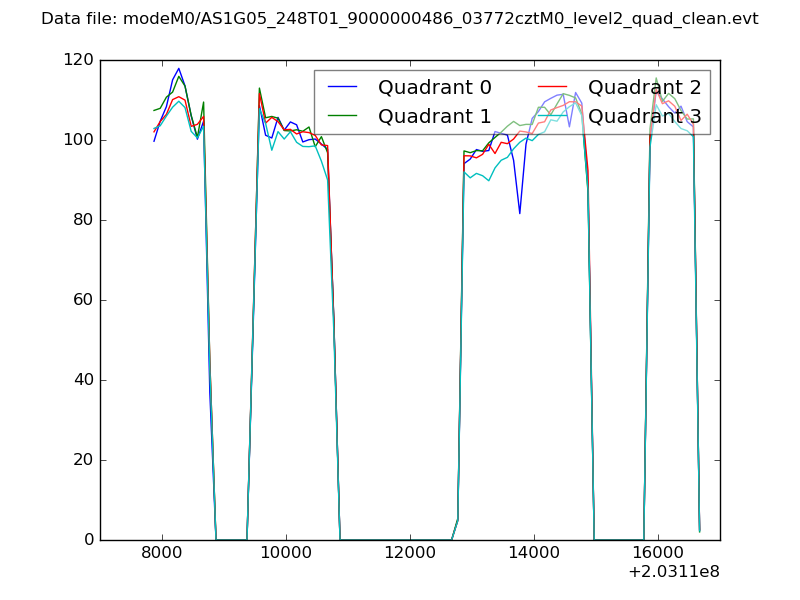 |
|
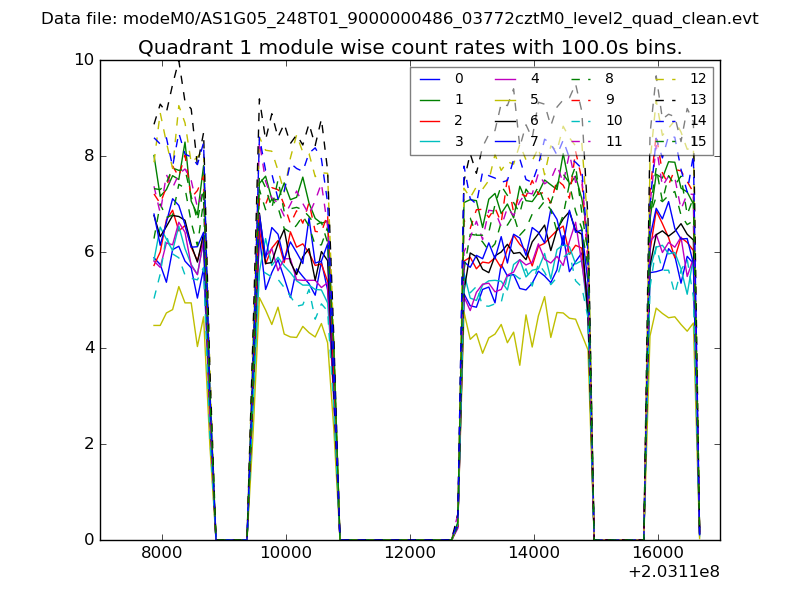
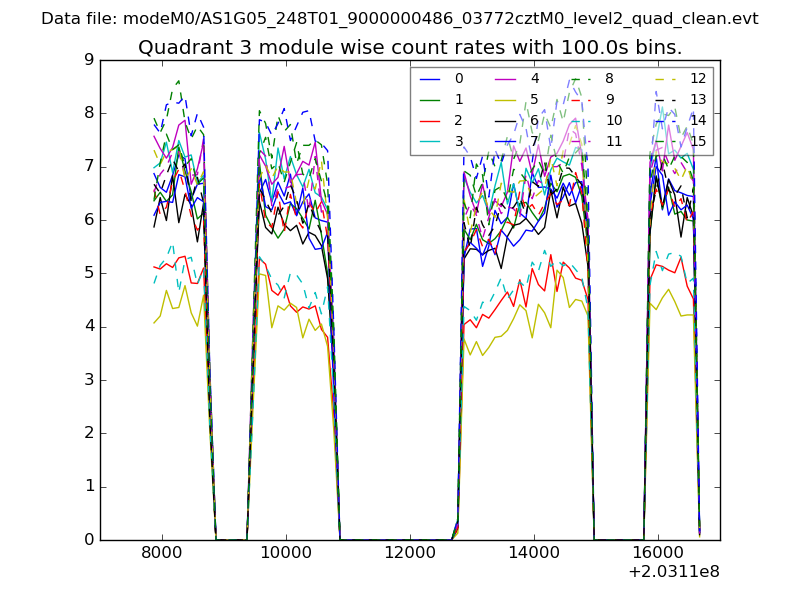
| Module-wise count rates for Quadrant A Data is divided into 100 sec bins |
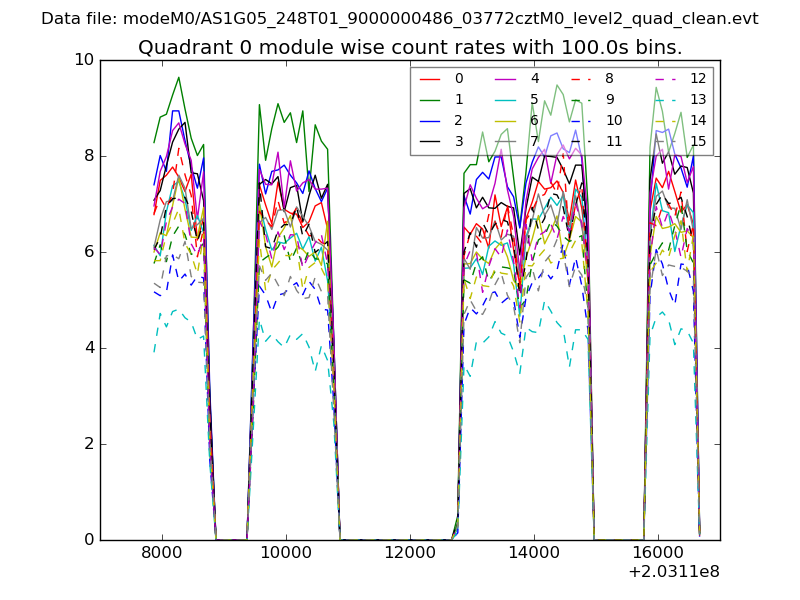 |
 |
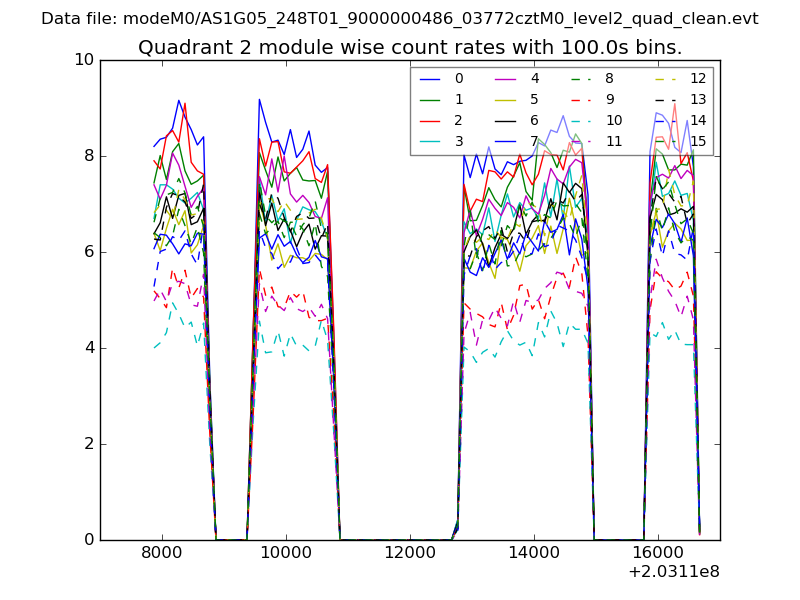
| Module-wise count rates for Quadrant B Data is divided into 100 sec bins |
 |
 |
| Module-wise count rates for Quadrant C Data is divided into 100 sec bins |
 |
 |
| Module-wise count rates for Quadrant D Data is divided into 100 sec bins |
 |
 |
| Parameter | Plot |
|---|---|
| CZT HV Monitor | 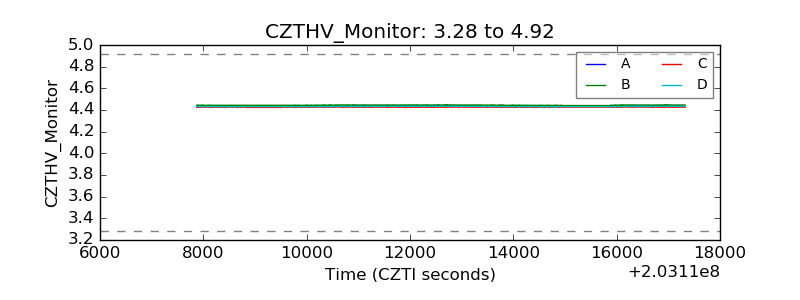 |
| D_VDD |  |
| Temperature 1 | 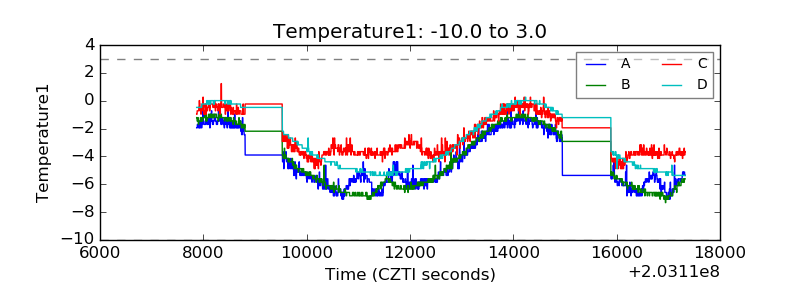 |
| Veto HV Monitor | 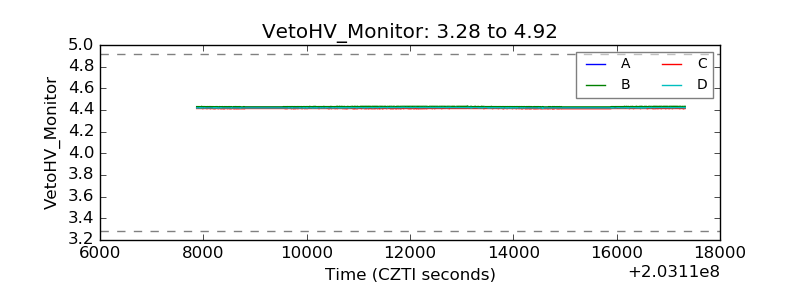 |
| Veto LLD | 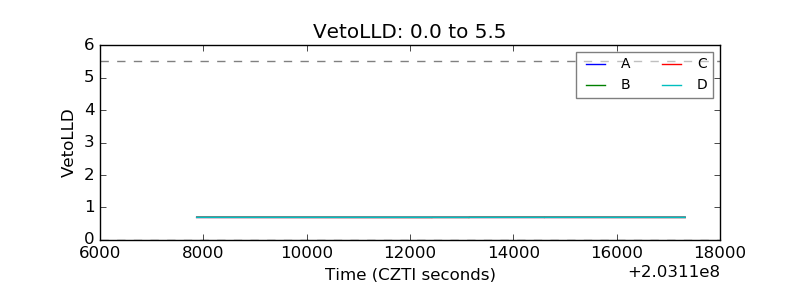 |
| Alpha Counter | 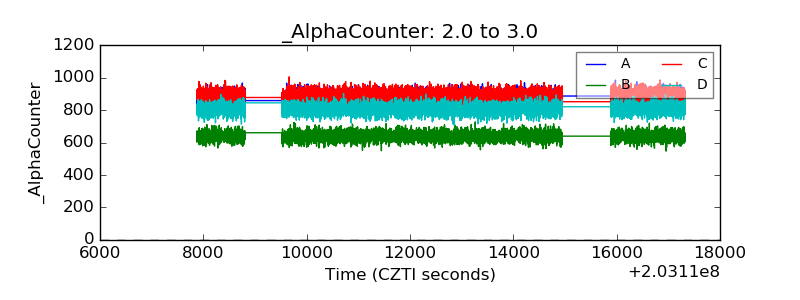 |
| _CPM_Rate | 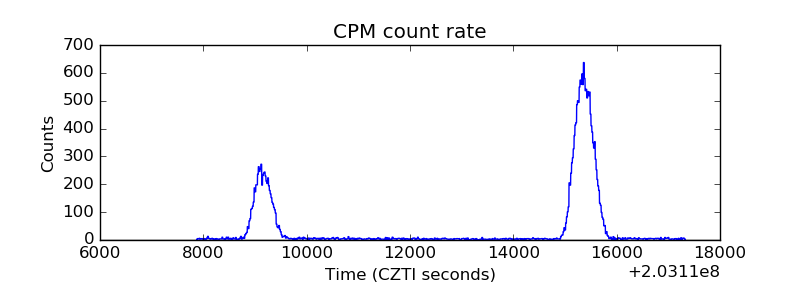 |
| CZT Counter | 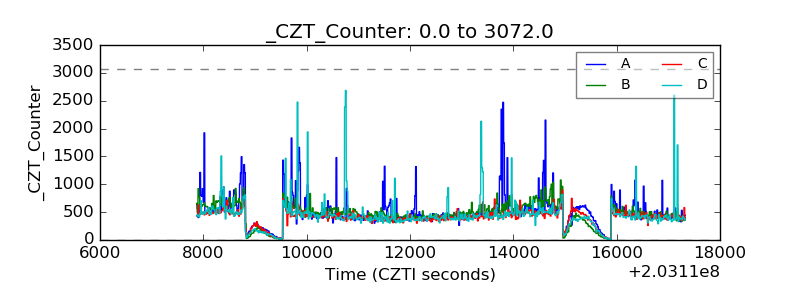 |
| +2.5 Volts monitor |  |
| +5 Volts monitor |  |
| Veto Counter | 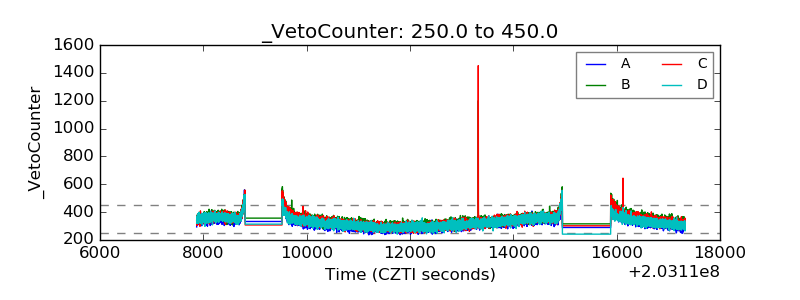 |