| Param | Original file | Final file |
|---|---|---|
| Filename | modeM0/AS1G05_248T01_9000000486_03773cztM0_level2.evt | modeM0/AS1G05_248T01_9000000486_03773cztM0_level2_quad_clean.evt |
| Size (bytes) | 463,216,320 | 71,683,200 |
| Size | 441.8 MB | 68.4 MB |
| Events in quadrant A | 3,782,641 | 423,492 |
| Events in quadrant B | 3,527,983 | 428,940 |
| Events in quadrant C | 3,068,548 | 424,191 |
| Events in quadrant D | 3,178,608 | 411,234 |
| Mode SS | |||
|---|---|---|---|
| Quadrant | BADHDUFLAG | Total packets | Discarded packets |
| A | 0 | 142 | 0 |
| B | 0 | 142 | 0 |
| C | 0 | 142 | 0 |
| D | 0 | 142 | 0 |
| Mode M9 | |||
|---|---|---|---|
| Quadrant | BADHDUFLAG | Total packets | Discarded packets |
| A | 0 | 20 | 0 |
| B | 0 | 20 | 0 |
| C | 0 | 20 | 0 |
| D | 0 | 20 | 0 |
| Mode M0 | |||
|---|---|---|---|
| Quadrant | BADHDUFLAG | Total packets | Discarded packets |
| A | 0 | 16059 | 3 |
| B | 0 | 15111 | 2 |
| C | 0 | 14056 | 2 |
| D | 0 | 14589 | 2 |
| Quadrant | Total seconds | Saturated seconds | Saturation percentage |
|---|---|---|---|
| A | 6929 | 138 | 1.991629% |
| B | 6929 | 46 | 0.663876% |
| C | 6929 | 14 | 0.202049% |
| D | 6929 | 38 | 0.548420% |
Noise dominated data is calculated using 1-second bins in cleaned event files. If a bin has >2000 counts, and if more than 50% of those come from <1% of pixels, then it is considered to be noise-dominated and hence unusable.
| Quadrant | # 1 sec bins | Bins with >0 counts | Bins with >2000 counts | High rate bins dominated by noise | Noise dominated (total time) | Noise dominated (detector-on time) | Marked lightcurve |
|---|---|---|---|---|---|---|---|
| A | 8929 | 6931 | 70 | 70 | 0.78% | 1.01% | 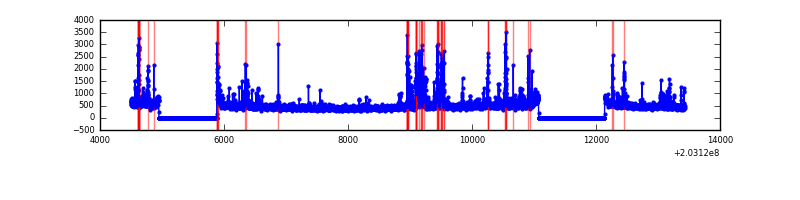 |
| B | 8929 | 6930 | 2 | 2 | 0.02% | 0.03% |  |
| C | 8929 | 6931 | 0 | 0 | 0.00% | 0.00% |  |
| D | 8929 | 6931 | 21 | 21 | 0.24% | 0.30% |  |
Top three noisy pixels from each quadrant. If the there are fewer than three noisy pixels in the level2.evt file, extra rows are filled as -1
| Pixel properties | Quadrant properties | ||||||
|---|---|---|---|---|---|---|---|
| Quadrant | DetID | PixID | Counts | Sigma | Mean | Median | Sigma |
| A | 0 | 118 | 282157 | 1701.35 | 799 | 782 | 165.4 |
| A | 13 | 251 | 183187 | 1102.92 | 799 | 782 | 165.4 |
| A | 0 | 50 | 115777 | 695.32 | 799 | 782 | 165.4 |
| B | 15 | 204 | 271079 | 1698.58 | 816 | 796 | 159.1 |
| B | 4 | 81 | 37472 | 230.49 | 816 | 796 | 159.1 |
| B | 5 | 200 | 16584 | 99.22 | 816 | 796 | 159.1 |
| C | 13 | 61 | 6618 | 31.79 | 783 | 786 | 183.4 |
| C | 9 | 144 | 2878 | 11.4 | 783 | 786 | 183.4 |
| C | 12 | 4 | 2705 | 10.46 | 783 | 786 | 183.4 |
| D | 13 | 223 | 72329 | 379.65 | 776 | 756 | 188.5 |
| D | 1 | 20 | 47666 | 248.83 | 776 | 756 | 188.5 |
| D | 13 | 239 | 43140 | 224.82 | 776 | 756 | 188.5 |
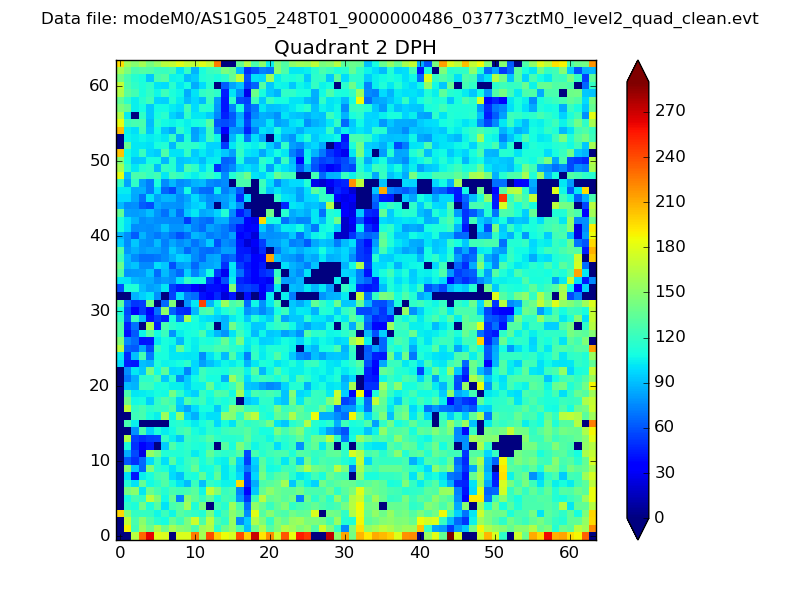
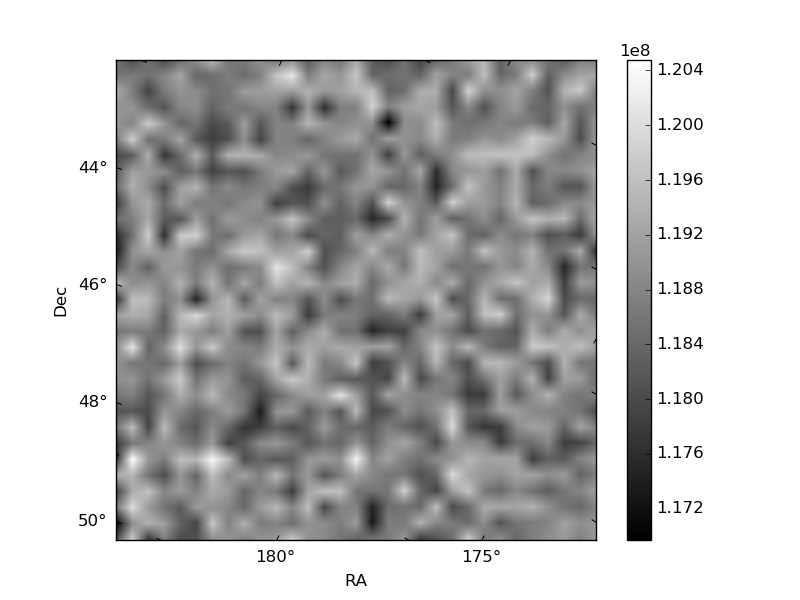
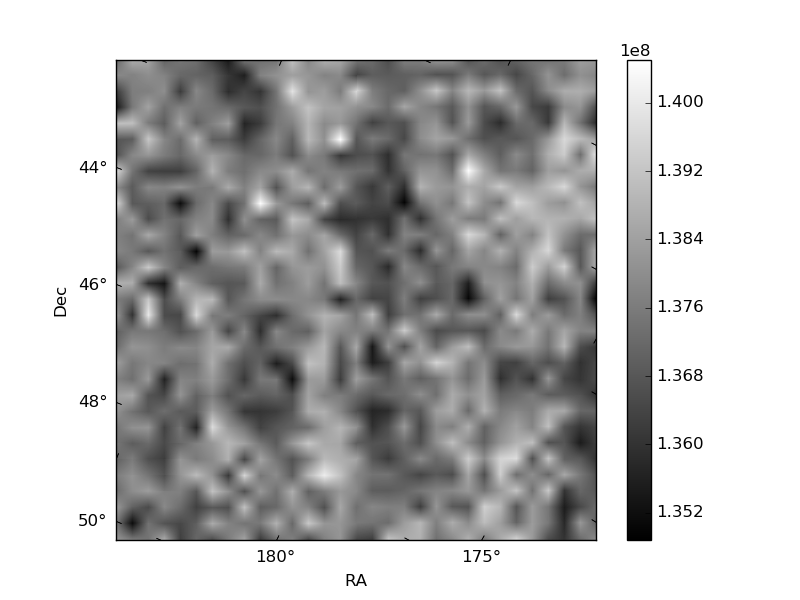
Histogram calculated using DETX and DETY for each event in the final _common_clean file
| Quadrant A | 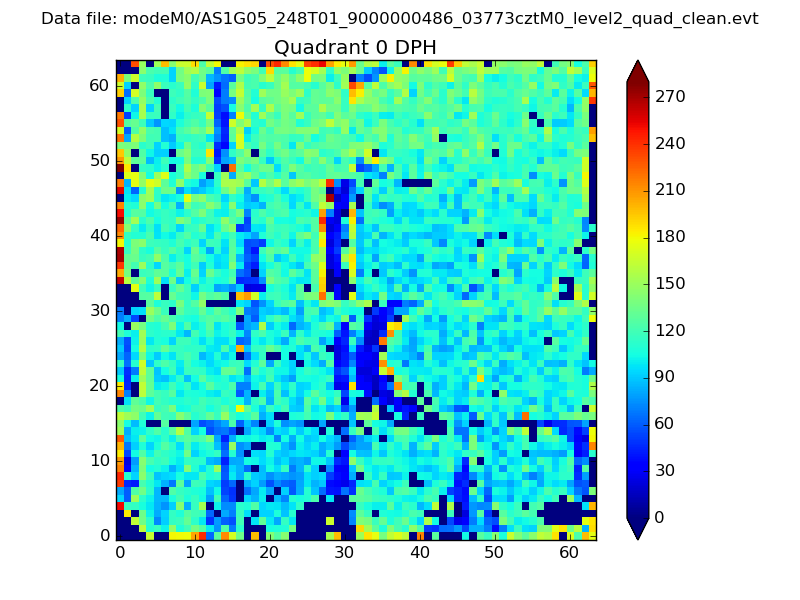 |
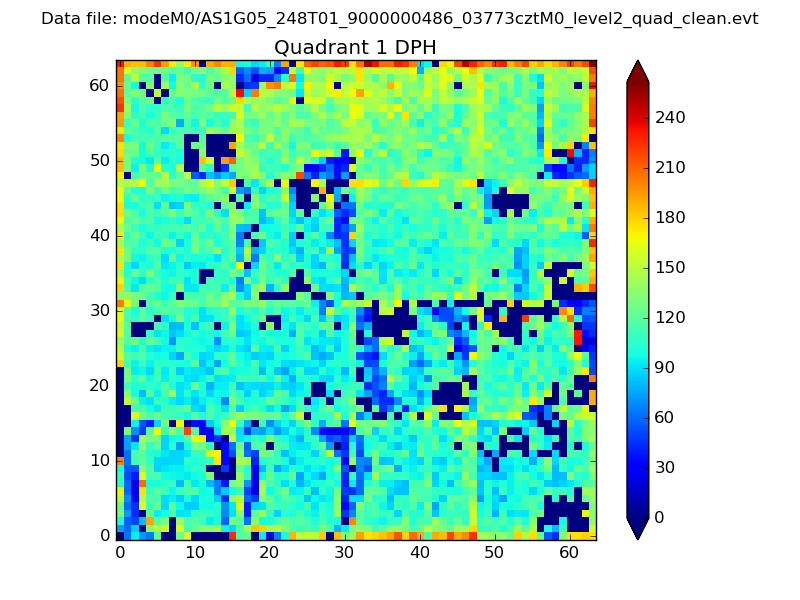 |
Quadrant B |
|---|---|---|---|
| Quadrant D | 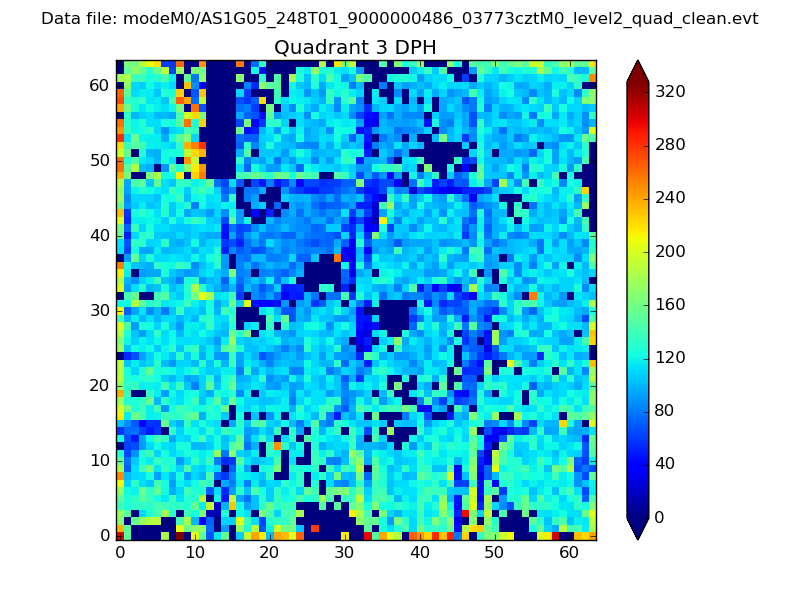 |
 |
Quadrant C |
| Plot type | Count rate plots | Images |
|---|---|---|
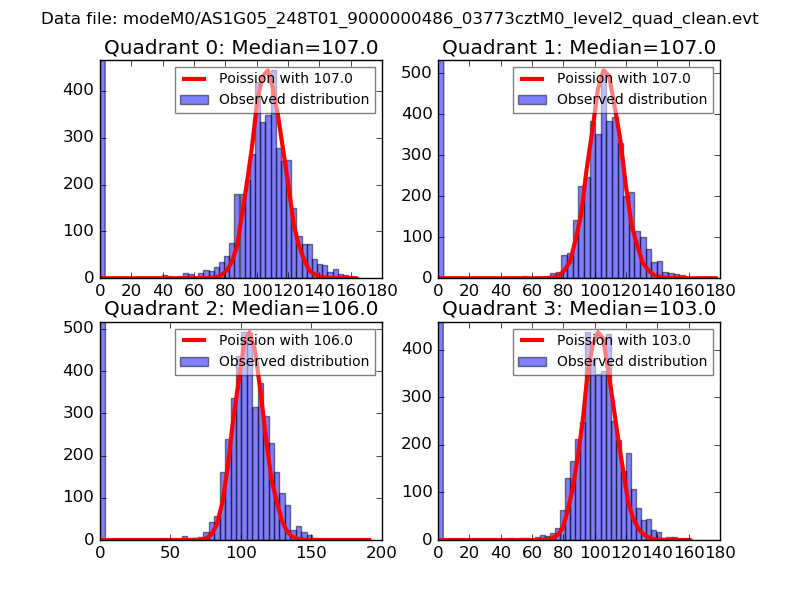
| Comparison with Poisson distribution Blue bars denote a histogram of data divided into 1 sec bins. Red curve is a Poisson curve with rate = median count rate of data. |
 |
 |
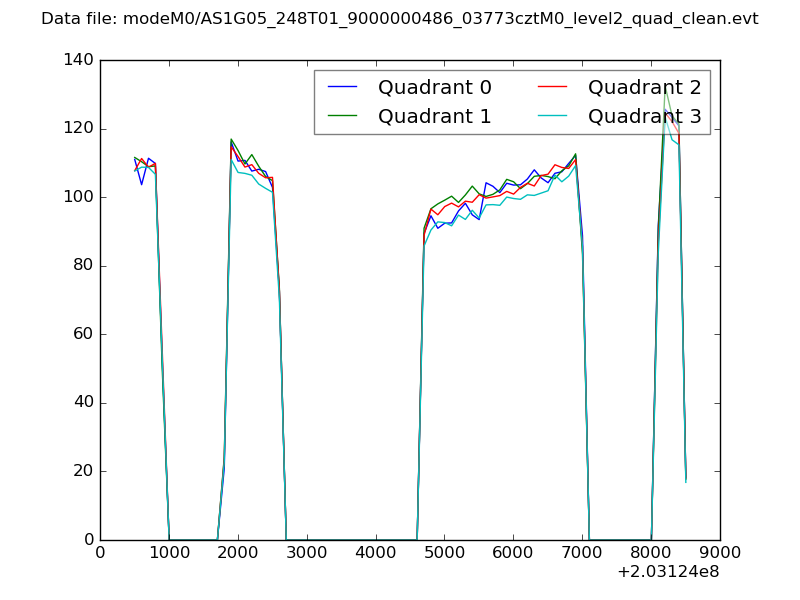
| Quadrant-wise count rates Data is divided into 100 sec bins |
 |
|
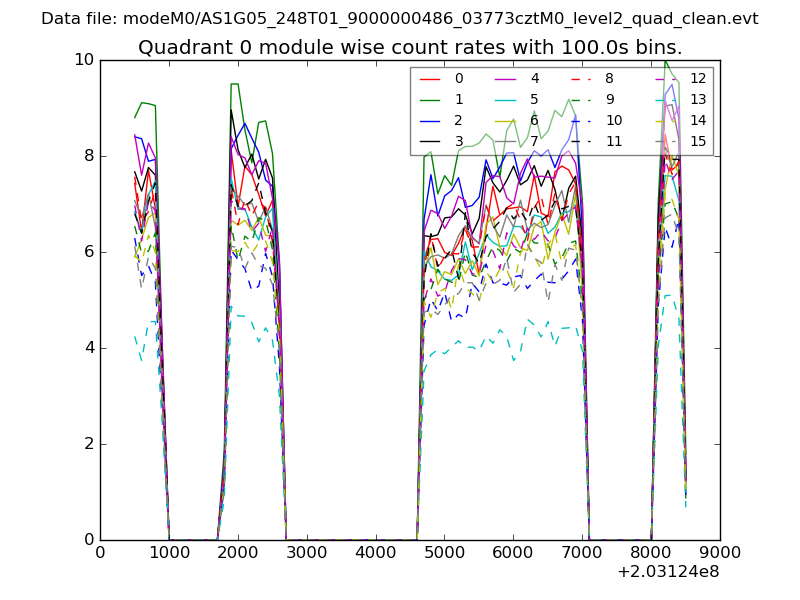
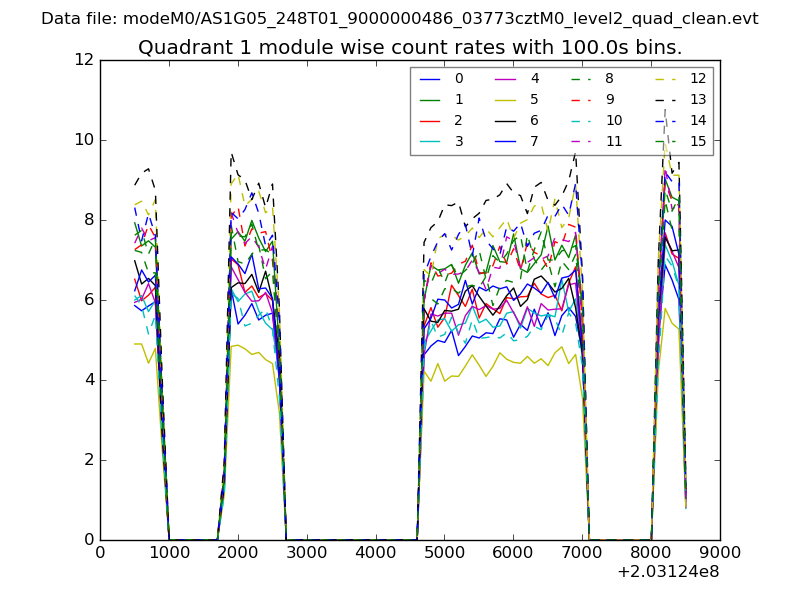
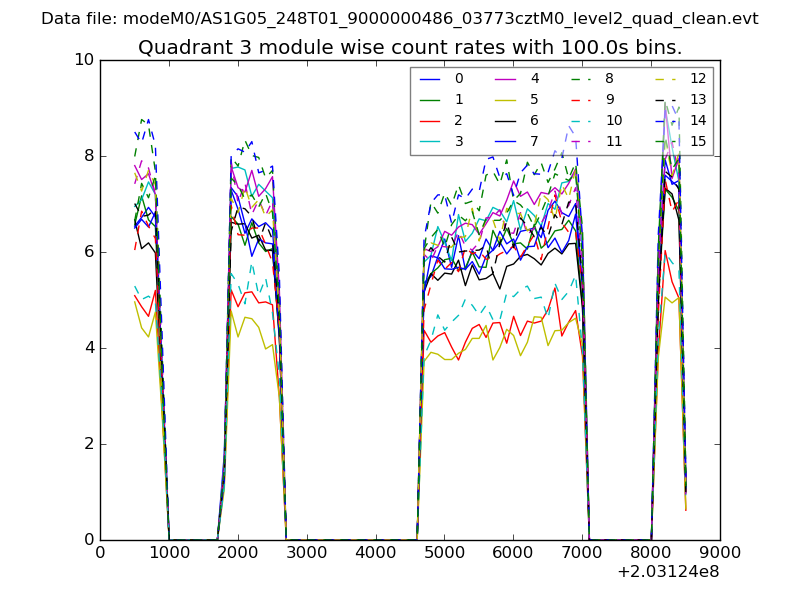
| Module-wise count rates for Quadrant A Data is divided into 100 sec bins |
 |
 |
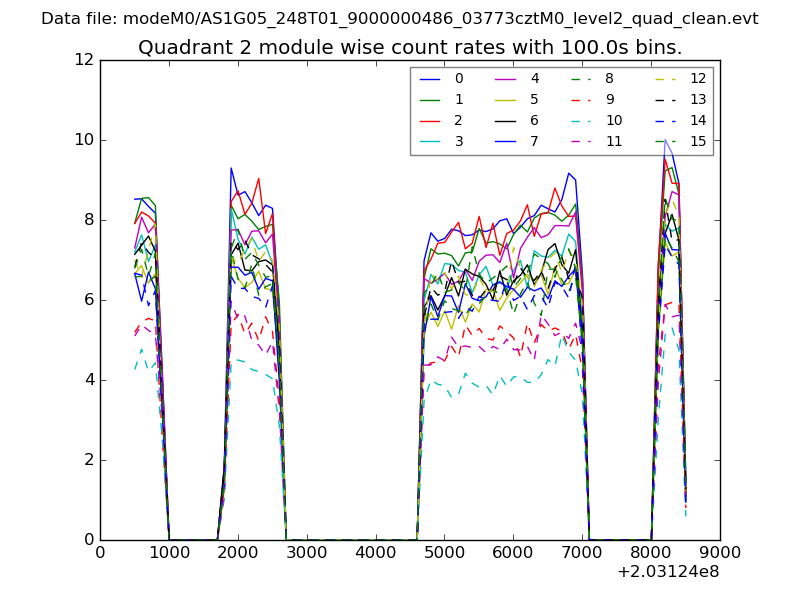
| Module-wise count rates for Quadrant B Data is divided into 100 sec bins |
 |
 |
| Module-wise count rates for Quadrant C Data is divided into 100 sec bins |
 |
 |
| Module-wise count rates for Quadrant D Data is divided into 100 sec bins |
 |
 |
| Parameter | Plot |
|---|---|
| CZT HV Monitor | 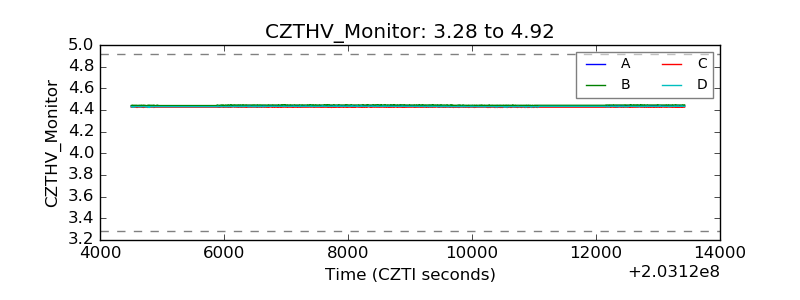 |
| D_VDD | 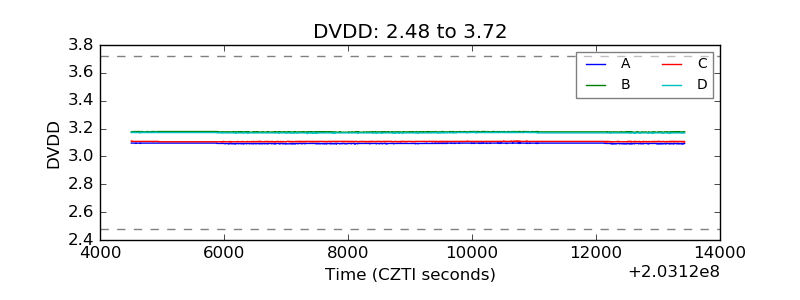 |
| Temperature 1 | 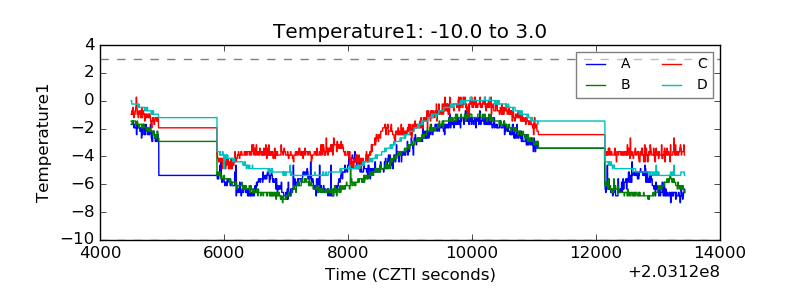 |
| Veto HV Monitor | 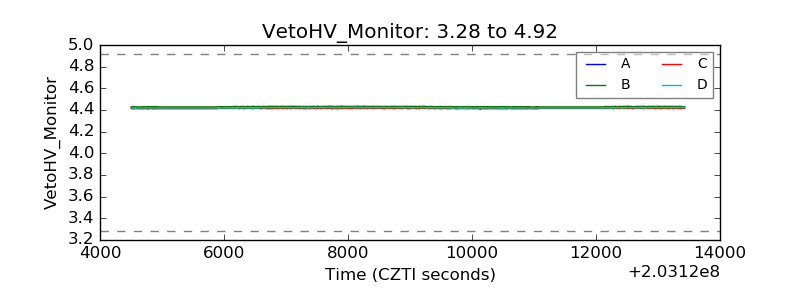 |
| Veto LLD | 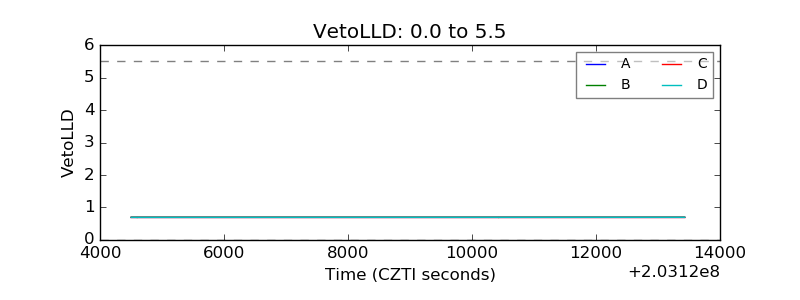 |
| Alpha Counter | 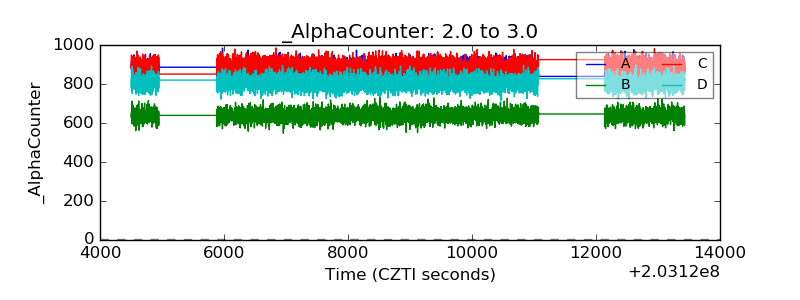 |
| _CPM_Rate | 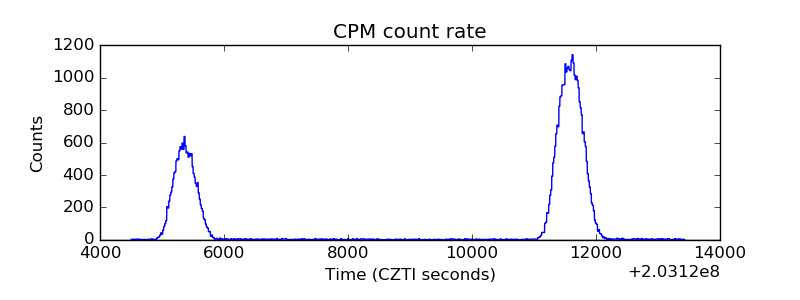 |
| CZT Counter | 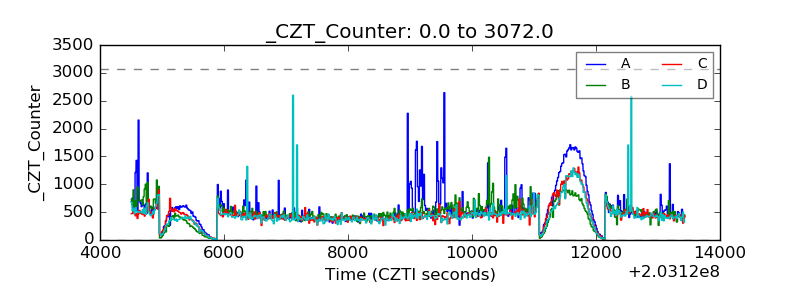 |
| +2.5 Volts monitor |  |
| +5 Volts monitor |  |
| Veto Counter | 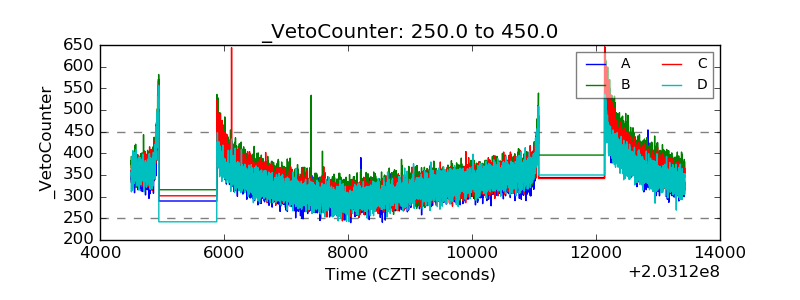 |