| Param | Original file | Final file |
|---|---|---|
| Filename | modeM0/AS1G05_248T01_9000000486_03775cztM0_level2.evt | modeM0/AS1G05_248T01_9000000486_03775cztM0_level2_quad_clean.evt |
| Size (bytes) | 488,462,400 | 57,101,760 |
| Size | 465.8 MB | 54.5 MB |
| Events in quadrant A | 3,578,548 | 326,459 |
| Events in quadrant B | 3,349,676 | 329,558 |
| Events in quadrant C | 3,020,909 | 324,659 |
| Events in quadrant D | 4,404,294 | 296,037 |
| Mode SS | |||
|---|---|---|---|
| Quadrant | BADHDUFLAG | Total packets | Discarded packets |
| A | 0 | 132 | 0 |
| B | 0 | 132 | 0 |
| C | 0 | 132 | 0 |
| D | 0 | 132 | 0 |
| Mode M9 | |||
|---|---|---|---|
| Quadrant | BADHDUFLAG | Total packets | Discarded packets |
| A | 0 | 13 | 0 |
| B | 0 | 13 | 0 |
| C | 0 | 13 | 0 |
| D | 0 | 14 | 0 |
| Mode M0 | |||
|---|---|---|---|
| Quadrant | BADHDUFLAG | Total packets | Discarded packets |
| A | 0 | 14858 | 3 |
| B | 0 | 14118 | 2 |
| C | 0 | 13463 | 2 |
| D | 0 | 17719 | 2 |
| Quadrant | Total seconds | Saturated seconds | Saturation percentage |
|---|---|---|---|
| A | 6473 | 165 | 2.549050% |
| B | 6473 | 52 | 0.803337% |
| C | 6473 | 65 | 1.004171% |
| D | 6473 | 431 | 6.658427% |
Noise dominated data is calculated using 1-second bins in cleaned event files. If a bin has >2000 counts, and if more than 50% of those come from <1% of pixels, then it is considered to be noise-dominated and hence unusable.
| Quadrant | # 1 sec bins | Bins with >0 counts | Bins with >2000 counts | High rate bins dominated by noise | Noise dominated (total time) | Noise dominated (detector-on time) | Marked lightcurve |
|---|---|---|---|---|---|---|---|
| A | 7628 | 6473 | 98 | 98 | 1.28% | 1.51% | 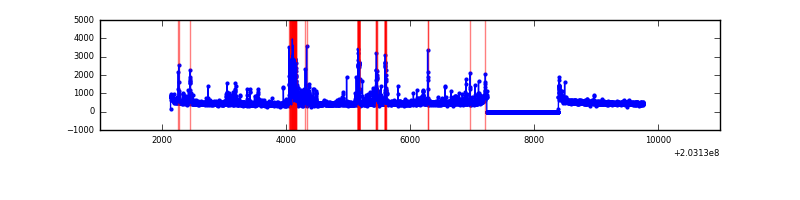 |
| B | 7628 | 6473 | 1 | 1 | 0.01% | 0.02% | 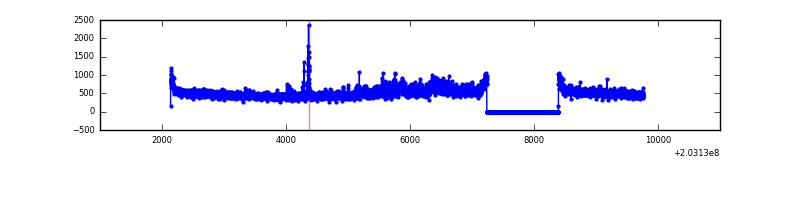 |
| C | 7628 | 6474 | 33 | 33 | 0.43% | 0.51% | 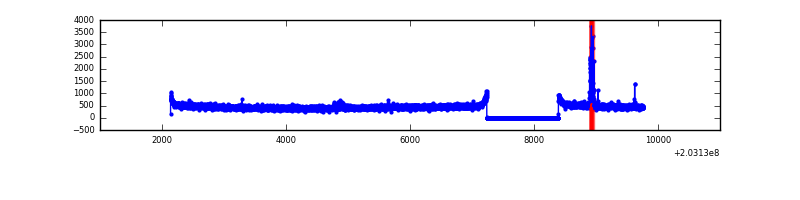 |
| D | 7628 | 6473 | 356 | 356 | 4.67% | 5.50% | 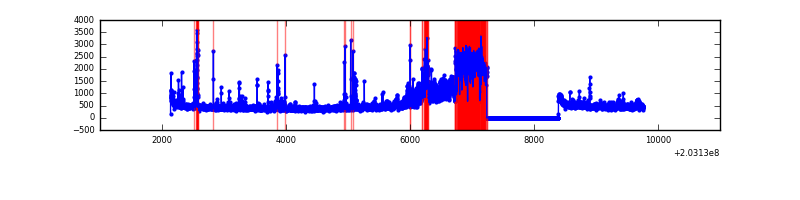 |
Top three noisy pixels from each quadrant. If the there are fewer than three noisy pixels in the level2.evt file, extra rows are filled as -1
| Pixel properties | Quadrant properties | ||||||
|---|---|---|---|---|---|---|---|
| Quadrant | DetID | PixID | Counts | Sigma | Mean | Median | Sigma |
| A | 13 | 251 | 375071 | 2390.41 | 765 | 747 | 156.6 |
| A | 0 | 118 | 142430 | 904.78 | 765 | 747 | 156.6 |
| A | 0 | 50 | 75013 | 474.26 | 765 | 747 | 156.6 |
| B | 15 | 204 | 264346 | 1754.29 | 782 | 763 | 150.3 |
| B | 4 | 81 | 40827 | 266.65 | 782 | 763 | 150.3 |
| B | 15 | 54 | 15435 | 97.65 | 782 | 763 | 150.3 |
| C | 2 | 53 | 111658 | 641.34 | 743 | 746 | 172.9 |
| C | 13 | 61 | 6296 | 32.09 | 743 | 746 | 172.9 |
| C | 14 | 67 | 3485 | 15.84 | 743 | 746 | 172.9 |
| D | 1 | 20 | 1259068 | 7175.0 | 724 | 703 | 175.4 |
| D | 1 | 84 | 99136 | 561.25 | 724 | 703 | 175.4 |
| D | 13 | 249 | 68046 | 383.98 | 724 | 703 | 175.4 |
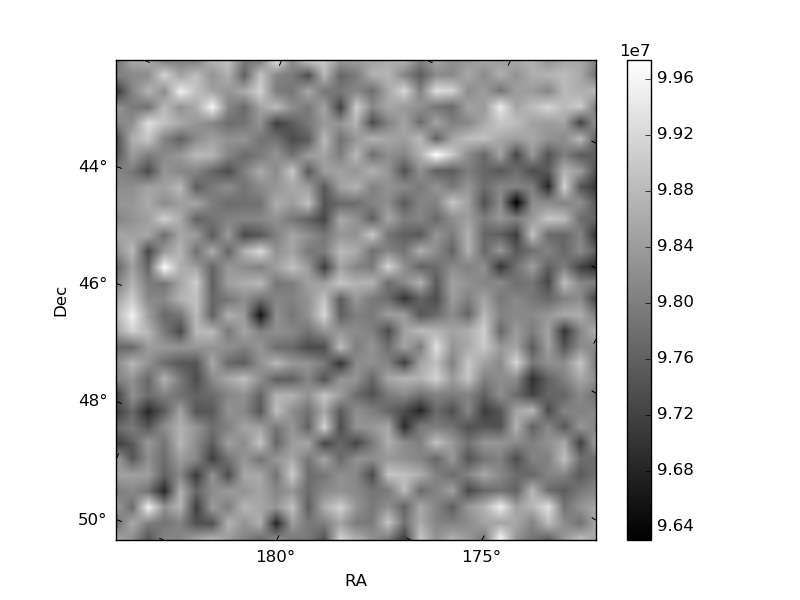
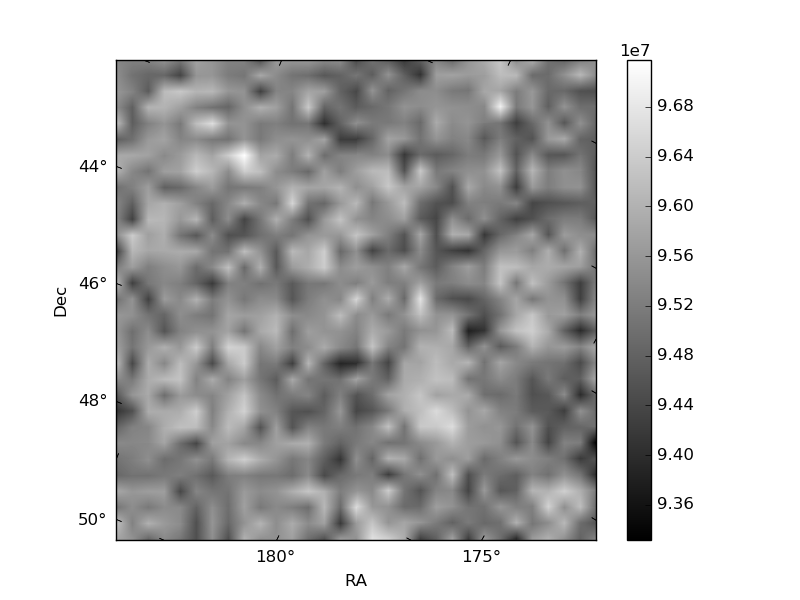
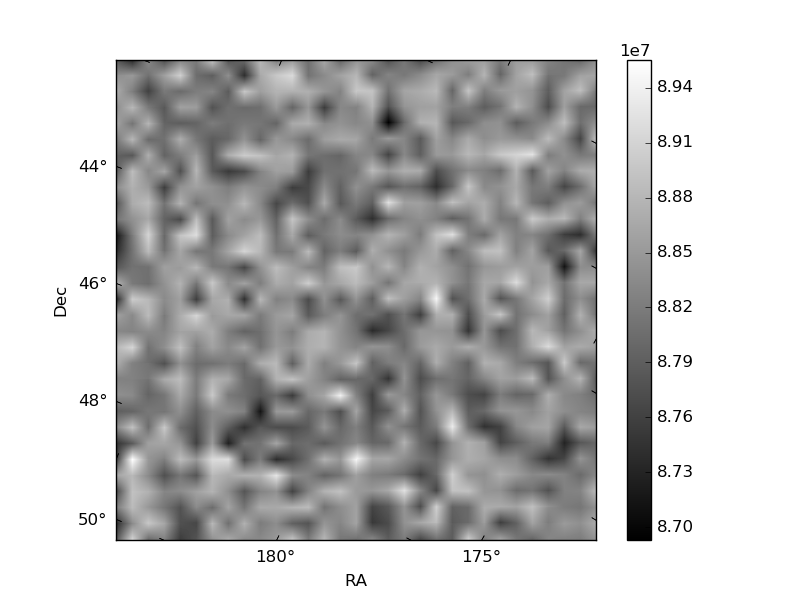
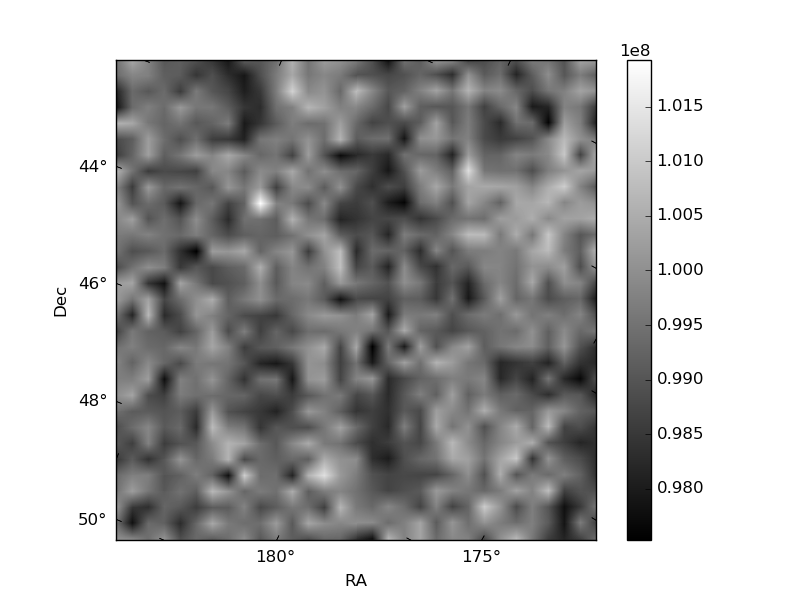
Histogram calculated using DETX and DETY for each event in the final _common_clean file
| Quadrant A | 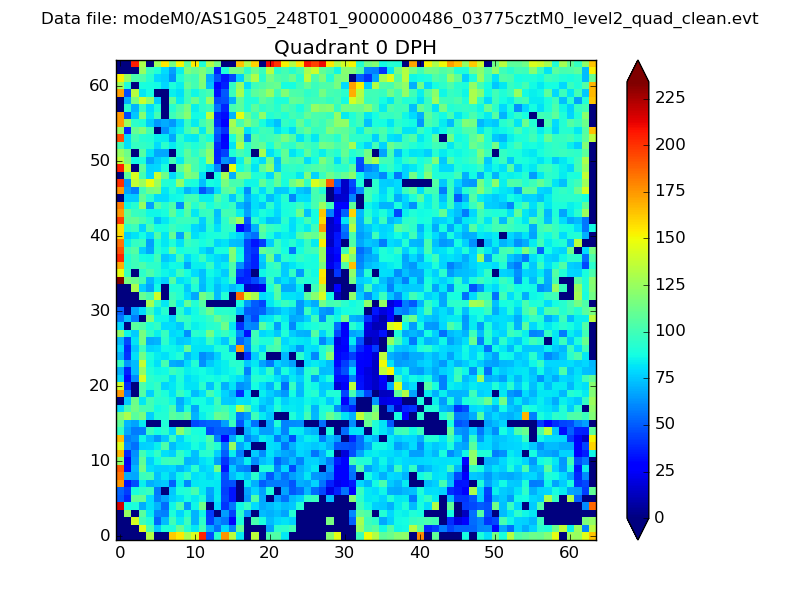 |
 |
Quadrant B |
|---|---|---|---|
| Quadrant D |  |
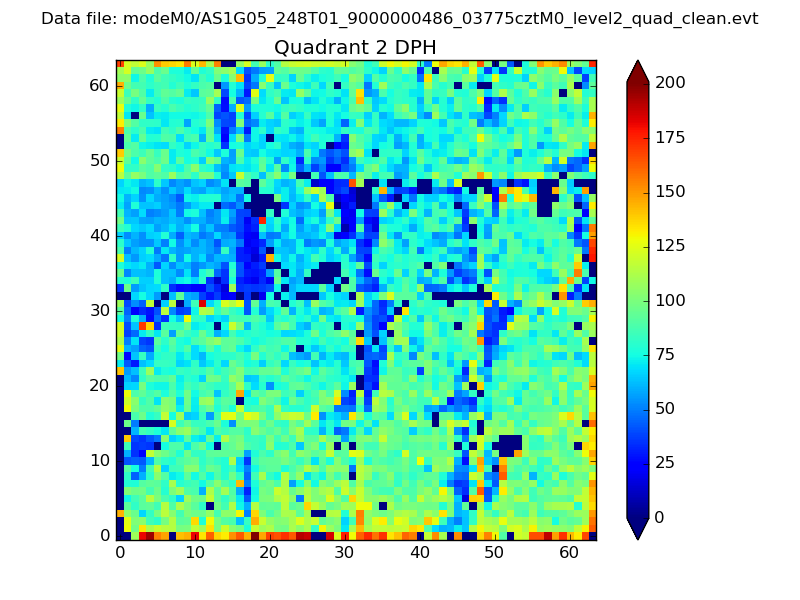 |
Quadrant C |
| Plot type | Count rate plots | Images |
|---|---|---|
| Comparison with Poisson distribution Blue bars denote a histogram of data divided into 1 sec bins. Red curve is a Poisson curve with rate = median count rate of data. |
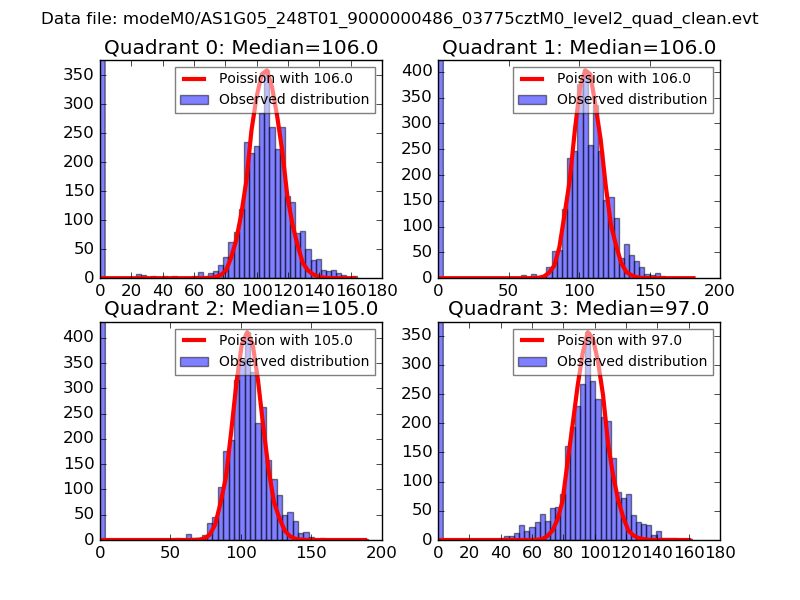 |
 |
| Quadrant-wise count rates Data is divided into 100 sec bins |
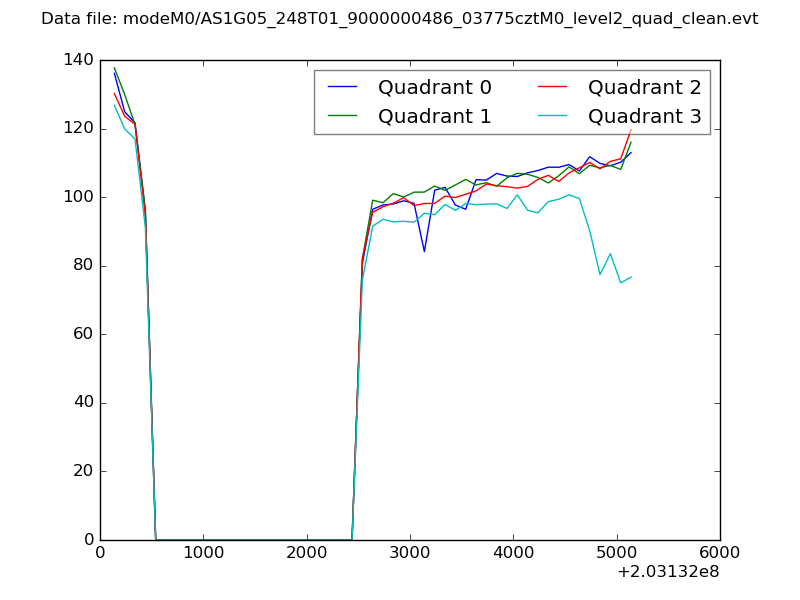 |
|
| Module-wise count rates for Quadrant A Data is divided into 100 sec bins |
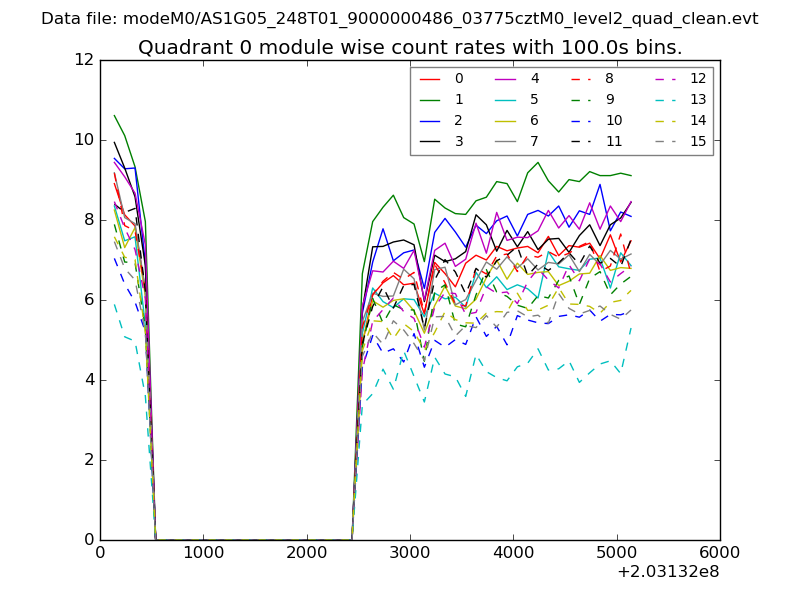 |
 |
| Module-wise count rates for Quadrant B Data is divided into 100 sec bins |
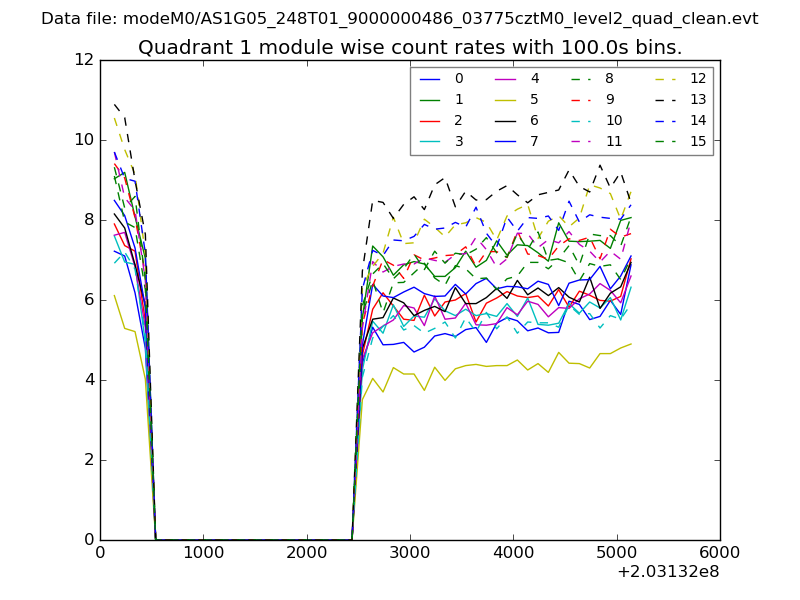 |
 |
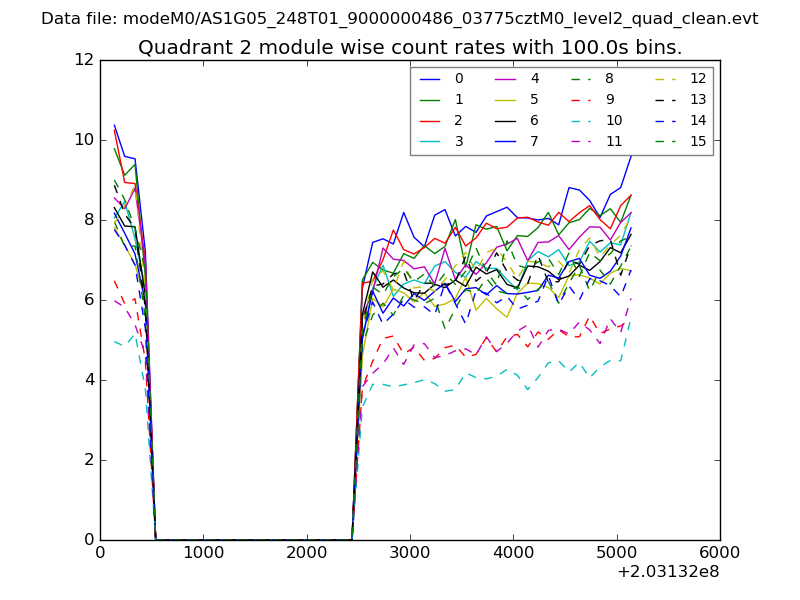
| Module-wise count rates for Quadrant C Data is divided into 100 sec bins |
 |
 |
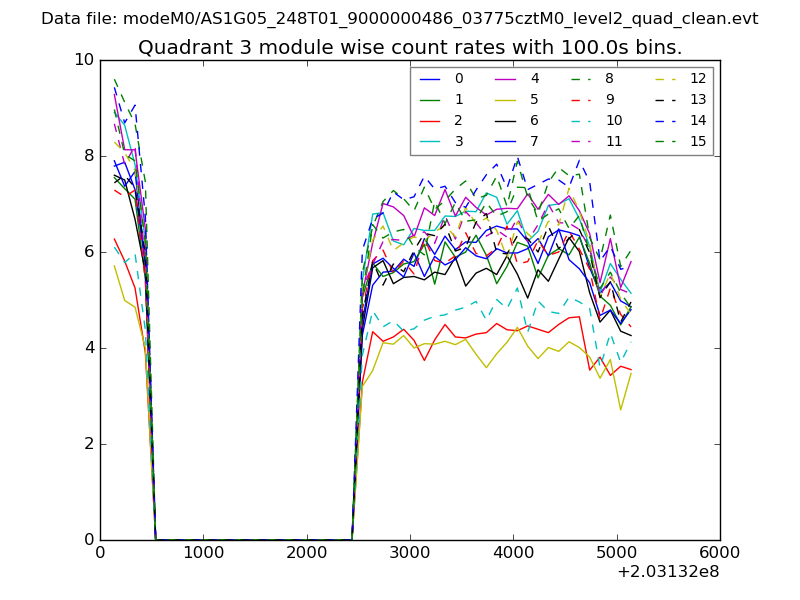
| Module-wise count rates for Quadrant D Data is divided into 100 sec bins |
 |
 |
| Parameter | Plot |
|---|---|
| CZT HV Monitor | 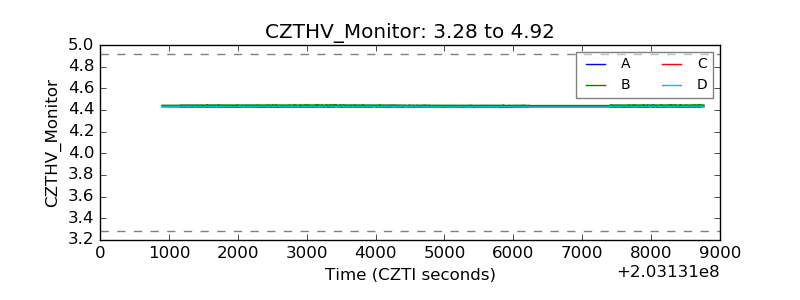 |
| D_VDD | 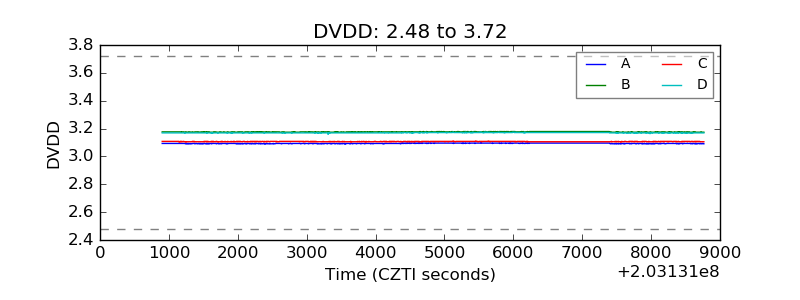 |
| Temperature 1 |  |
| Veto HV Monitor | 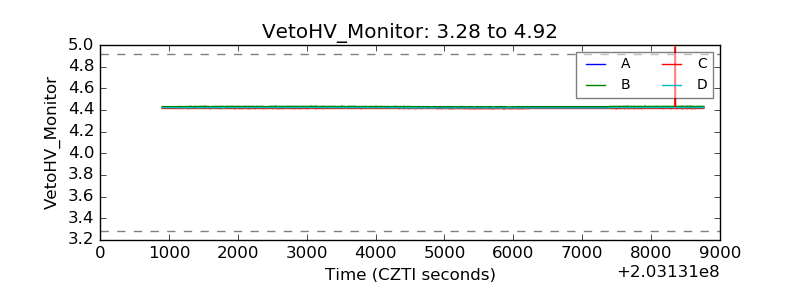 |
| Veto LLD |  |
| Alpha Counter | 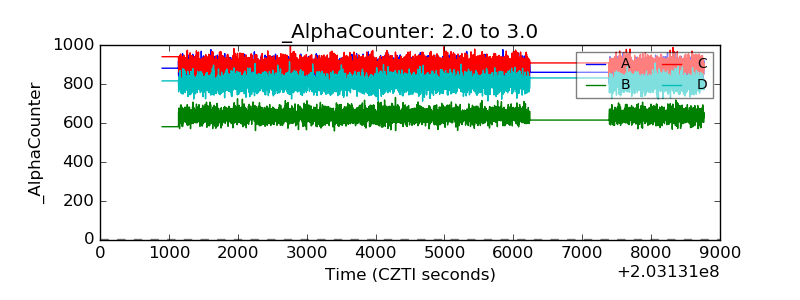 |
| _CPM_Rate | 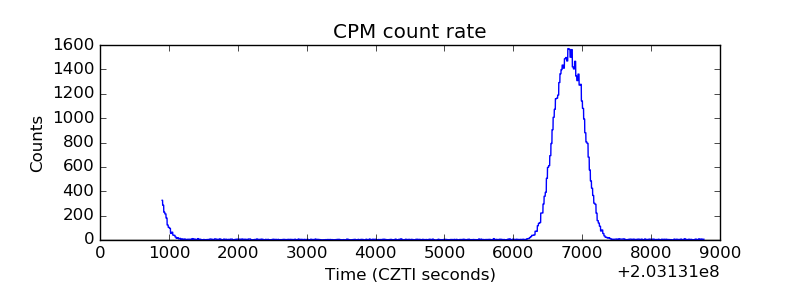 |
| CZT Counter | 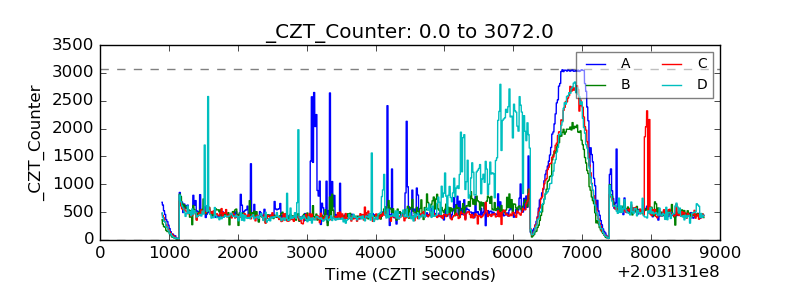 |
| +2.5 Volts monitor |  |
| +5 Volts monitor |  |
| Veto Counter | 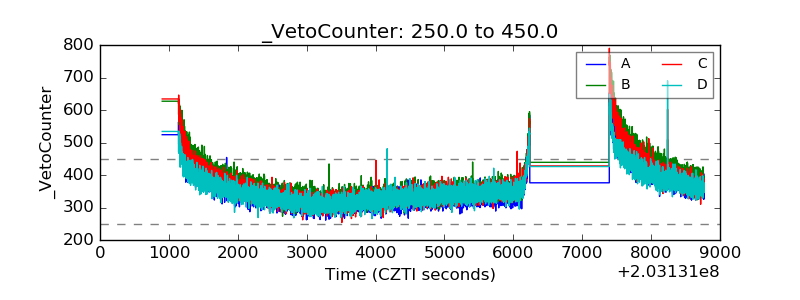 |