| Param | Original file | Final file |
|---|---|---|
| Filename | modeM0/AS1G05_248T01_9000000486_03776cztM0_level2.evt | modeM0/AS1G05_248T01_9000000486_03776cztM0_level2_quad_clean.evt |
| Size (bytes) | 522,702,720 | 56,232,000 |
| Size | 498.5 MB | 53.6 MB |
| Events in quadrant A | 3,582,478 | 320,299 |
| Events in quadrant B | 3,712,528 | 320,397 |
| Events in quadrant C | 3,648,013 | 313,915 |
| Events in quadrant D | 4,452,674 | 300,672 |
| Mode SS | |||
|---|---|---|---|
| Quadrant | BADHDUFLAG | Total packets | Discarded packets |
| A | 0 | 130 | 0 |
| B | 0 | 130 | 0 |
| C | 0 | 130 | 0 |
| D | 0 | 130 | 0 |
| Mode M9 | |||
|---|---|---|---|
| Quadrant | BADHDUFLAG | Total packets | Discarded packets |
| A | 0 | 22 | 0 |
| B | 0 | 22 | 0 |
| C | 0 | 22 | 0 |
| D | 0 | 23 | 0 |
| Mode M0 | |||
|---|---|---|---|
| Quadrant | BADHDUFLAG | Total packets | Discarded packets |
| A | 0 | 14687 | 3 |
| B | 0 | 14970 | 2 |
| C | 0 | 15208 | 2 |
| D | 0 | 17515 | 2 |
| Quadrant | Total seconds | Saturated seconds | Saturation percentage |
|---|---|---|---|
| A | 6406 | 182 | 2.841086% |
| B | 6406 | 121 | 1.888854% |
| C | 6406 | 87 | 1.358102% |
| D | 6406 | 136 | 2.123010% |
Noise dominated data is calculated using 1-second bins in cleaned event files. If a bin has >2000 counts, and if more than 50% of those come from <1% of pixels, then it is considered to be noise-dominated and hence unusable.
| Quadrant | # 1 sec bins | Bins with >0 counts | Bins with >2000 counts | High rate bins dominated by noise | Noise dominated (total time) | Noise dominated (detector-on time) | Marked lightcurve |
|---|---|---|---|---|---|---|---|
| A | 7661 | 6406 | 100 | 100 | 1.31% | 1.56% | 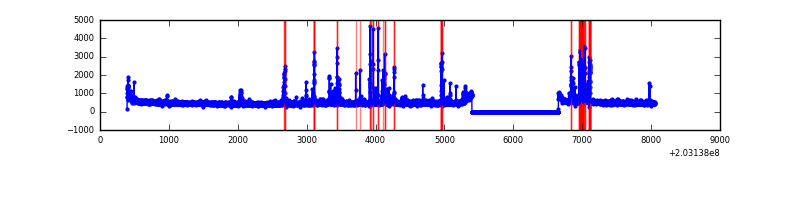 |
| B | 7661 | 6407 | 57 | 57 | 0.74% | 0.89% | 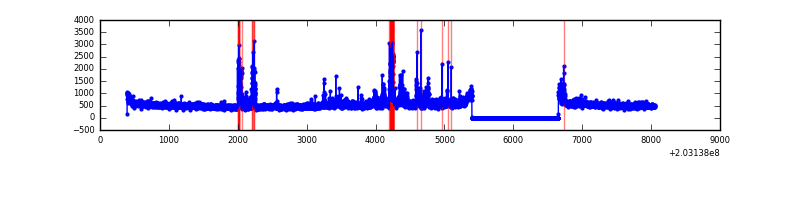 |
| C | 7661 | 6407 | 45 | 45 | 0.59% | 0.70% | 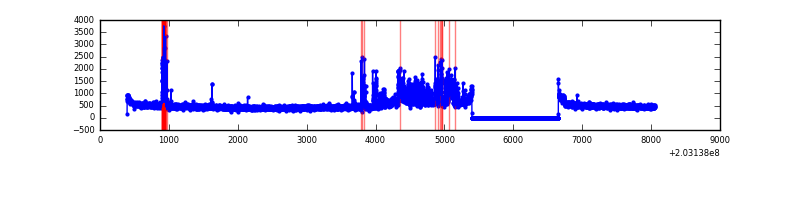 |
| D | 7661 | 6407 | 120 | 120 | 1.57% | 1.87% | 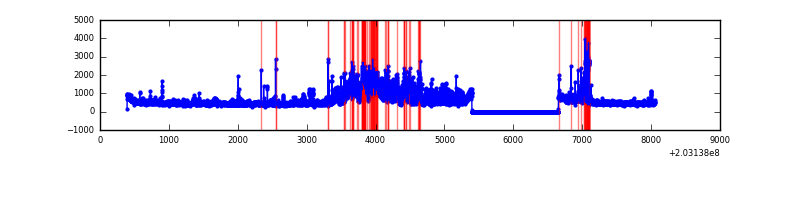 |
Top three noisy pixels from each quadrant. If the there are fewer than three noisy pixels in the level2.evt file, extra rows are filled as -1
| Pixel properties | Quadrant properties | ||||||
|---|---|---|---|---|---|---|---|
| Quadrant | DetID | PixID | Counts | Sigma | Mean | Median | Sigma |
| A | 0 | 50 | 215981 | 1337.67 | 785 | 768 | 160.9 |
| A | 13 | 251 | 163209 | 1009.66 | 785 | 768 | 160.9 |
| A | 0 | 118 | 118778 | 733.5 | 785 | 768 | 160.9 |
| B | 15 | 204 | 240450 | 1570.17 | 801 | 783 | 152.6 |
| B | 5 | 200 | 183521 | 1197.2 | 801 | 783 | 152.6 |
| B | 0 | 244 | 110838 | 721.02 | 801 | 783 | 152.6 |
| C | 2 | 53 | 681985 | 3854.82 | 758 | 763 | 176.7 |
| C | 13 | 61 | 6469 | 32.29 | 758 | 763 | 176.7 |
| C | 14 | 67 | 3146 | 13.48 | 758 | 763 | 176.7 |
| D | 1 | 20 | 842355 | 4659.48 | 752 | 730 | 180.6 |
| D | 1 | 84 | 575914 | 3184.38 | 752 | 730 | 180.6 |
| D | 13 | 223 | 52875 | 288.69 | 752 | 730 | 180.6 |
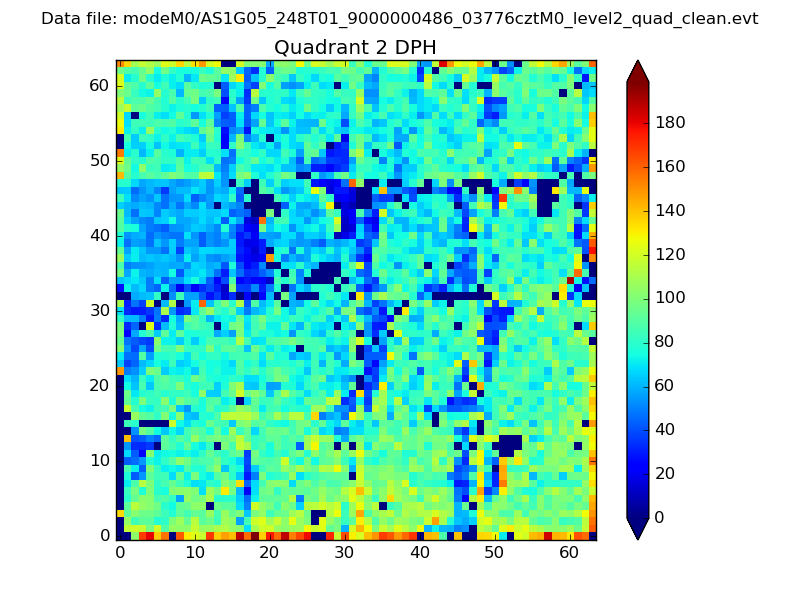
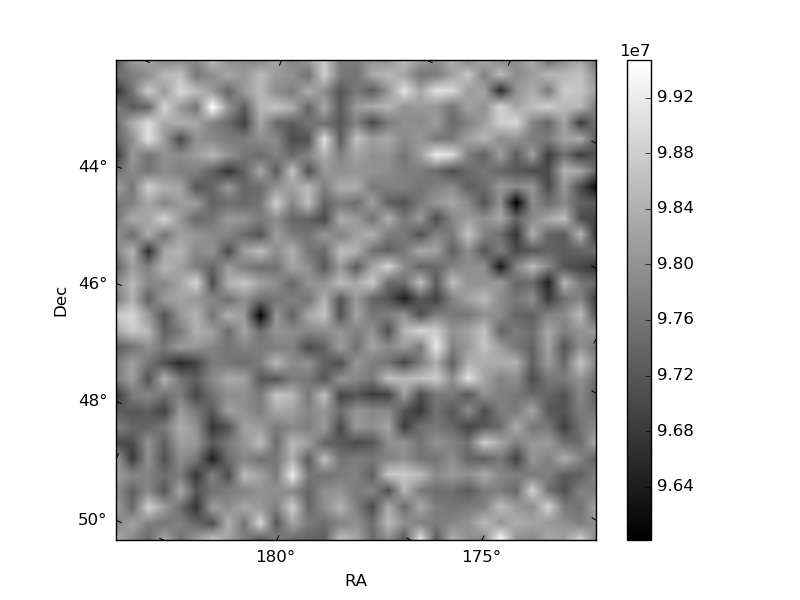
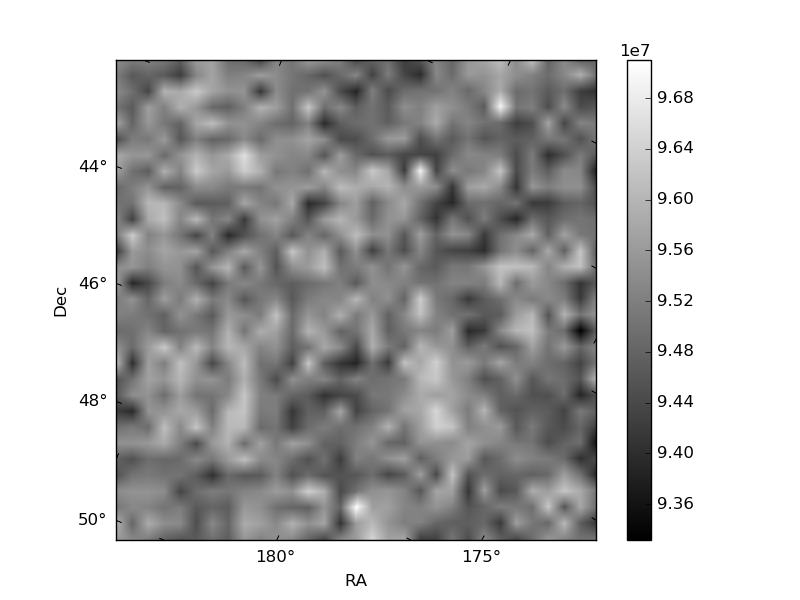
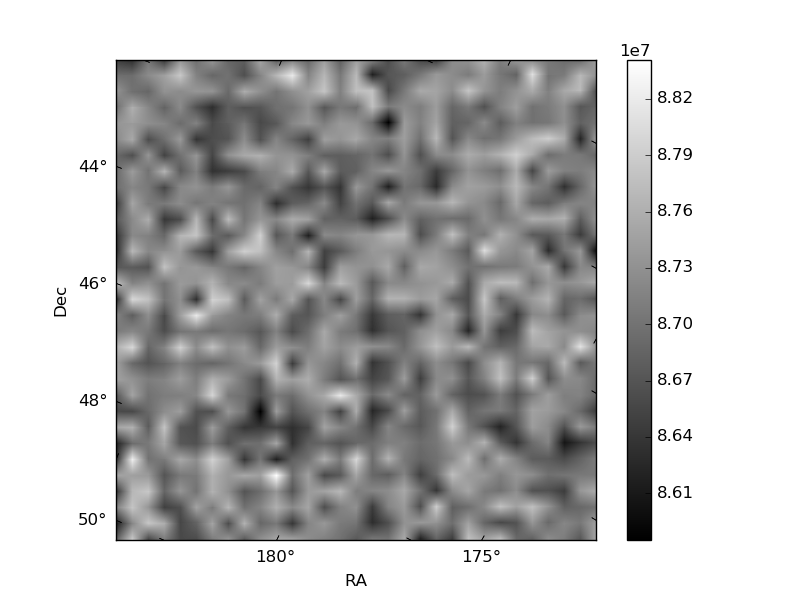
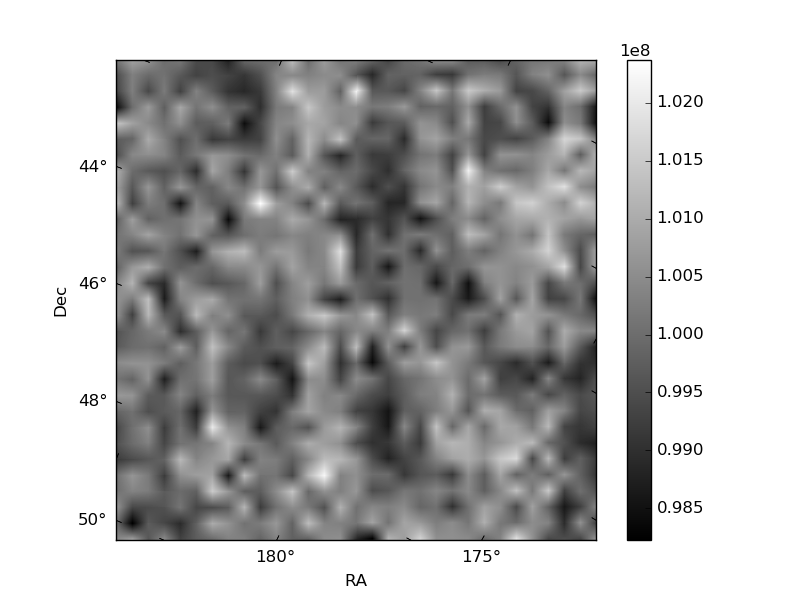
Histogram calculated using DETX and DETY for each event in the final _common_clean file
| Quadrant A | 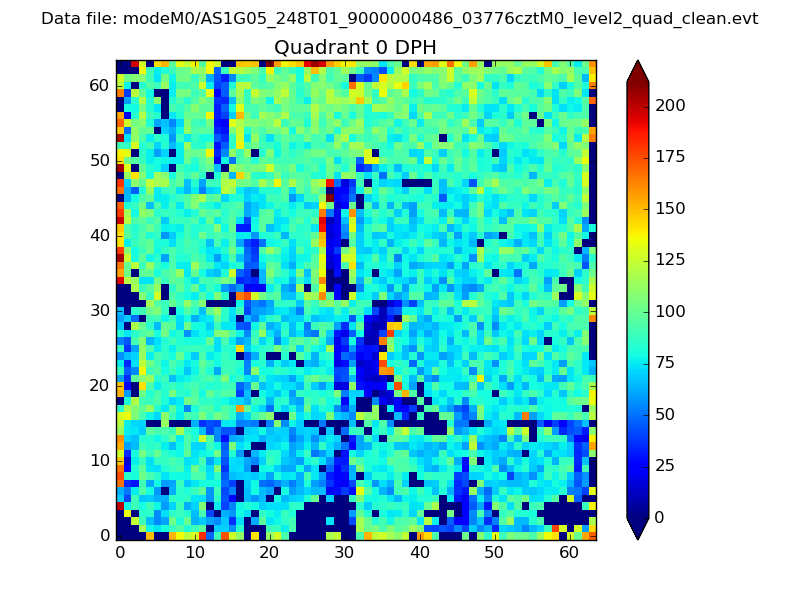 |
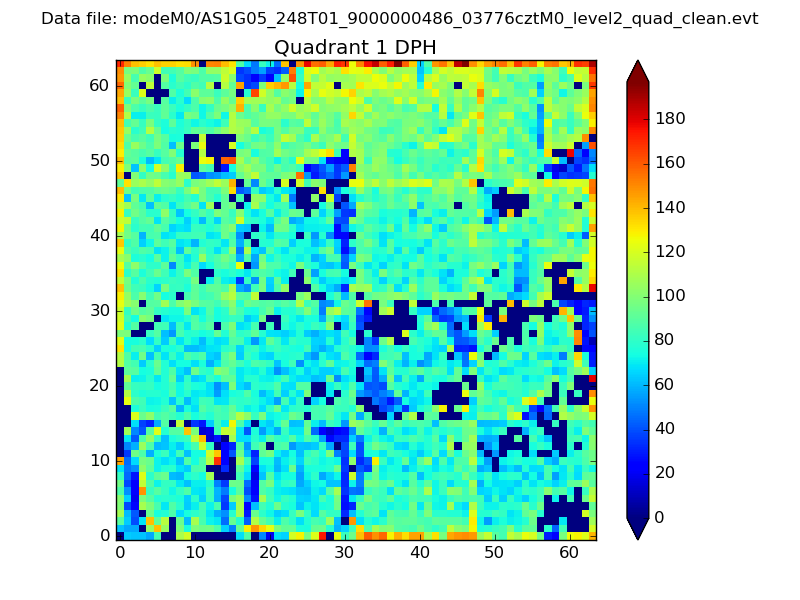 |
Quadrant B |
|---|---|---|---|
| Quadrant D | 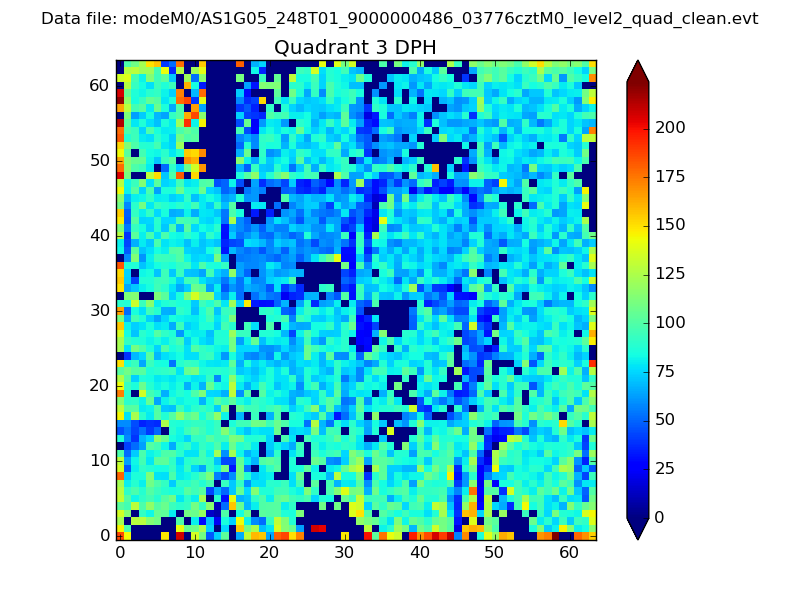 |
 |
Quadrant C |
| Plot type | Count rate plots | Images |
|---|---|---|
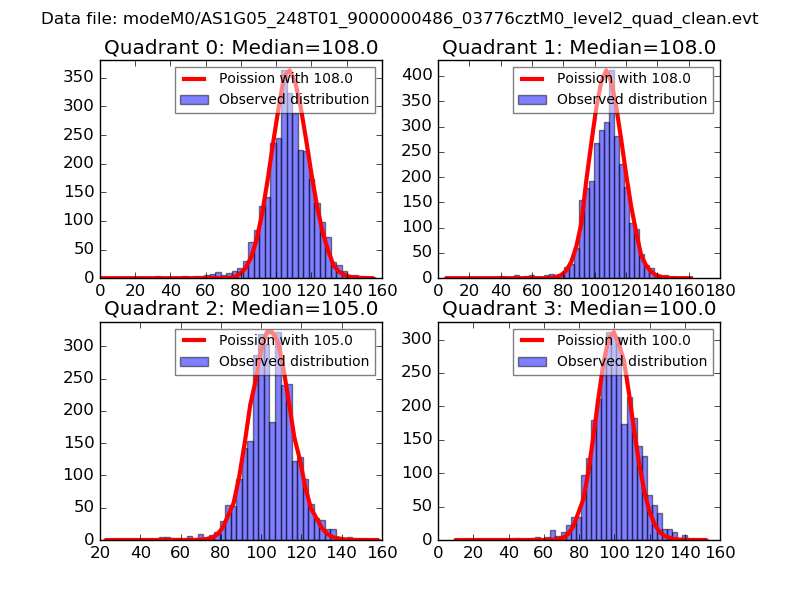
| Comparison with Poisson distribution Blue bars denote a histogram of data divided into 1 sec bins. Red curve is a Poisson curve with rate = median count rate of data. |
 |
 |
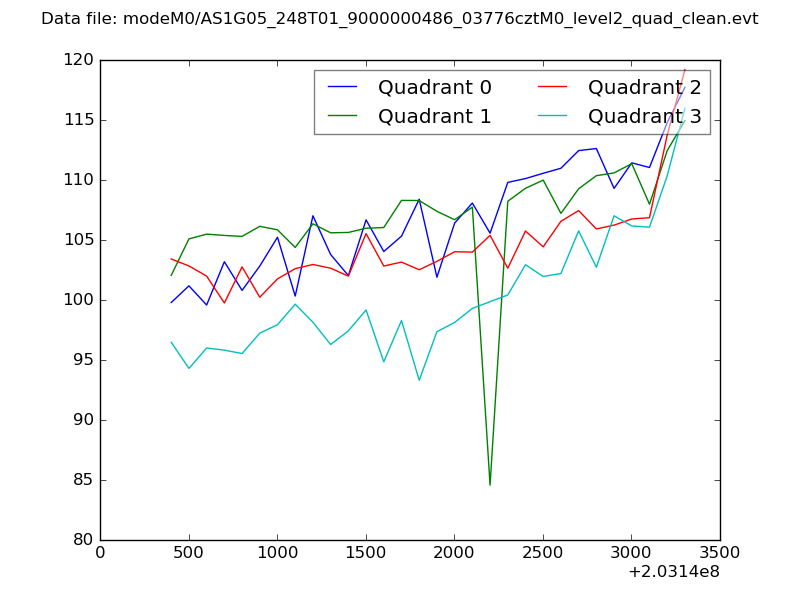
| Quadrant-wise count rates Data is divided into 100 sec bins |
 |
|
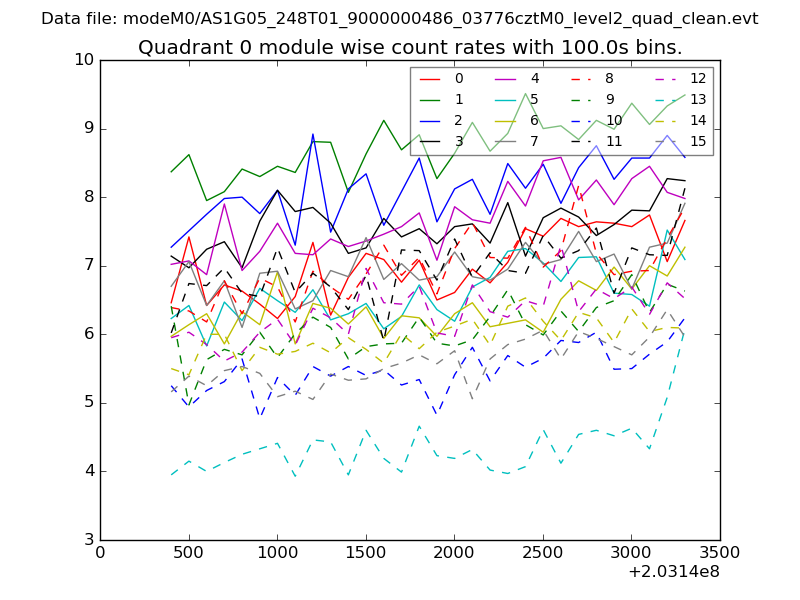
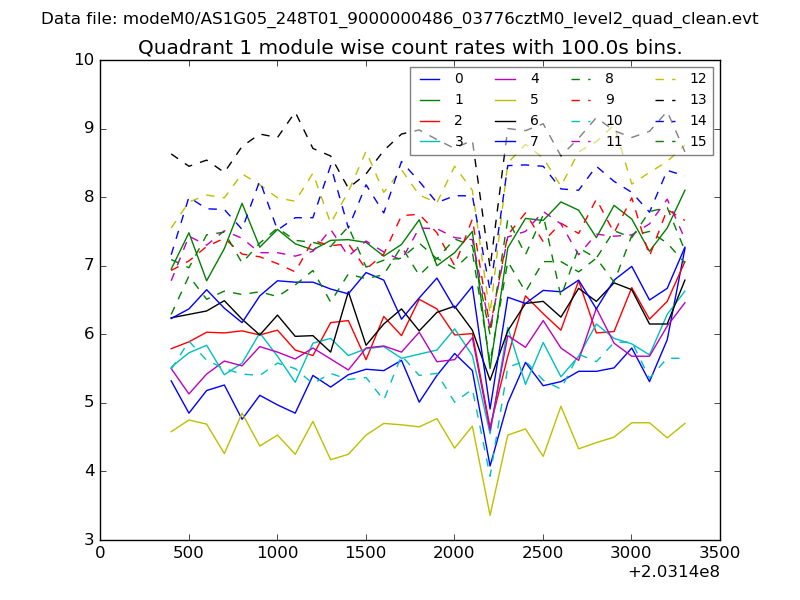
| Module-wise count rates for Quadrant A Data is divided into 100 sec bins |
 |
 |
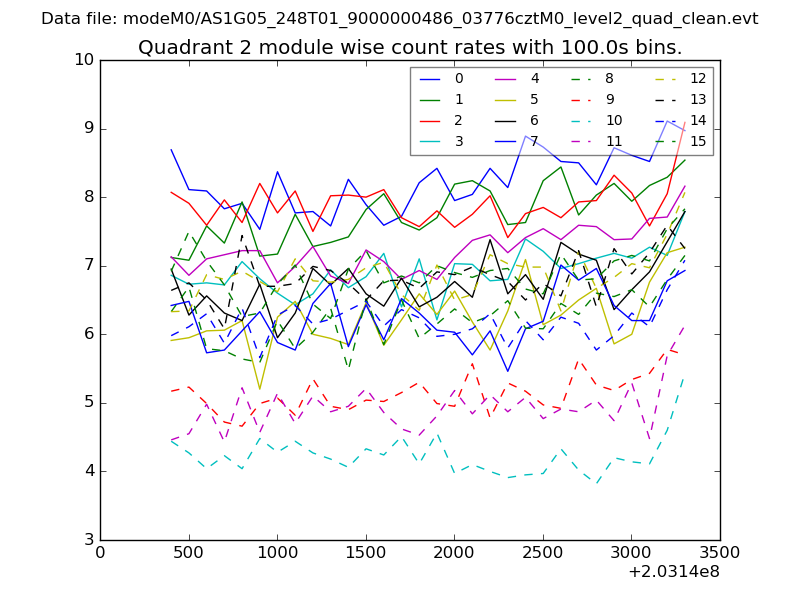
| Module-wise count rates for Quadrant B Data is divided into 100 sec bins |
 |
 |
| Module-wise count rates for Quadrant C Data is divided into 100 sec bins |
 |
 |
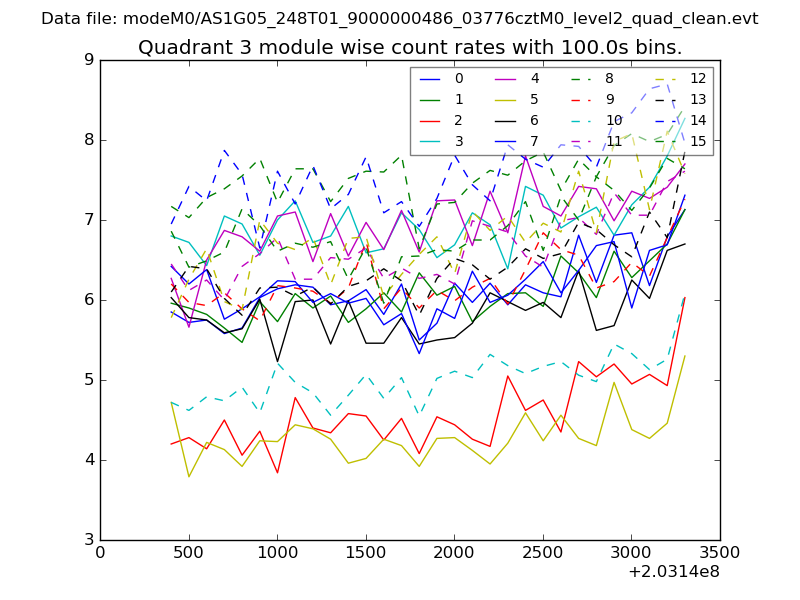
| Module-wise count rates for Quadrant D Data is divided into 100 sec bins |
 |
 |
| Parameter | Plot |
|---|---|
| CZT HV Monitor | 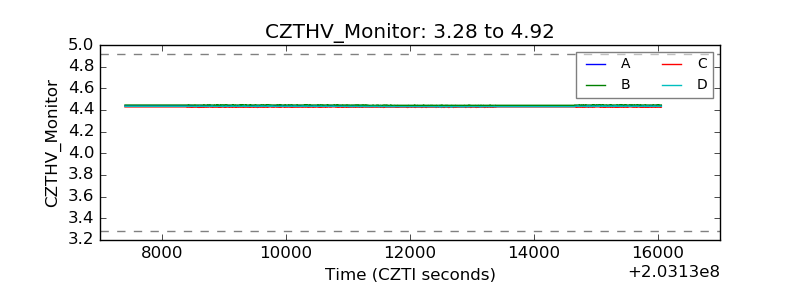 |
| D_VDD | 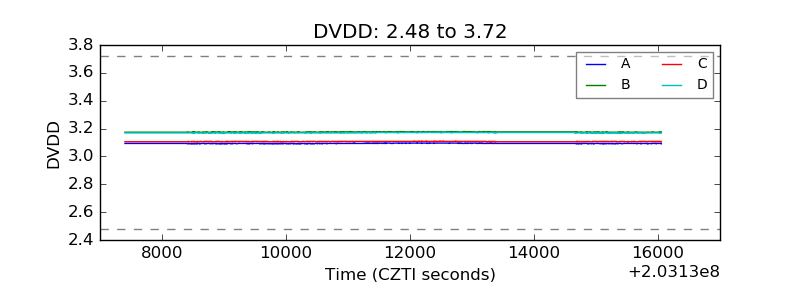 |
| Temperature 1 | 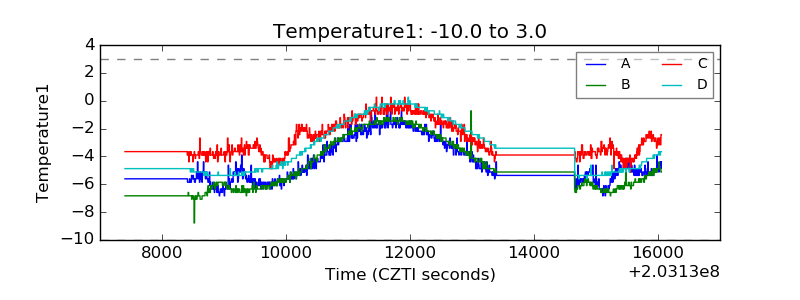 |
| Veto HV Monitor | 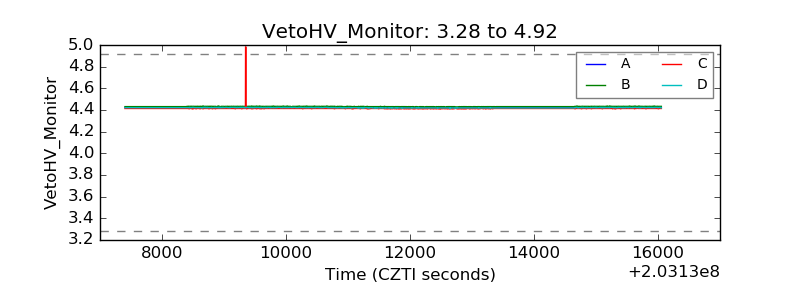 |
| Veto LLD | 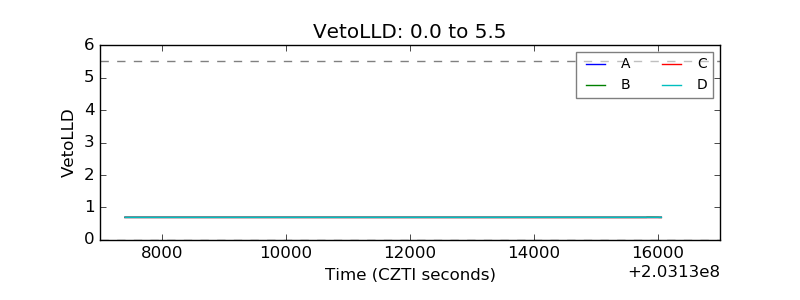 |
| Alpha Counter | 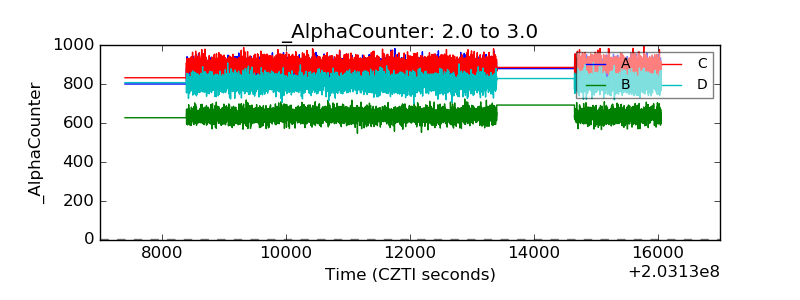 |
| _CPM_Rate | 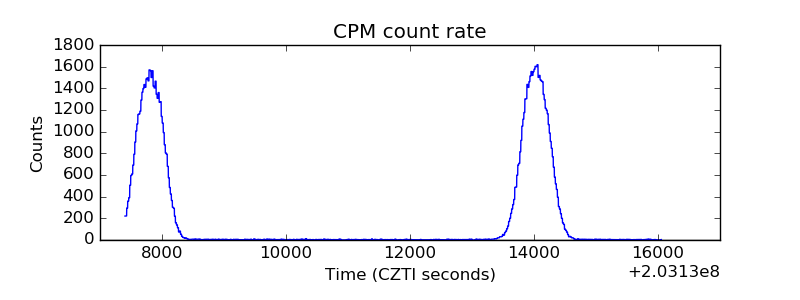 |
| CZT Counter | 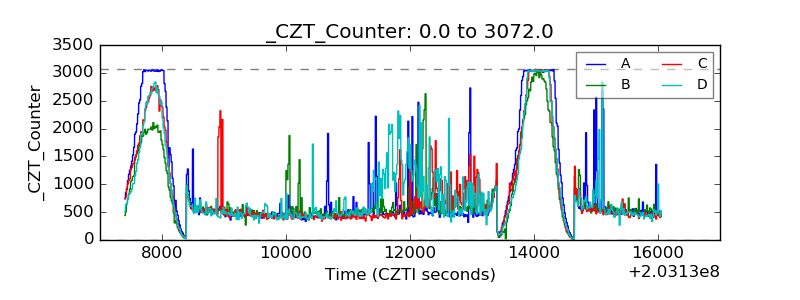 |
| +2.5 Volts monitor |  |
| +5 Volts monitor |  |
| Veto Counter | 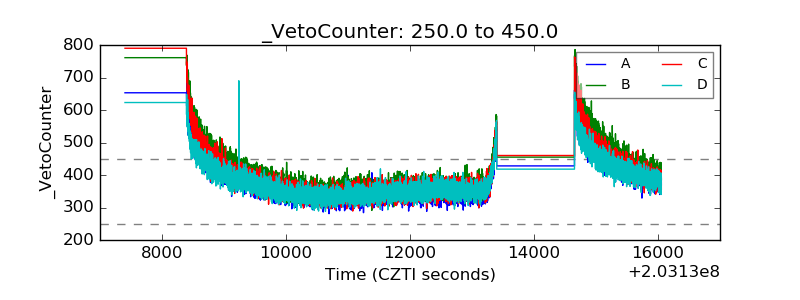 |