| Param | Original file | Final file |
|---|---|---|
| Filename | modeM0/AS1G05_248T01_9000000486_03777cztM0_level2.evt | modeM0/AS1G05_248T01_9000000486_03777cztM0_level2_quad_clean.evt |
| Size (bytes) | 537,215,040 | 64,313,280 |
| Size | 512.3 MB | 61.3 MB |
| Events in quadrant A | 3,838,936 | 386,681 |
| Events in quadrant B | 3,521,357 | 392,547 |
| Events in quadrant C | 3,054,585 | 382,720 |
| Events in quadrant D | 5,426,763 | 344,503 |
| Mode SS | |||
|---|---|---|---|
| Quadrant | BADHDUFLAG | Total packets | Discarded packets |
| A | 0 | 130 | 0 |
| B | 0 | 130 | 0 |
| C | 0 | 130 | 0 |
| D | 0 | 130 | 0 |
| Mode M9 | |||
|---|---|---|---|
| Quadrant | BADHDUFLAG | Total packets | Discarded packets |
| A | 0 | 17 | 0 |
| B | 0 | 17 | 0 |
| C | 0 | 17 | 0 |
| D | 0 | 18 | 0 |
| Mode M0 | |||
|---|---|---|---|
| Quadrant | BADHDUFLAG | Total packets | Discarded packets |
| A | 0 | 15332 | 3 |
| B | 0 | 14205 | 2 |
| C | 0 | 13171 | 2 |
| D | 0 | 20311 | 2 |
| Quadrant | Total seconds | Saturated seconds | Saturation percentage |
|---|---|---|---|
| A | 6307 | 232 | 3.678453% |
| B | 6307 | 124 | 1.966069% |
| C | 6307 | 71 | 1.125733% |
| D | 6307 | 620 | 9.830347% |
Noise dominated data is calculated using 1-second bins in cleaned event files. If a bin has >2000 counts, and if more than 50% of those come from <1% of pixels, then it is considered to be noise-dominated and hence unusable.
| Quadrant | # 1 sec bins | Bins with >0 counts | Bins with >2000 counts | High rate bins dominated by noise | Noise dominated (total time) | Noise dominated (detector-on time) | Marked lightcurve |
|---|---|---|---|---|---|---|---|
| A | 7567 | 6307 | 108 | 108 | 1.43% | 1.71% | 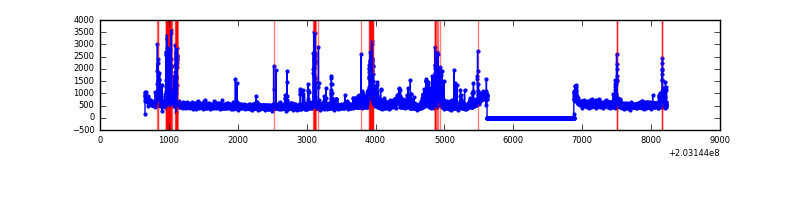 |
| B | 7567 | 6307 | 7 | 7 | 0.09% | 0.11% | 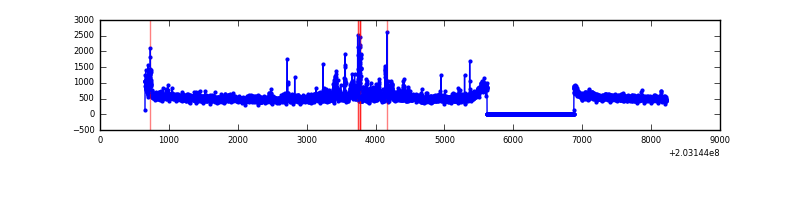 |
| C | 7567 | 6307 | 2 | 2 | 0.03% | 0.03% | 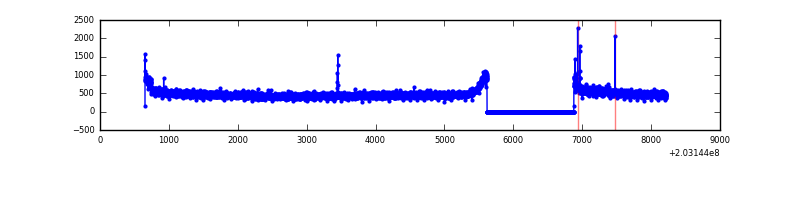 |
| D | 7567 | 6307 | 592 | 592 | 7.82% | 9.39% | 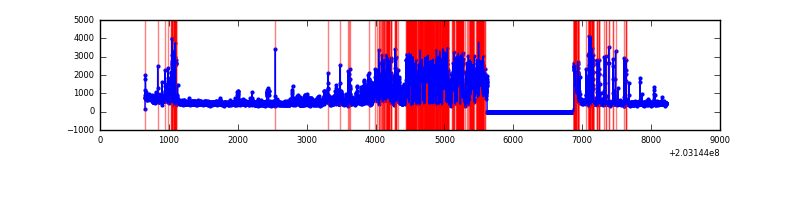 |
Top three noisy pixels from each quadrant. If the there are fewer than three noisy pixels in the level2.evt file, extra rows are filled as -1
| Pixel properties | Quadrant properties | ||||||
|---|---|---|---|---|---|---|---|
| Quadrant | DetID | PixID | Counts | Sigma | Mean | Median | Sigma |
| A | 0 | 118 | 351457 | 2160.39 | 795 | 779 | 162.3 |
| A | 0 | 50 | 207728 | 1274.93 | 795 | 779 | 162.3 |
| A | 13 | 251 | 145140 | 889.35 | 795 | 779 | 162.3 |
| B | 15 | 204 | 185749 | 1198.14 | 810 | 792 | 154.4 |
| B | 4 | 81 | 92497 | 594.06 | 810 | 792 | 154.4 |
| B | 15 | 54 | 24204 | 151.66 | 810 | 792 | 154.4 |
| C | 2 | 53 | 57192 | 317.42 | 765 | 770 | 177.8 |
| C | 13 | 61 | 6310 | 31.17 | 765 | 770 | 177.8 |
| C | 14 | 159 | 4063 | 18.53 | 765 | 770 | 177.8 |
| D | 1 | 84 | 1531256 | 8671.99 | 735 | 714 | 176.5 |
| D | 8 | 112 | 593319 | 3357.68 | 735 | 714 | 176.5 |
| D | 13 | 137 | 241310 | 1363.21 | 735 | 714 | 176.5 |
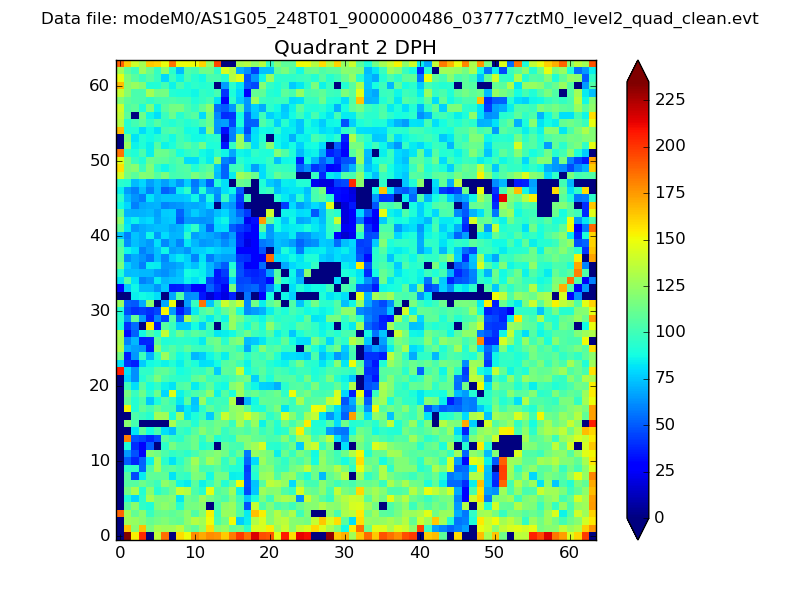
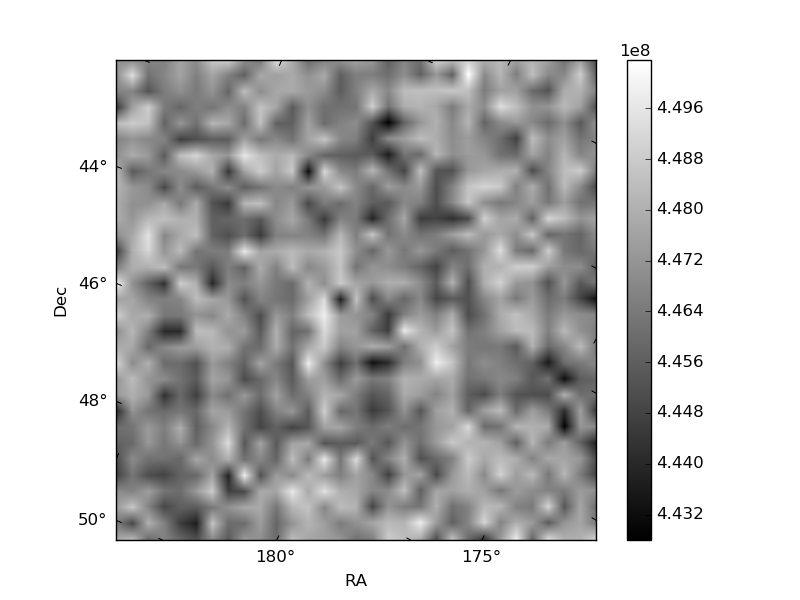
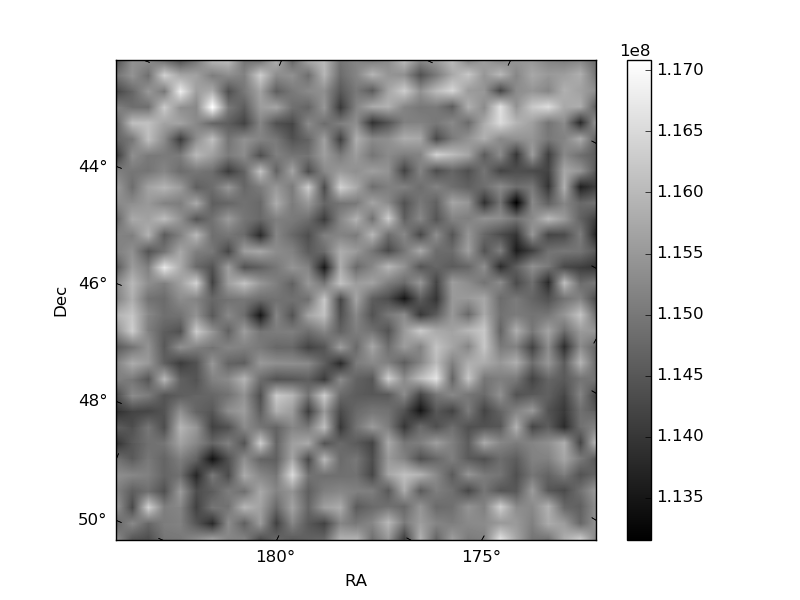
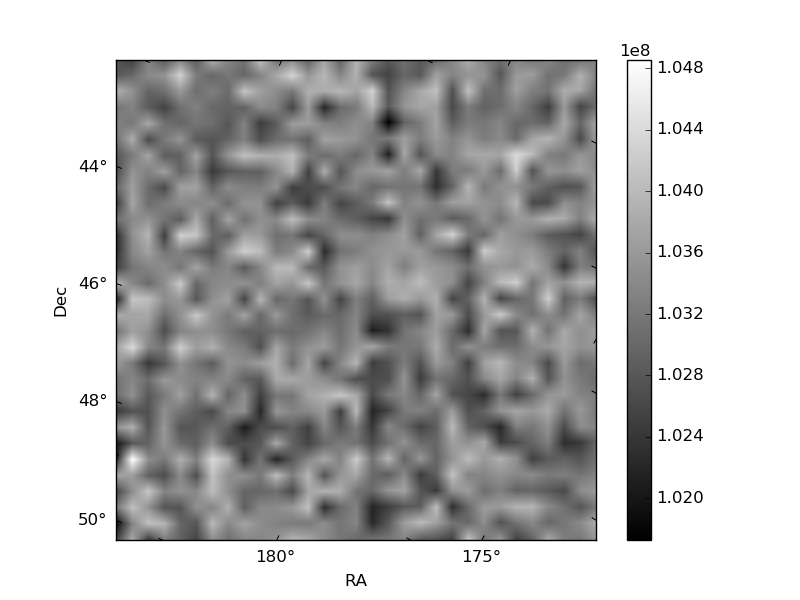
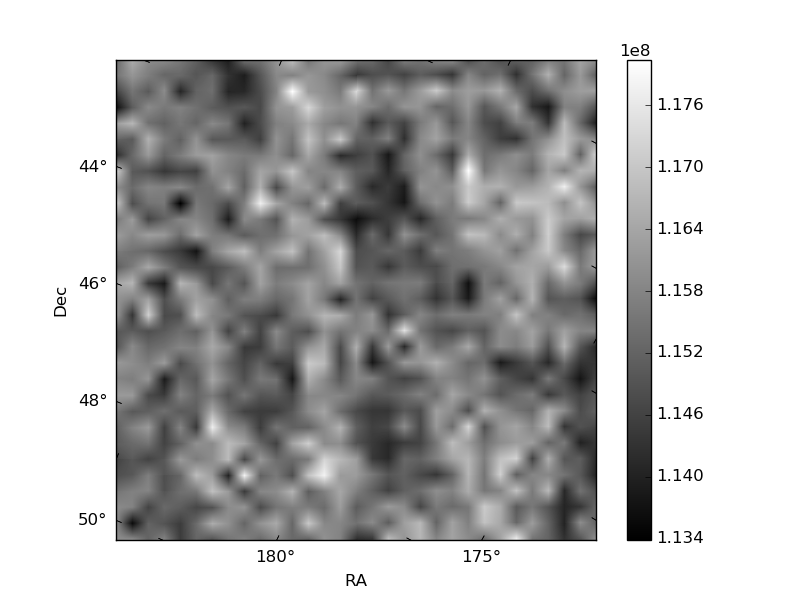
Histogram calculated using DETX and DETY for each event in the final _common_clean file
| Quadrant A | 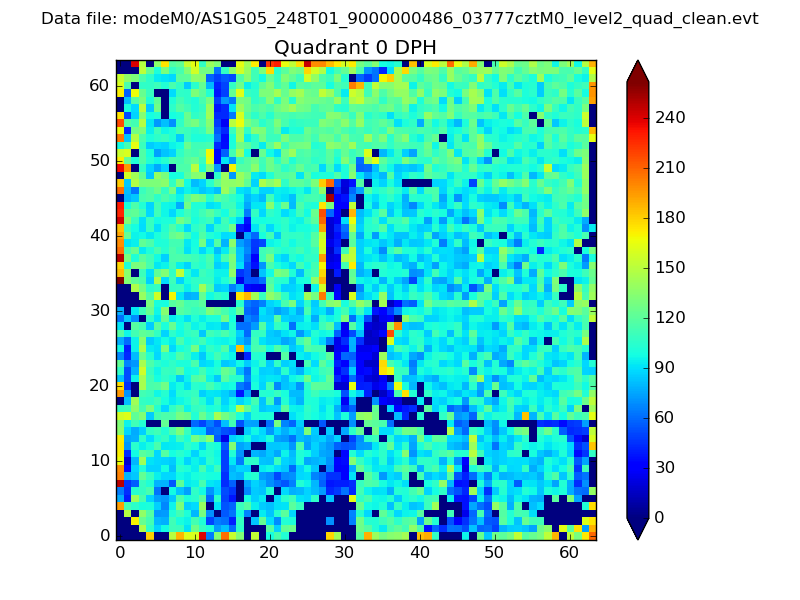 |
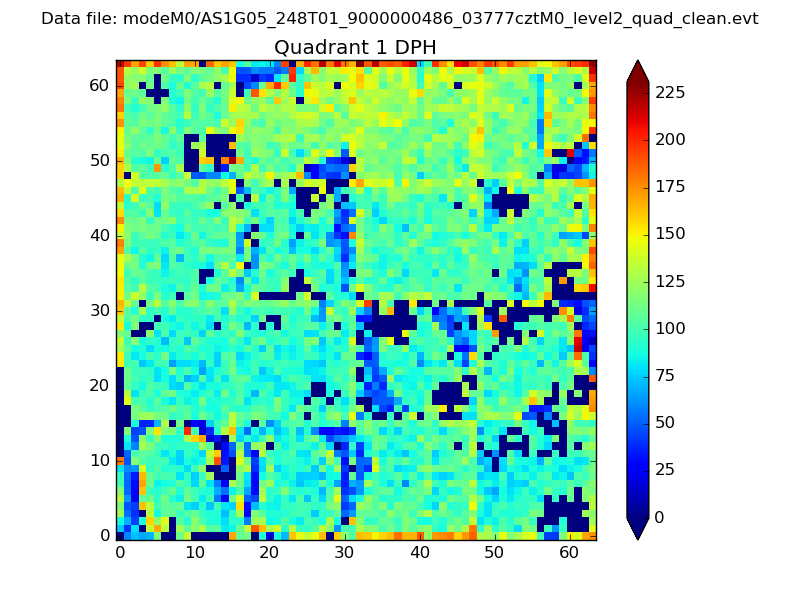 |
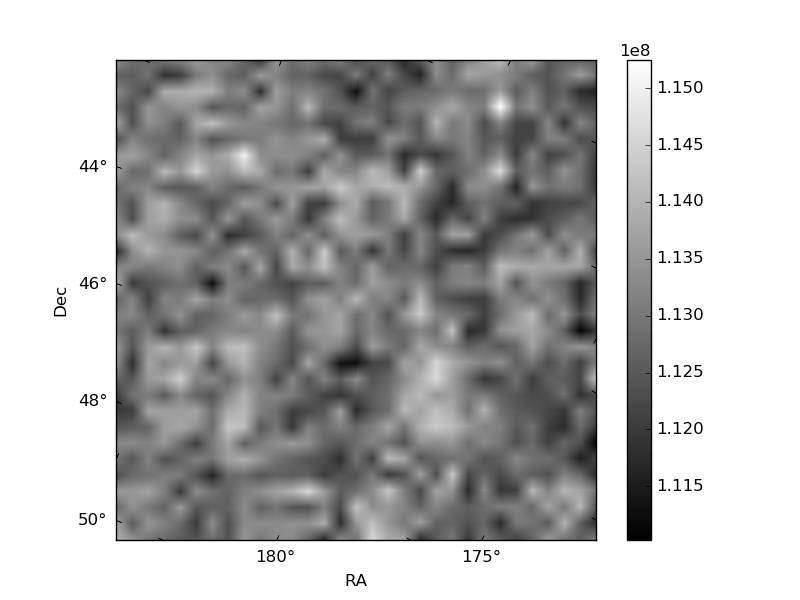
Quadrant B |
|---|---|---|---|
| Quadrant D | 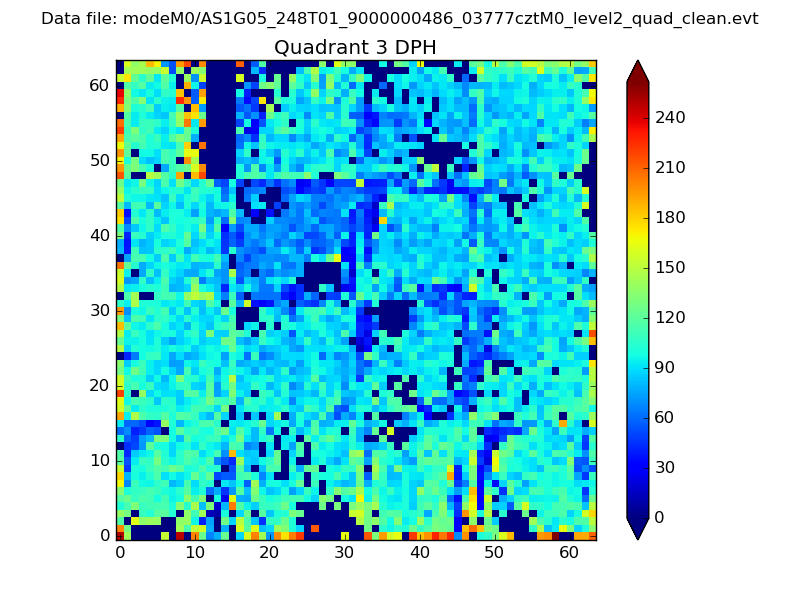 |
 |
Quadrant C |
| Plot type | Count rate plots | Images |
|---|---|---|
| Comparison with Poisson distribution Blue bars denote a histogram of data divided into 1 sec bins. Red curve is a Poisson curve with rate = median count rate of data. |
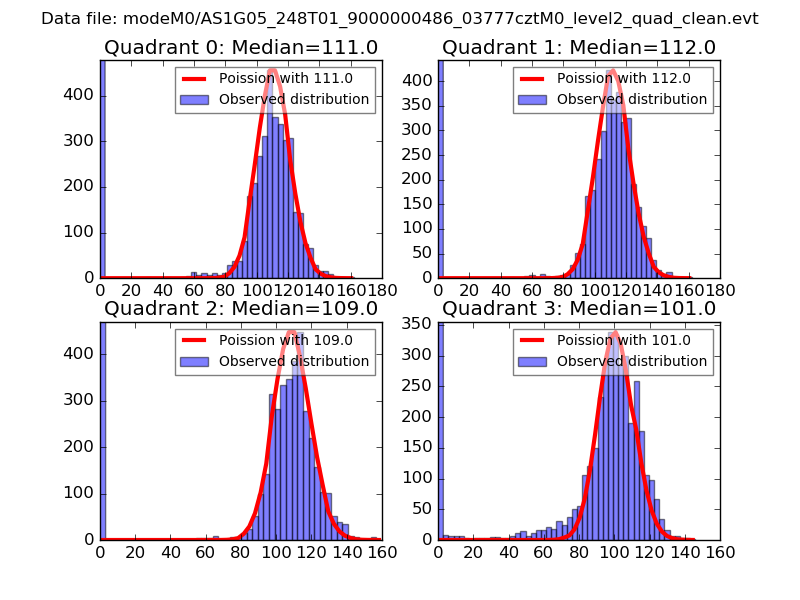 |
 |
| Quadrant-wise count rates Data is divided into 100 sec bins |
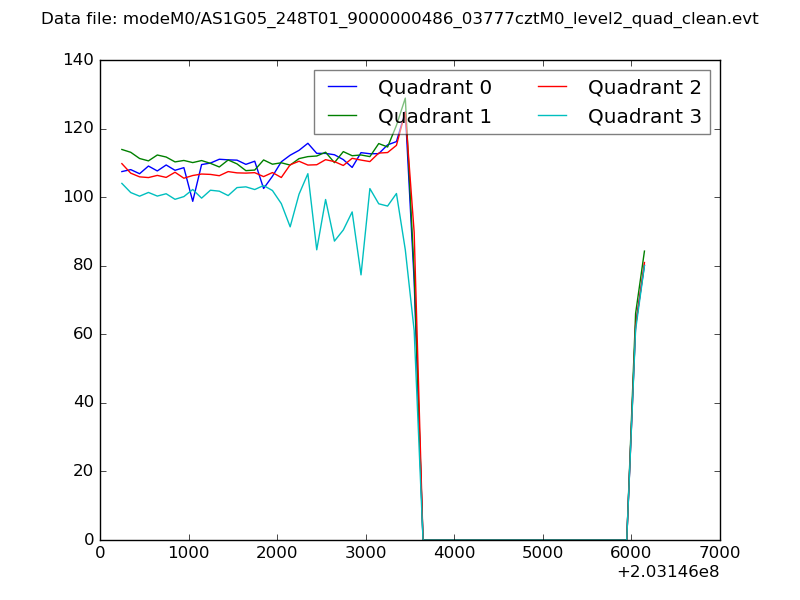 |
|
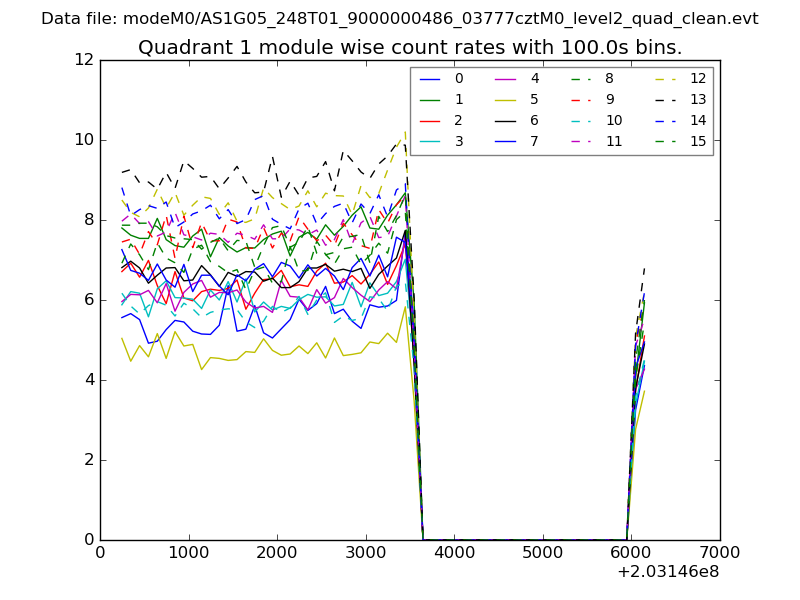
| Module-wise count rates for Quadrant A Data is divided into 100 sec bins |
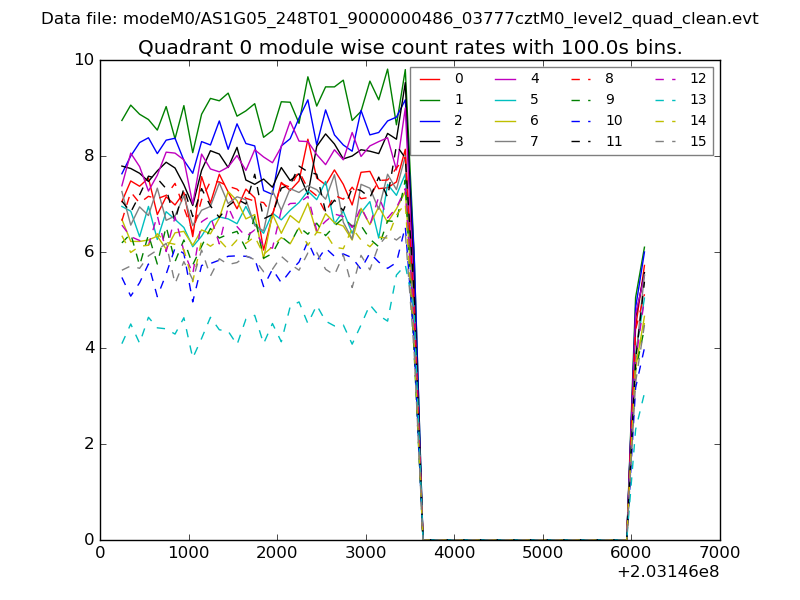 |
 |
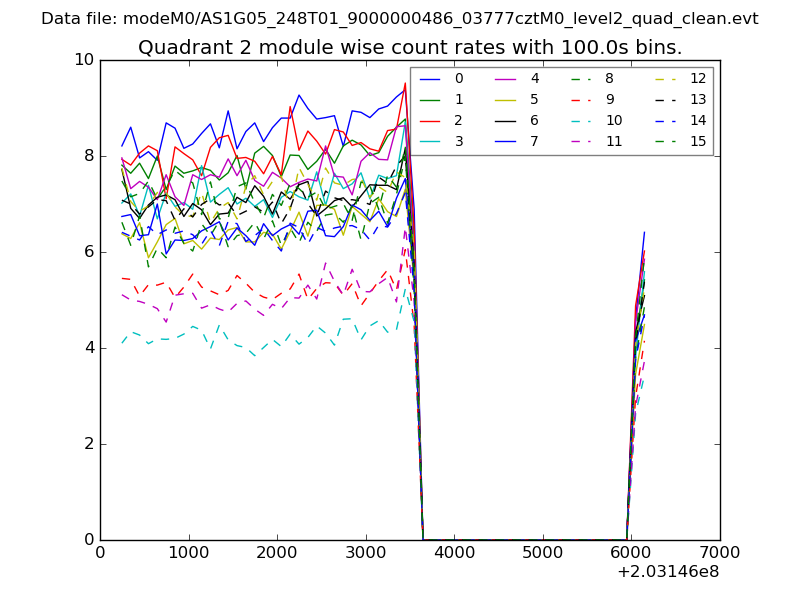
| Module-wise count rates for Quadrant B Data is divided into 100 sec bins |
 |
 |
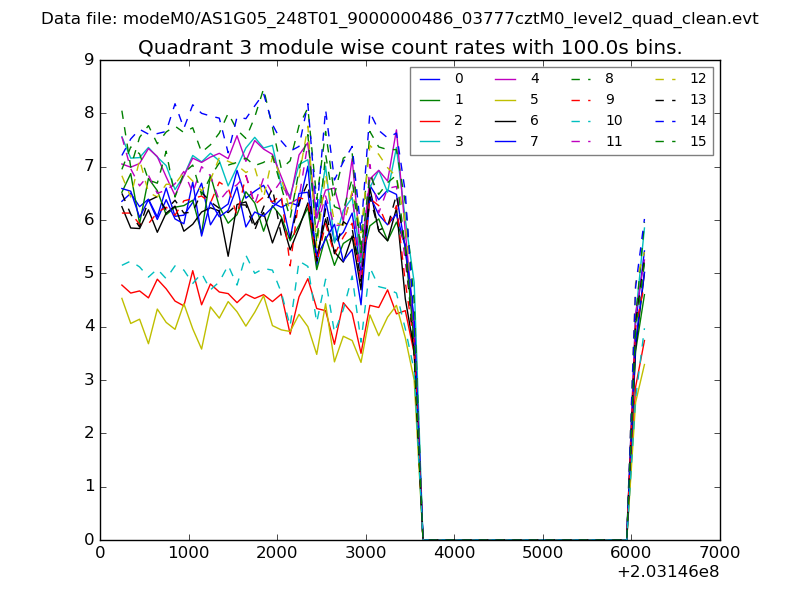
| Module-wise count rates for Quadrant C Data is divided into 100 sec bins |
 |
 |
| Module-wise count rates for Quadrant D Data is divided into 100 sec bins |
 |
 |
| Parameter | Plot |
|---|---|
| CZT HV Monitor | 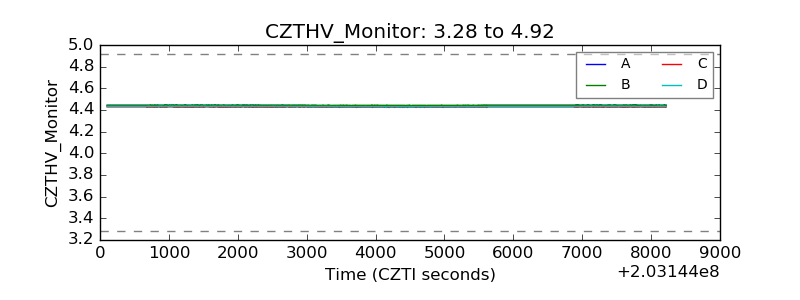 |
| D_VDD | 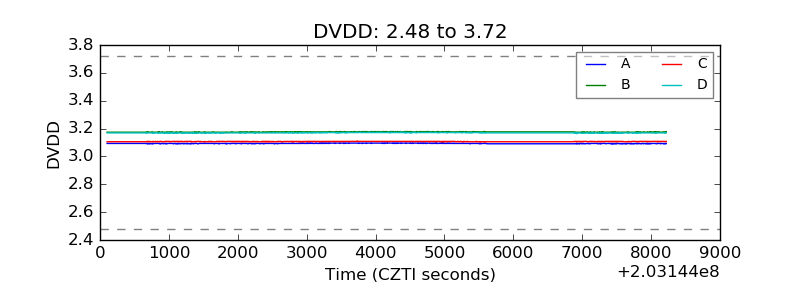 |
| Temperature 1 | 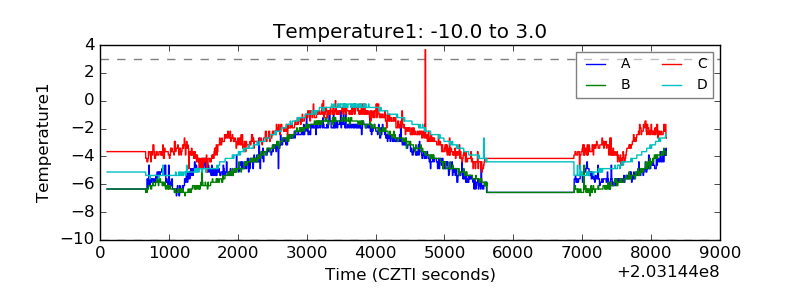 |
| Veto HV Monitor | 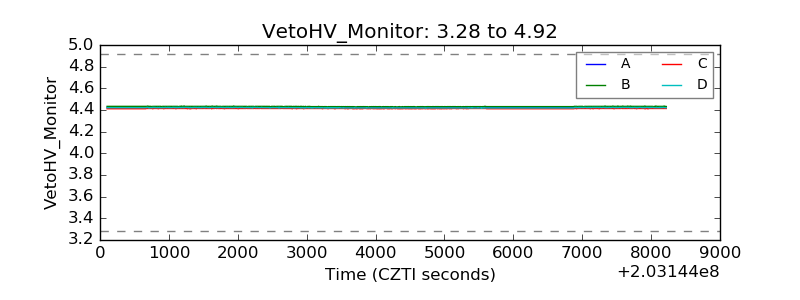 |
| Veto LLD | 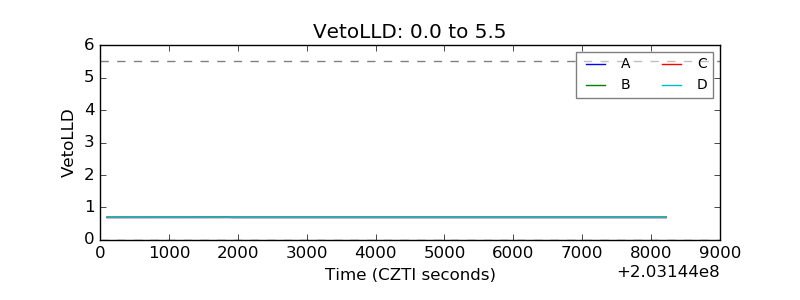 |
| Alpha Counter | 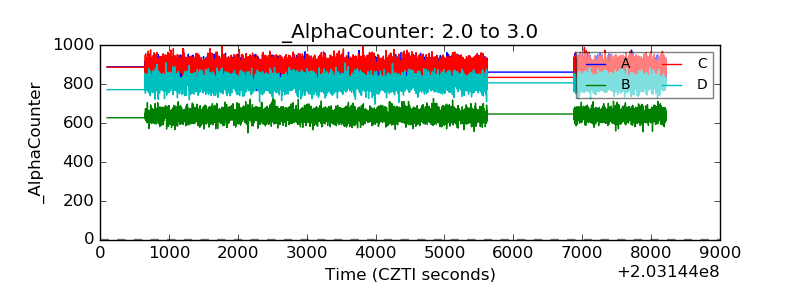 |
| _CPM_Rate | 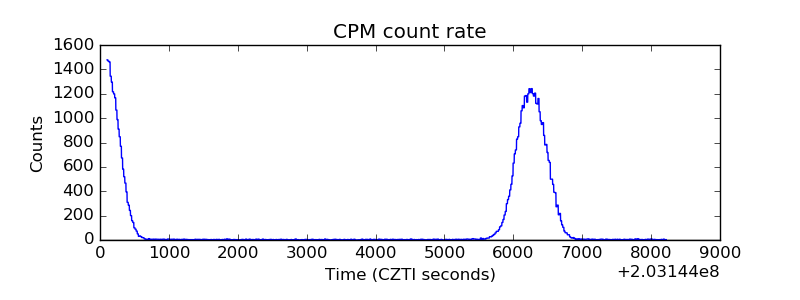 |
| CZT Counter | 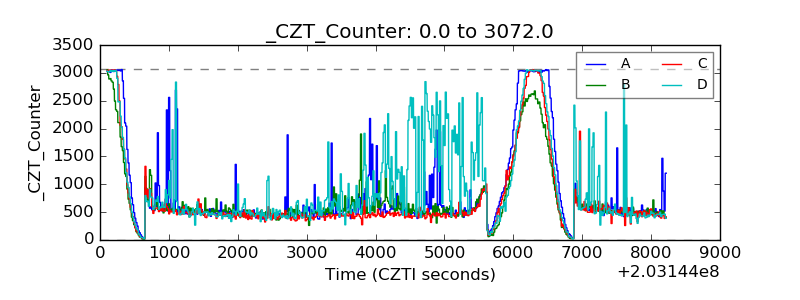 |
| +2.5 Volts monitor |  |
| +5 Volts monitor |  |
| Veto Counter | 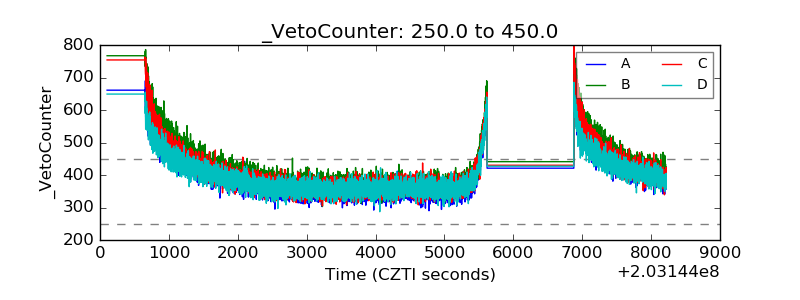 |