| Param | Original file | Final file |
|---|---|---|
| Filename | modeM0/AS1G05_248T01_9000000486_03778cztM0_level2.evt | modeM0/AS1G05_248T01_9000000486_03778cztM0_level2_quad_clean.evt |
| Size (bytes) | 565,580,160 | 78,223,680 |
| Size | 539.4 MB | 74.6 MB |
| Events in quadrant A | 4,172,569 | 484,843 |
| Events in quadrant B | 4,669,697 | 486,348 |
| Events in quadrant C | 3,138,099 | 484,670 |
| Events in quadrant D | 4,712,136 | 463,428 |
| Mode SS | |||
|---|---|---|---|
| Quadrant | BADHDUFLAG | Total packets | Discarded packets |
| A | 0 | 130 | 0 |
| B | 0 | 130 | 0 |
| C | 0 | 130 | 0 |
| D | 0 | 130 | 0 |
| Mode M9 | |||
|---|---|---|---|
| Quadrant | BADHDUFLAG | Total packets | Discarded packets |
| A | 0 | 14 | 0 |
| B | 0 | 14 | 0 |
| C | 0 | 14 | 0 |
| D | 0 | 15 | 0 |
| Mode M0 | |||
|---|---|---|---|
| Quadrant | BADHDUFLAG | Total packets | Discarded packets |
| A | 0 | 16431 | 3 |
| B | 0 | 17976 | 2 |
| C | 0 | 13491 | 2 |
| D | 0 | 18322 | 2 |
| Quadrant | Total seconds | Saturated seconds | Saturation percentage |
|---|---|---|---|
| A | 6441 | 344 | 5.340786% |
| B | 6441 | 344 | 5.340786% |
| C | 6441 | 89 | 1.381773% |
| D | 6441 | 258 | 4.005589% |
Noise dominated data is calculated using 1-second bins in cleaned event files. If a bin has >2000 counts, and if more than 50% of those come from <1% of pixels, then it is considered to be noise-dominated and hence unusable.
| Quadrant | # 1 sec bins | Bins with >0 counts | Bins with >2000 counts | High rate bins dominated by noise | Noise dominated (total time) | Noise dominated (detector-on time) | Marked lightcurve |
|---|---|---|---|---|---|---|---|
| A | 7671 | 6441 | 189 | 189 | 2.46% | 2.93% | 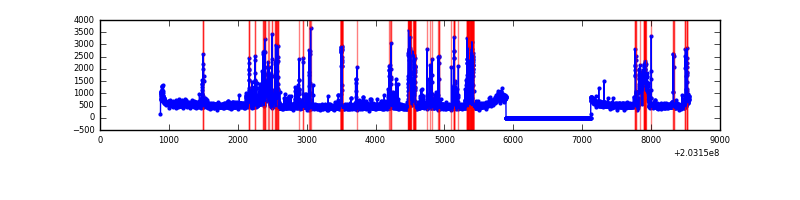 |
| B | 7671 | 6441 | 139 | 139 | 1.81% | 2.16% | 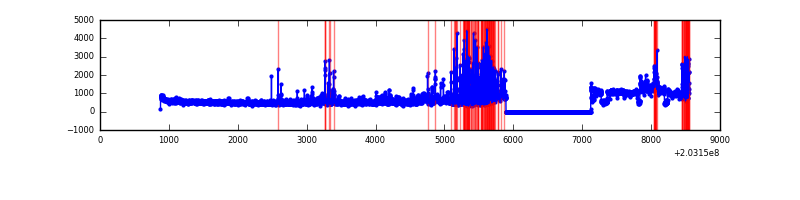 |
| C | 7671 | 6441 | 4 | 4 | 0.05% | 0.06% | 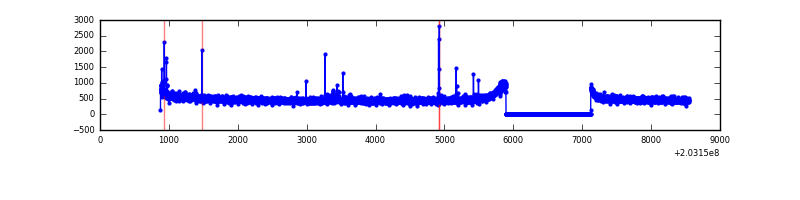 |
| D | 7671 | 6441 | 161 | 161 | 2.10% | 2.50% | 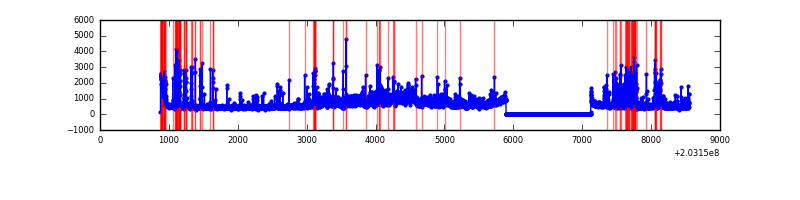 |
Top three noisy pixels from each quadrant. If the there are fewer than three noisy pixels in the level2.evt file, extra rows are filled as -1
| Pixel properties | Quadrant properties | ||||||
|---|---|---|---|---|---|---|---|
| Quadrant | DetID | PixID | Counts | Sigma | Mean | Median | Sigma |
| A | 13 | 251 | 458220 | 2817.5 | 803 | 786 | 162.4 |
| A | 0 | 118 | 235343 | 1444.72 | 803 | 786 | 162.4 |
| A | 13 | 164 | 166414 | 1020.16 | 803 | 786 | 162.4 |
| B | 0 | 173 | 1246889 | 8009.94 | 808 | 790 | 155.6 |
| B | 15 | 204 | 133652 | 854.04 | 808 | 790 | 155.6 |
| B | 0 | 244 | 52190 | 330.4 | 808 | 790 | 155.6 |
| C | 2 | 53 | 76821 | 421.92 | 778 | 783 | 180.2 |
| C | 1 | 16 | 14119 | 74.0 | 778 | 783 | 180.2 |
| C | 13 | 61 | 6667 | 32.65 | 778 | 783 | 180.2 |
| D | 1 | 84 | 980364 | 5346.68 | 770 | 746 | 183.2 |
| D | 8 | 112 | 588706 | 3209.04 | 770 | 746 | 183.2 |
| D | 13 | 137 | 81579 | 441.18 | 770 | 746 | 183.2 |
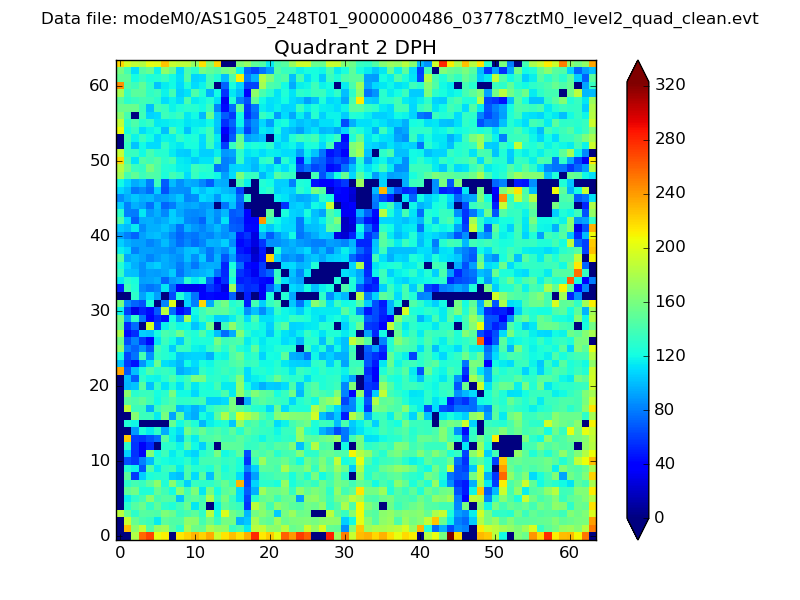
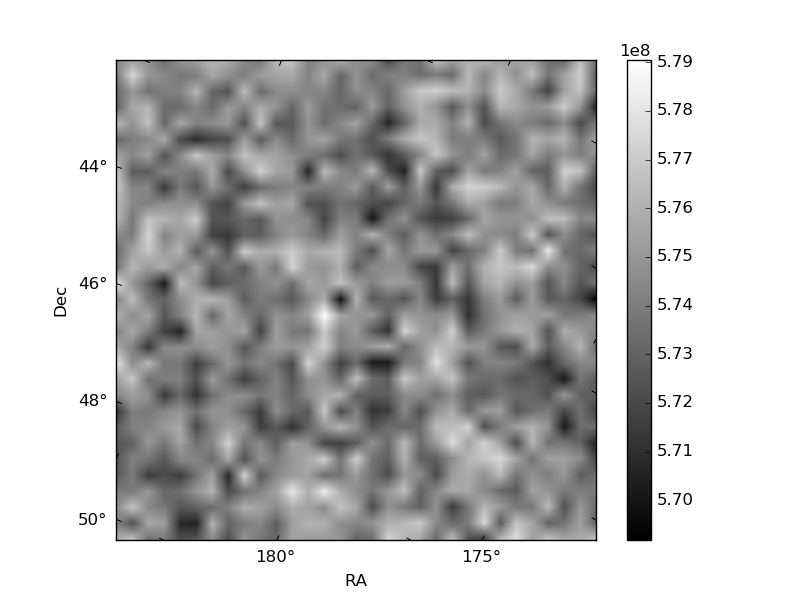
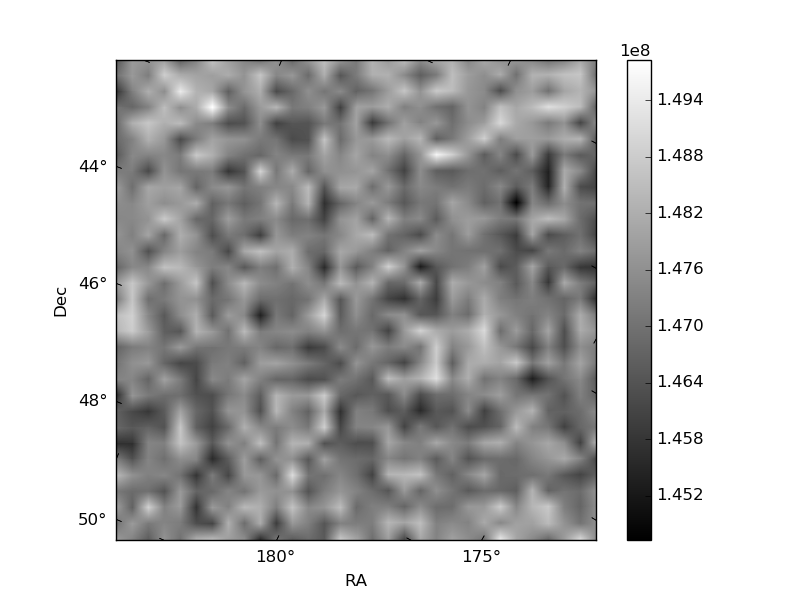
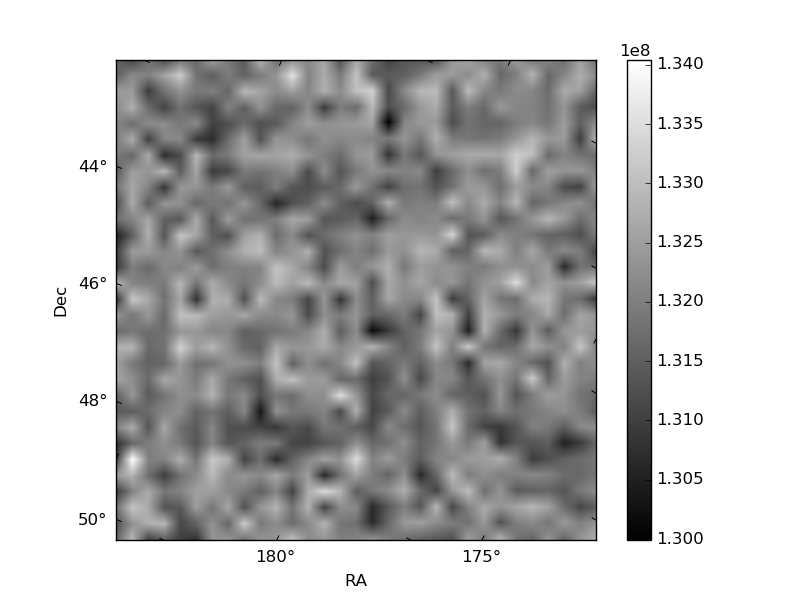
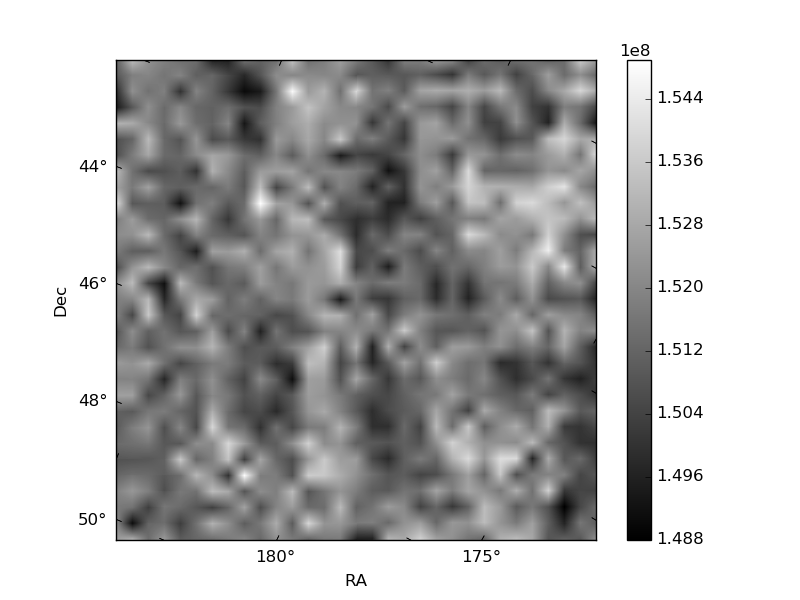
Histogram calculated using DETX and DETY for each event in the final _common_clean file
| Quadrant A | 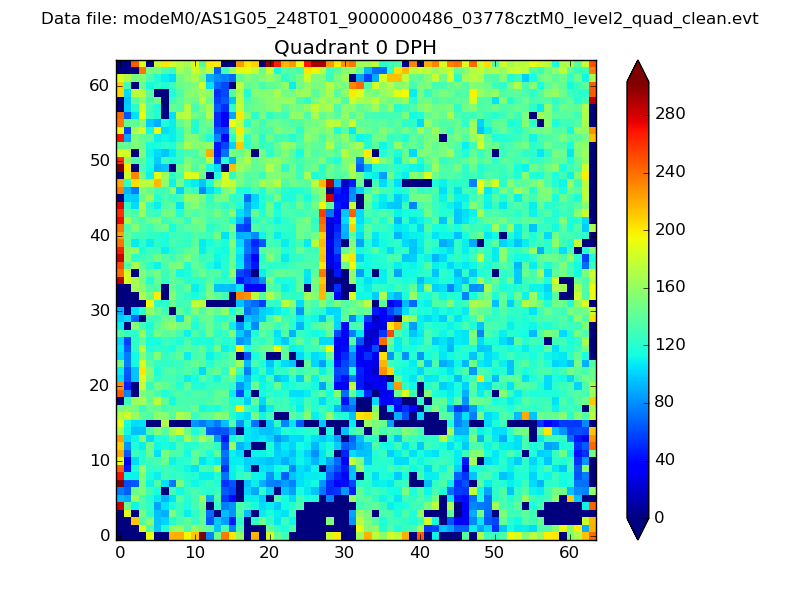 |
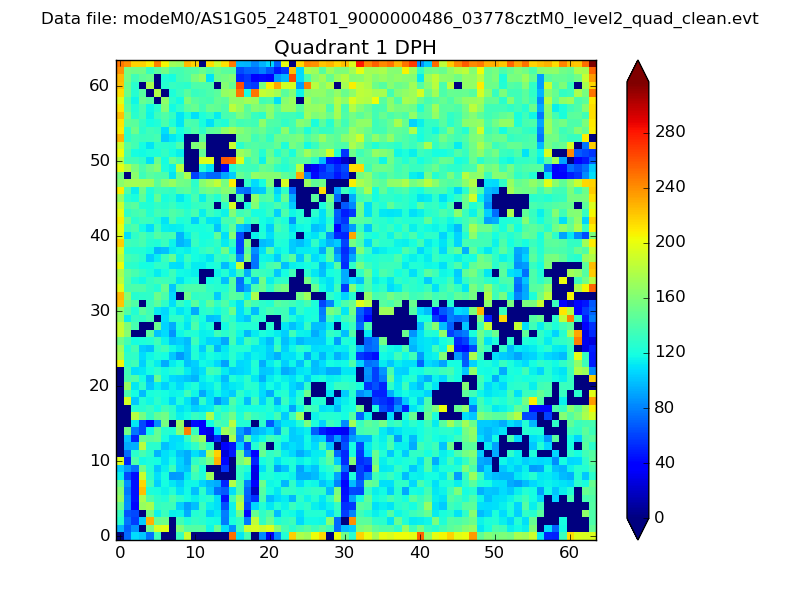 |
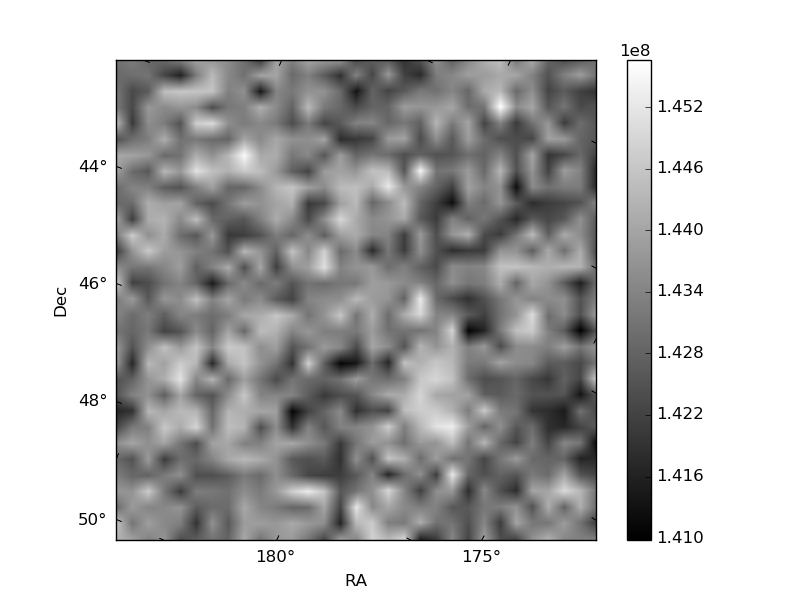
Quadrant B |
|---|---|---|---|
| Quadrant D | 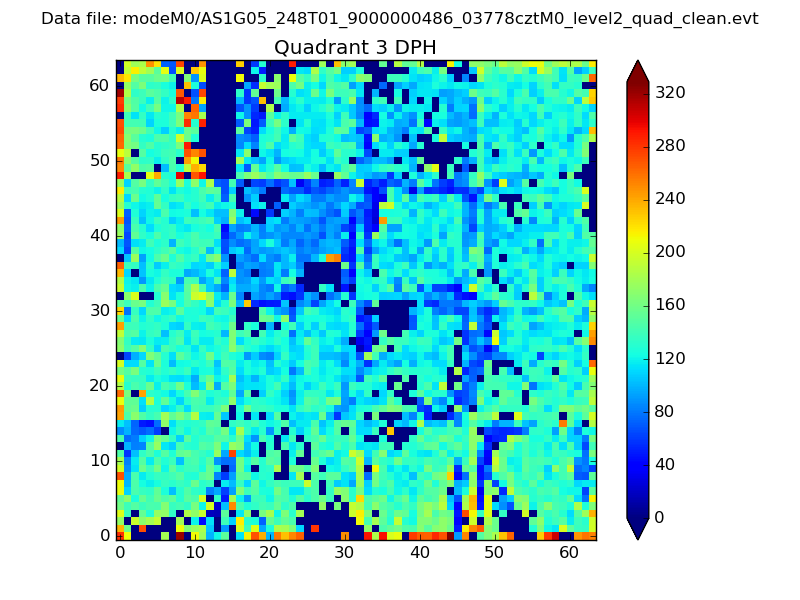 |
 |
Quadrant C |
| Plot type | Count rate plots | Images |
|---|---|---|
| Comparison with Poisson distribution Blue bars denote a histogram of data divided into 1 sec bins. Red curve is a Poisson curve with rate = median count rate of data. |
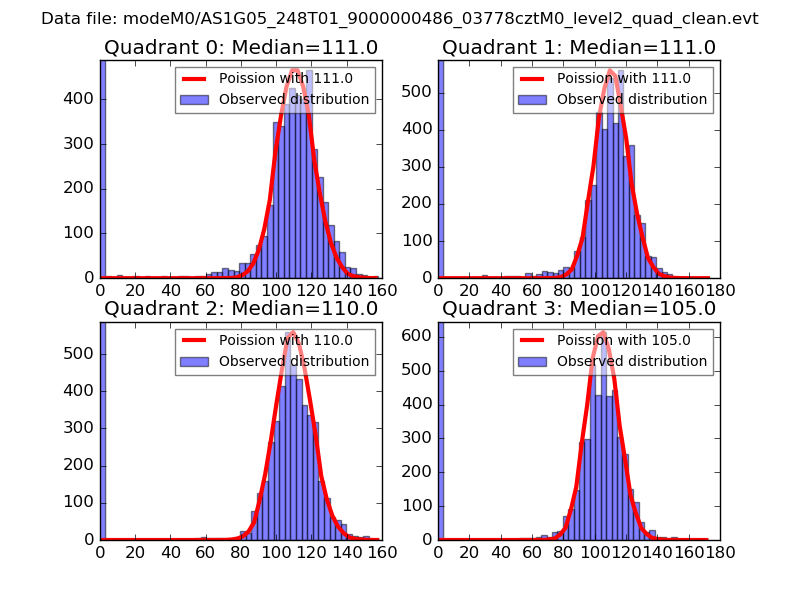 |
 |
| Quadrant-wise count rates Data is divided into 100 sec bins |
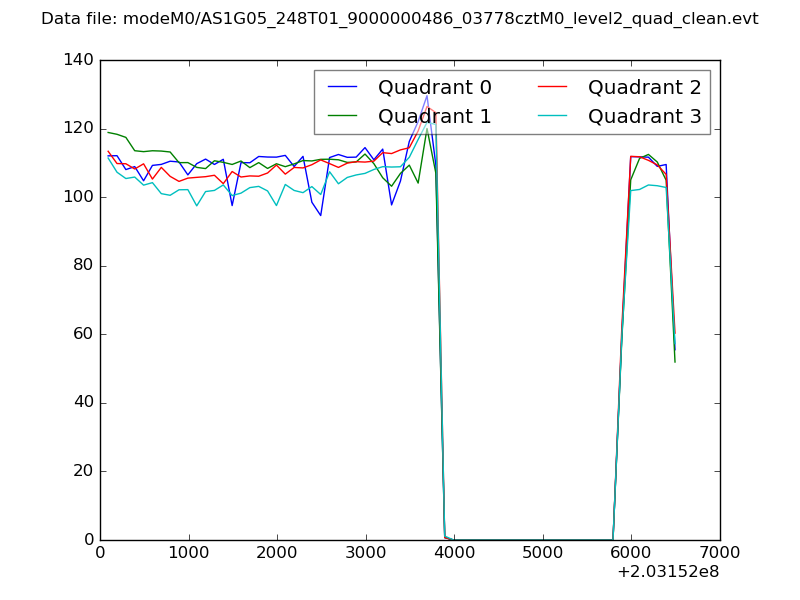 |
|
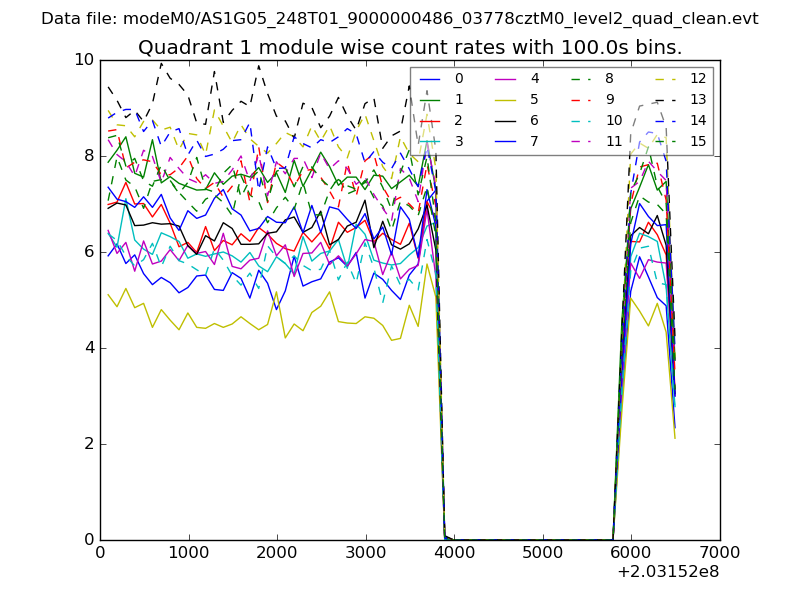
| Module-wise count rates for Quadrant A Data is divided into 100 sec bins |
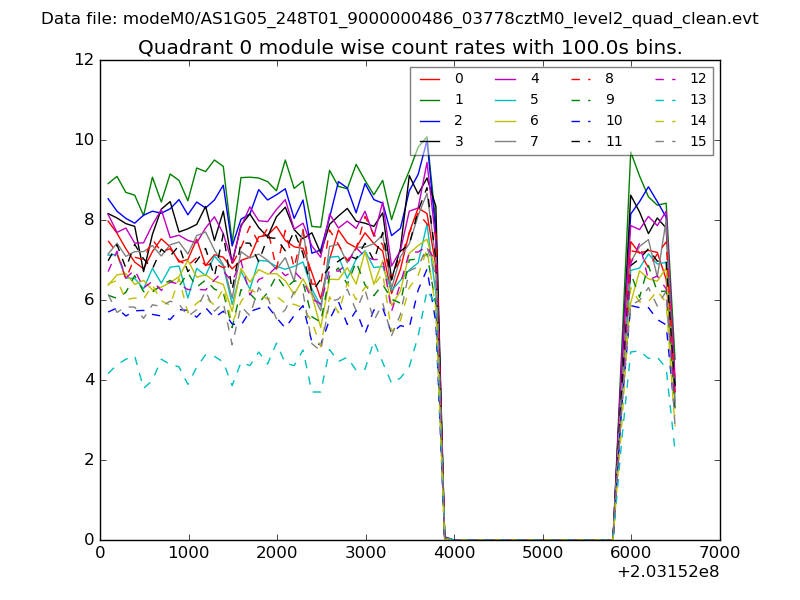 |
 |
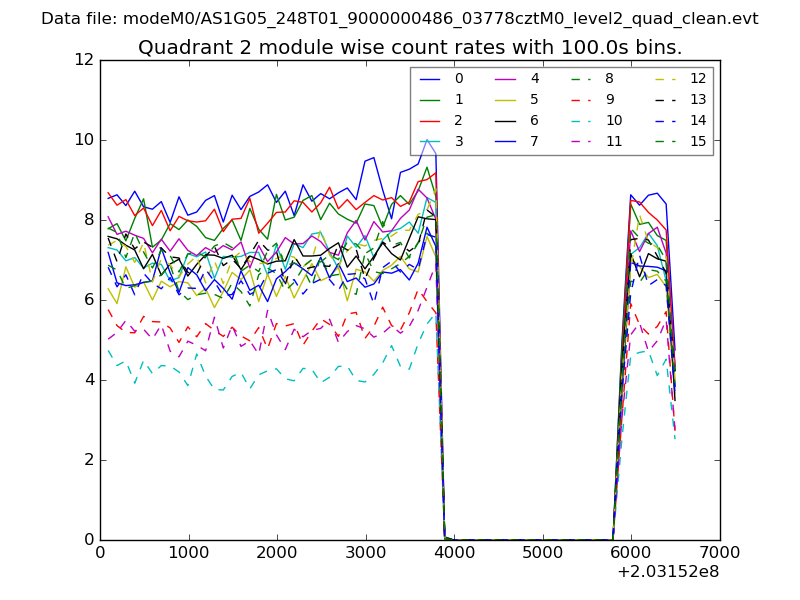
| Module-wise count rates for Quadrant B Data is divided into 100 sec bins |
 |
 |
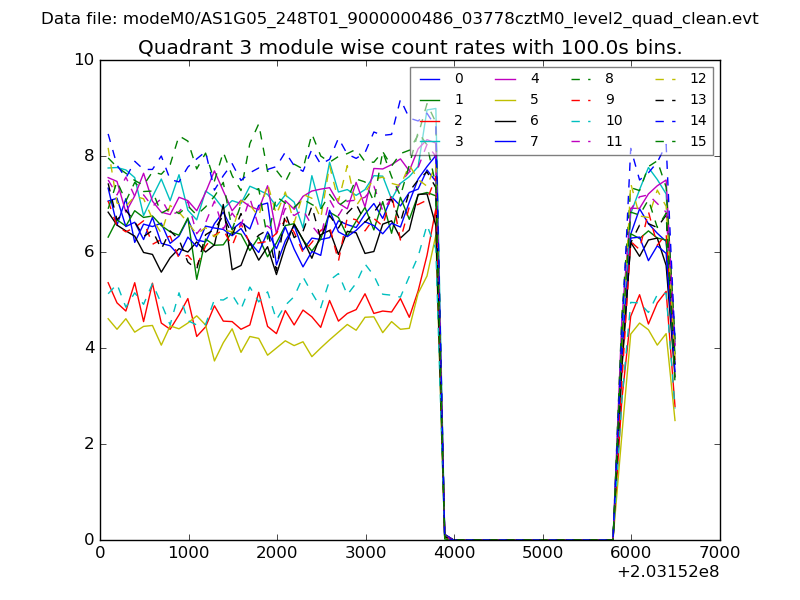
| Module-wise count rates for Quadrant C Data is divided into 100 sec bins |
 |
 |
| Module-wise count rates for Quadrant D Data is divided into 100 sec bins |
 |
 |
| Parameter | Plot |
|---|---|
| CZT HV Monitor | 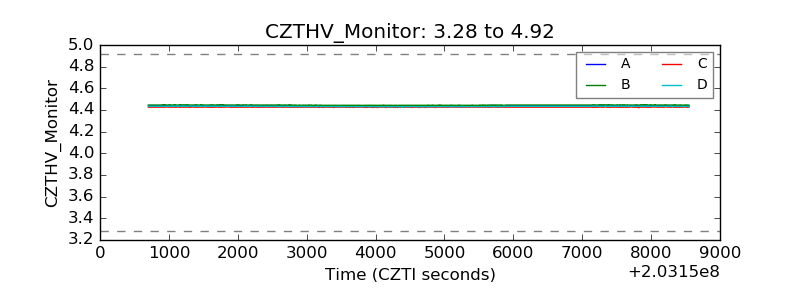 |
| D_VDD | 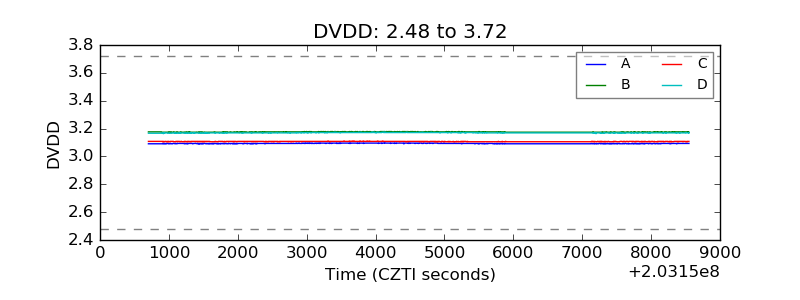 |
| Temperature 1 | 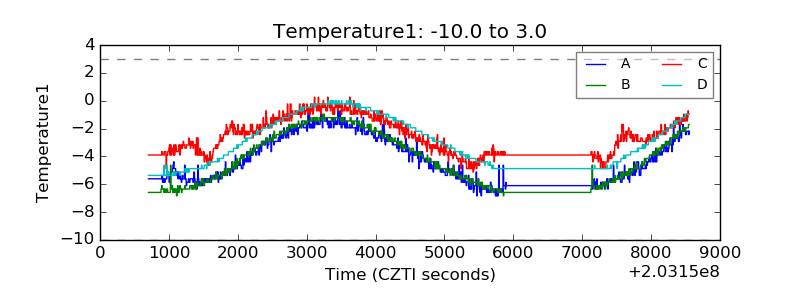 |
| Veto HV Monitor | 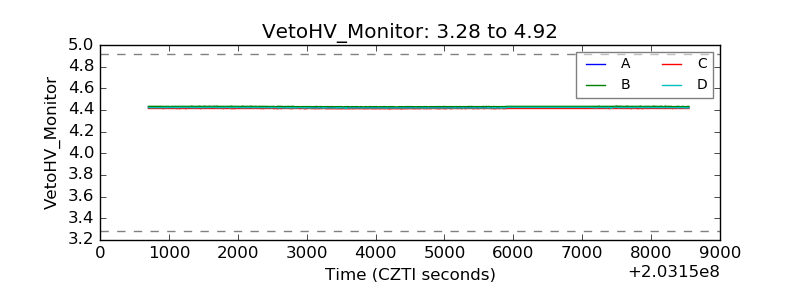 |
| Veto LLD | 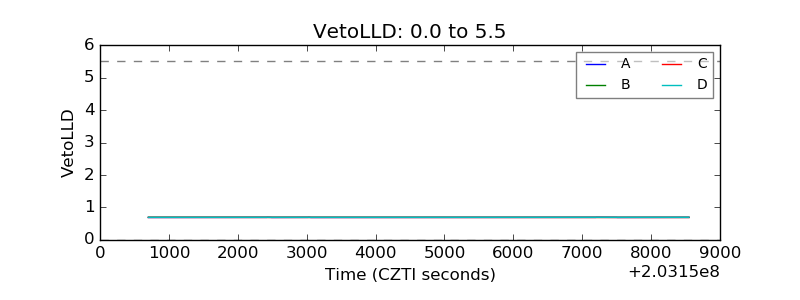 |
| Alpha Counter | 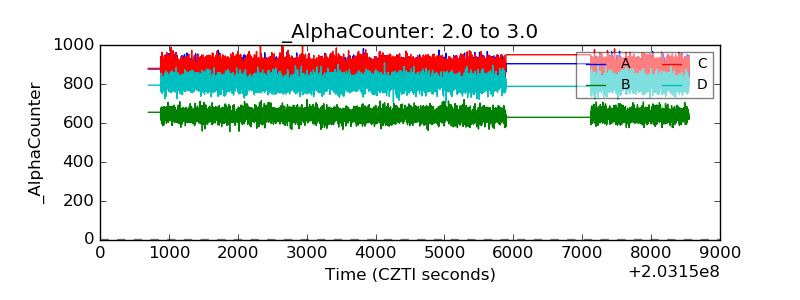 |
| _CPM_Rate | 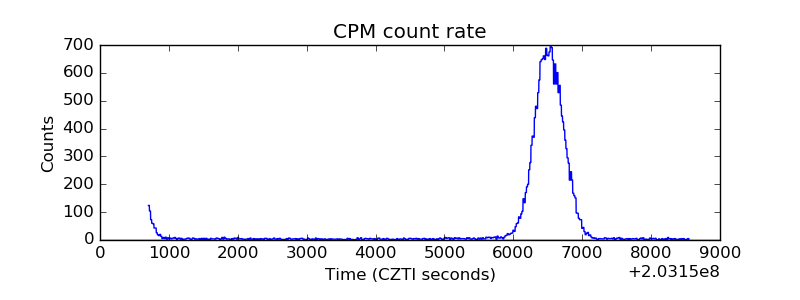 |
| CZT Counter | 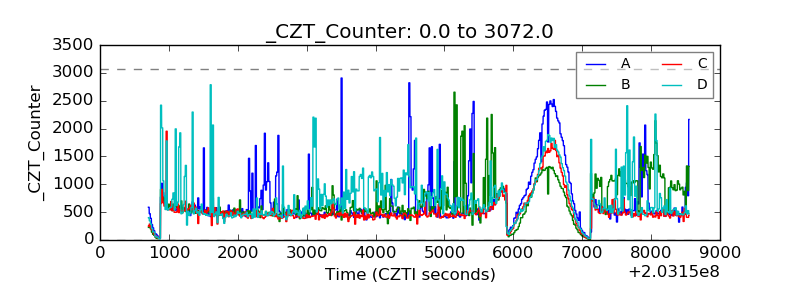 |
| +2.5 Volts monitor |  |
| +5 Volts monitor | 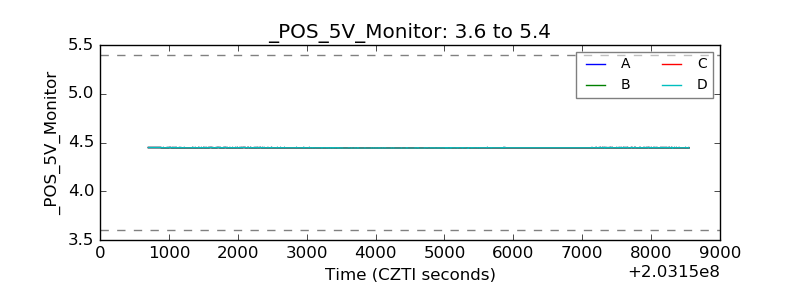 |
| Veto Counter | 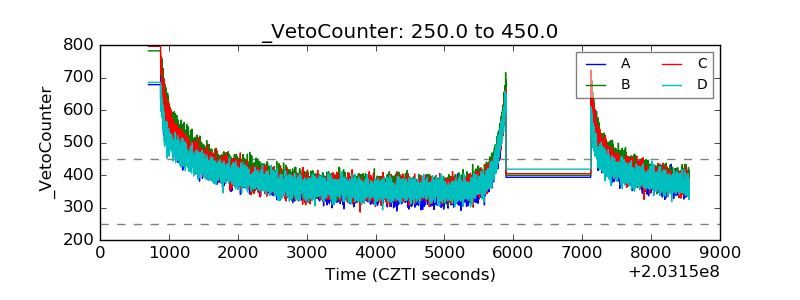 |