| Param | Original file | Final file |
|---|---|---|
| Filename | modeM0/AS1G05_248T01_9000000486_03779cztM0_level2.evt | modeM0/AS1G05_248T01_9000000486_03779cztM0_level2_quad_clean.evt |
| Size (bytes) | 576,213,120 | 80,231,040 |
| Size | 549.5 MB | 76.5 MB |
| Events in quadrant A | 4,085,740 | 508,084 |
| Events in quadrant B | 4,087,070 | 513,152 |
| Events in quadrant C | 3,716,194 | 503,554 |
| Events in quadrant D | 5,148,976 | 478,835 |
| Mode SS | |||
|---|---|---|---|
| Quadrant | BADHDUFLAG | Total packets | Discarded packets |
| A | 0 | 122 | 0 |
| B | 0 | 122 | 0 |
| C | 0 | 122 | 0 |
| D | 0 | 122 | 0 |
| Mode M9 | |||
|---|---|---|---|
| Quadrant | BADHDUFLAG | Total packets | Discarded packets |
| A | 0 | 11 | 0 |
| B | 0 | 11 | 0 |
| C | 0 | 11 | 0 |
| D | 0 | 11 | 0 |
| Mode M0 | |||
|---|---|---|---|
| Quadrant | BADHDUFLAG | Total packets | Discarded packets |
| A | 0 | 16139 | 2 |
| B | 0 | 16143 | 1 |
| C | 0 | 15193 | 1 |
| D | 0 | 19416 | 1 |
| Quadrant | Total seconds | Saturated seconds | Saturation percentage |
|---|---|---|---|
| A | 6103 | 449 | 7.357038% |
| B | 6103 | 326 | 5.341635% |
| C | 6103 | 184 | 3.014911% |
| D | 6103 | 329 | 5.390791% |
Noise dominated data is calculated using 1-second bins in cleaned event files. If a bin has >2000 counts, and if more than 50% of those come from <1% of pixels, then it is considered to be noise-dominated and hence unusable.
| Quadrant | # 1 sec bins | Bins with >0 counts | Bins with >2000 counts | High rate bins dominated by noise | Noise dominated (total time) | Noise dominated (detector-on time) | Marked lightcurve |
|---|---|---|---|---|---|---|---|
| A | 7158 | 6104 | 213 | 213 | 2.98% | 3.49% | 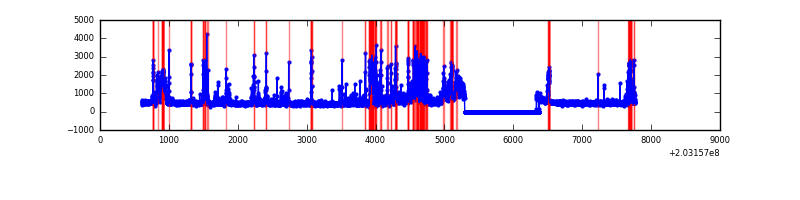 |
| B | 7158 | 6104 | 120 | 120 | 1.68% | 1.97% | 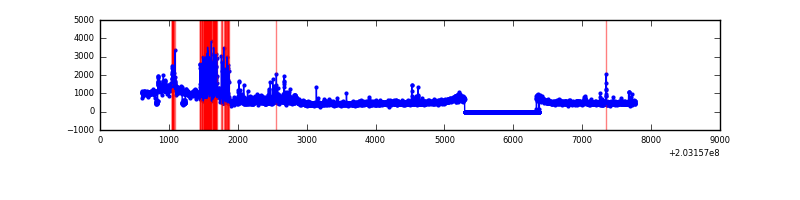 |
| C | 7158 | 6104 | 56 | 56 | 0.78% | 0.92% | 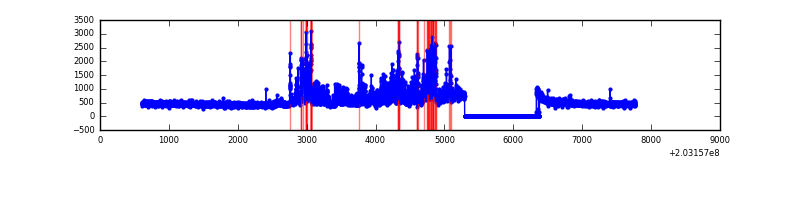 |
| D | 7158 | 6104 | 211 | 211 | 2.95% | 3.46% | 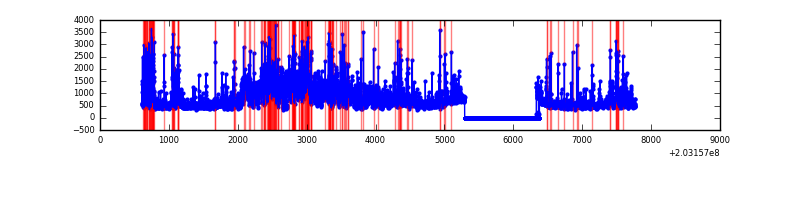 |
Top three noisy pixels from each quadrant. If the there are fewer than three noisy pixels in the level2.evt file, extra rows are filled as -1
| Pixel properties | Quadrant properties | ||||||
|---|---|---|---|---|---|---|---|
| Quadrant | DetID | PixID | Counts | Sigma | Mean | Median | Sigma |
| A | 13 | 251 | 781571 | 5362.66 | 717 | 699 | 145.6 |
| A | 0 | 50 | 175438 | 1200.03 | 717 | 699 | 145.6 |
| A | 0 | 118 | 170799 | 1168.17 | 717 | 699 | 145.6 |
| B | 0 | 173 | 1050310 | 7371.02 | 735 | 716 | 142.4 |
| B | 15 | 204 | 124289 | 867.82 | 735 | 716 | 142.4 |
| B | 0 | 229 | 16022 | 107.49 | 735 | 716 | 142.4 |
| C | 2 | 53 | 934002 | 5715.49 | 708 | 710 | 163.3 |
| C | 1 | 16 | 7500 | 41.58 | 708 | 710 | 163.3 |
| C | 13 | 61 | 6001 | 32.4 | 708 | 710 | 163.3 |
| D | 1 | 84 | 1684099 | 9942.97 | 705 | 684 | 169.3 |
| D | 8 | 112 | 513567 | 3029.3 | 705 | 684 | 169.3 |
| D | 13 | 137 | 64568 | 377.32 | 705 | 684 | 169.3 |
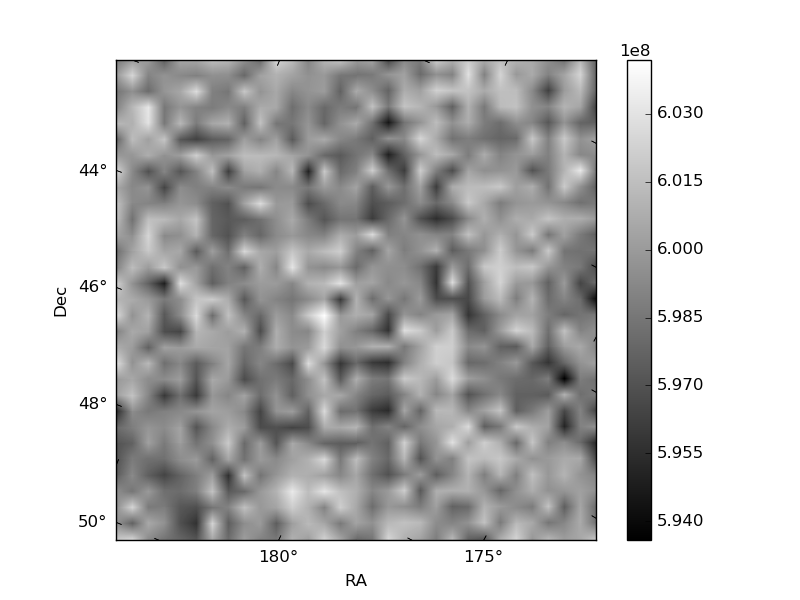
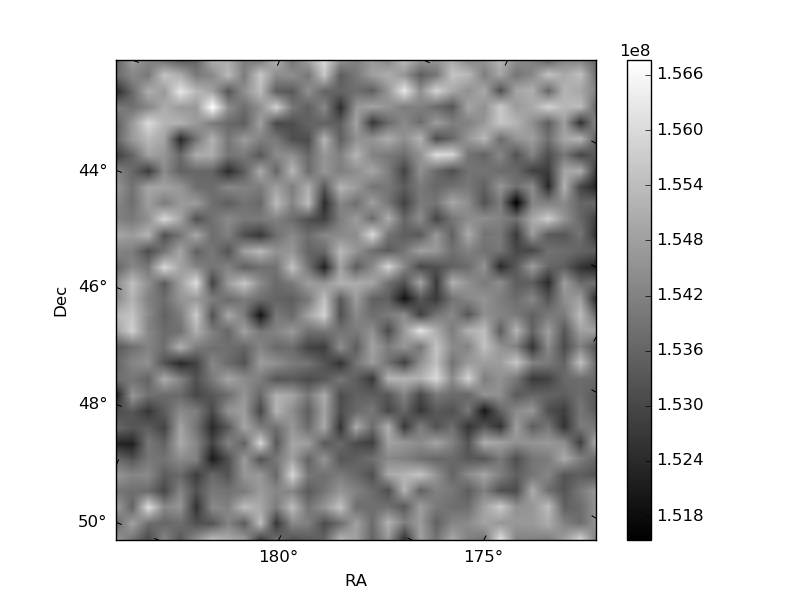
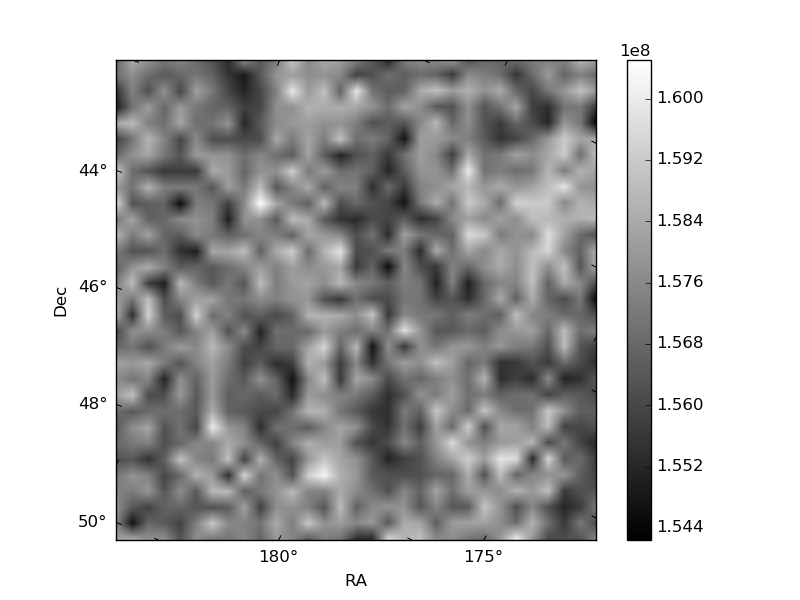
Histogram calculated using DETX and DETY for each event in the final _common_clean file
| Quadrant A | 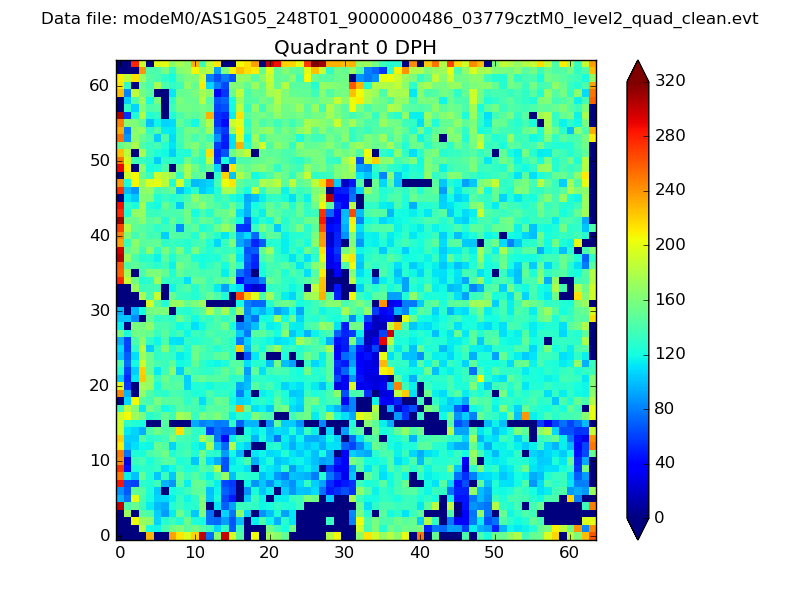 |
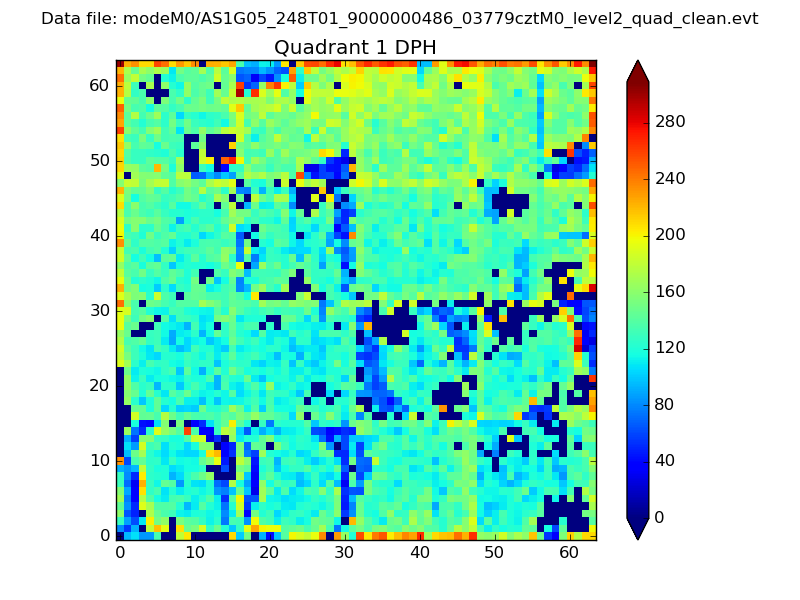 |
Quadrant B |
|---|---|---|---|
| Quadrant D | 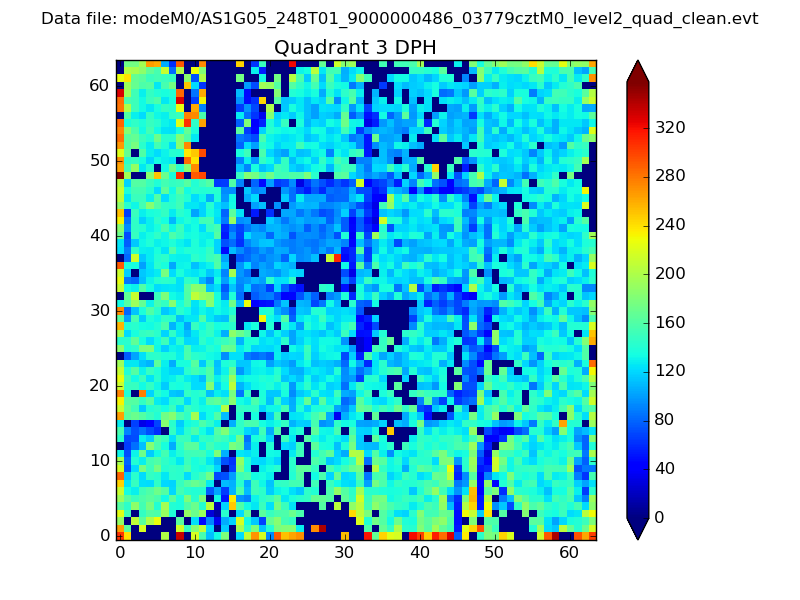 |
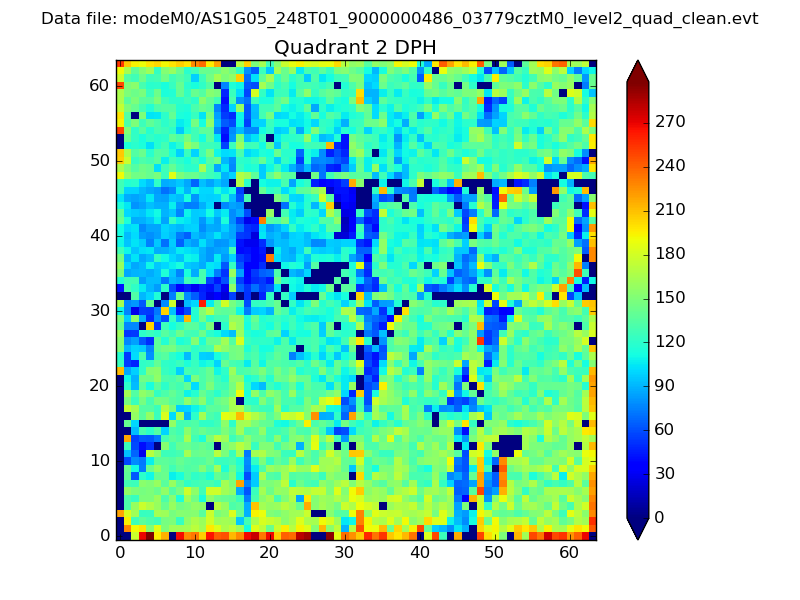 |
Quadrant C |
| Plot type | Count rate plots | Images |
|---|---|---|
| Comparison with Poisson distribution Blue bars denote a histogram of data divided into 1 sec bins. Red curve is a Poisson curve with rate = median count rate of data. |
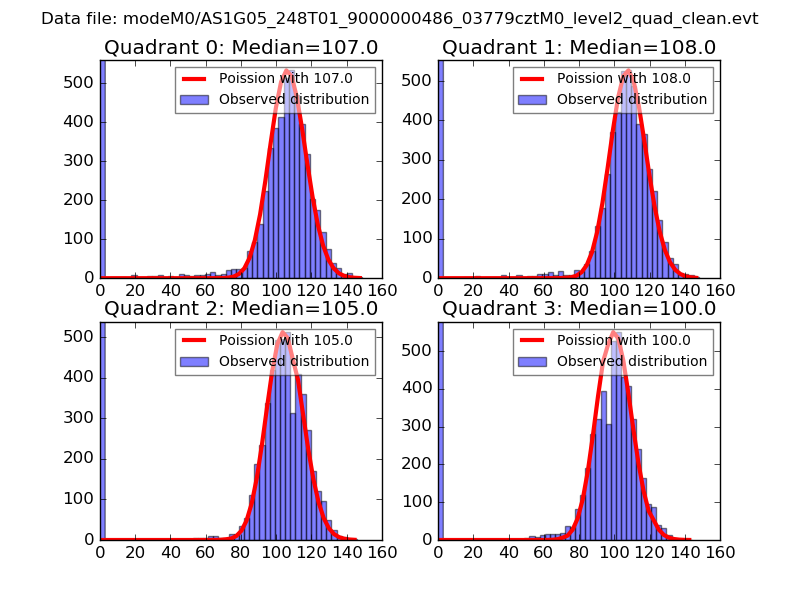 |
 |
| Quadrant-wise count rates Data is divided into 100 sec bins |
 |
|
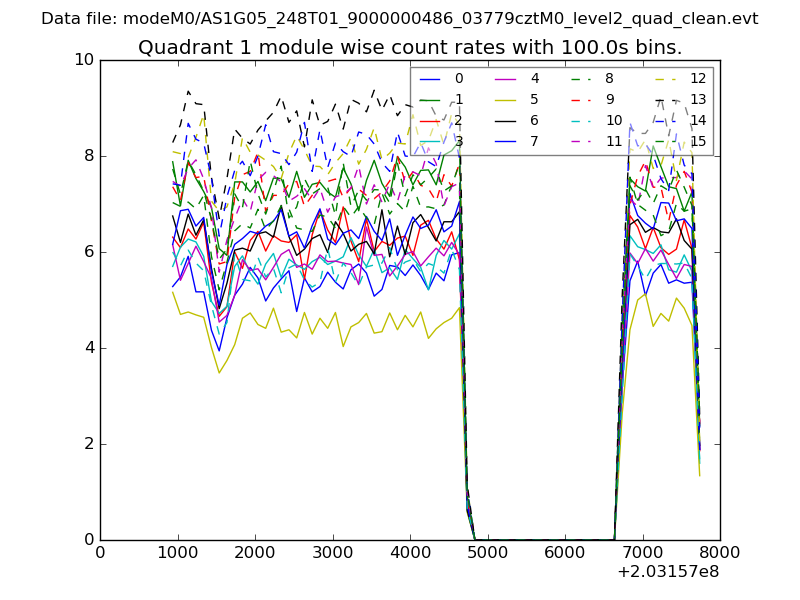
| Module-wise count rates for Quadrant A Data is divided into 100 sec bins |
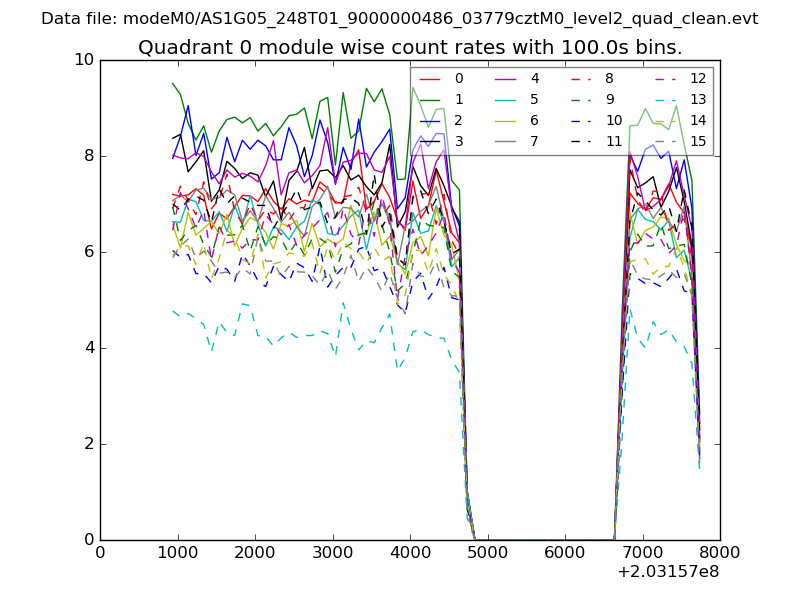 |
 |
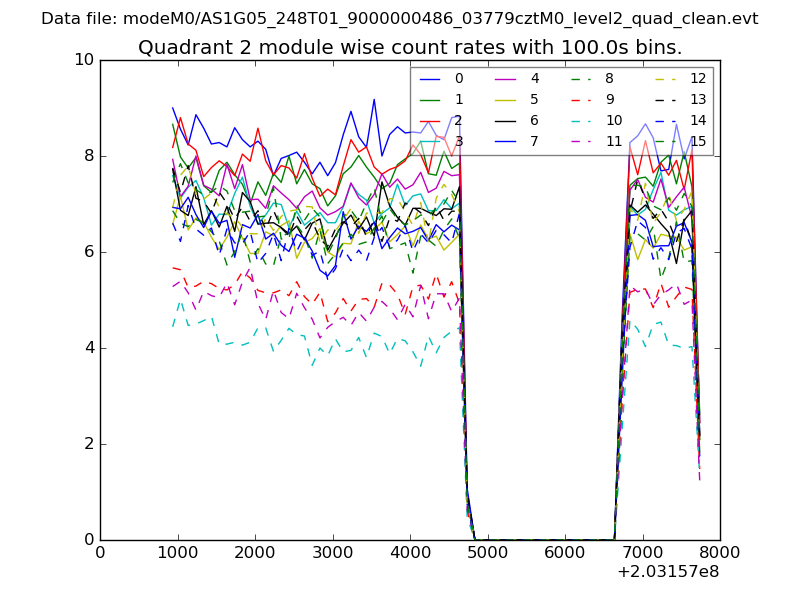
| Module-wise count rates for Quadrant B Data is divided into 100 sec bins |
 |
 |
| Module-wise count rates for Quadrant C Data is divided into 100 sec bins |
 |
 |
| Module-wise count rates for Quadrant D Data is divided into 100 sec bins |
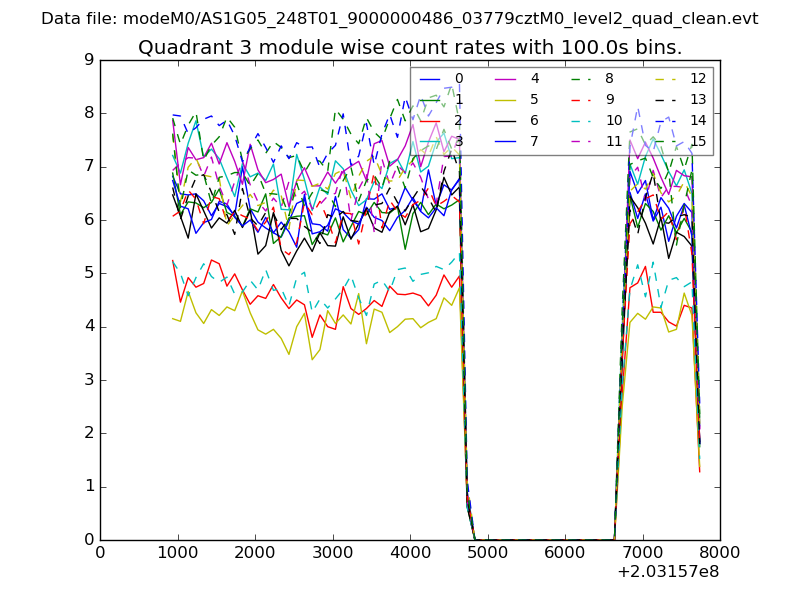 |
 |
| Parameter | Plot |
|---|---|
| CZT HV Monitor | 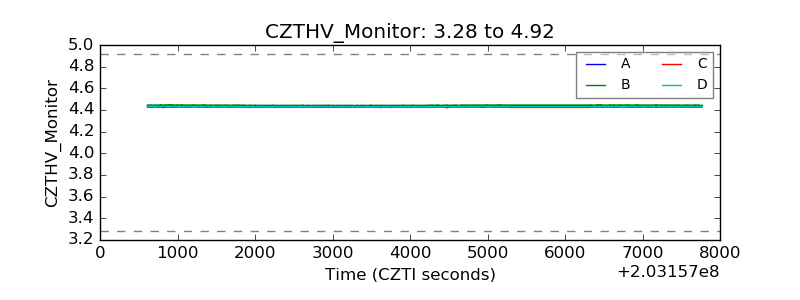 |
| D_VDD | 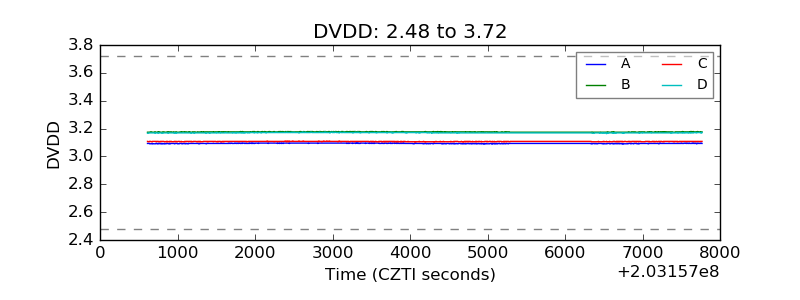 |
| Temperature 1 | 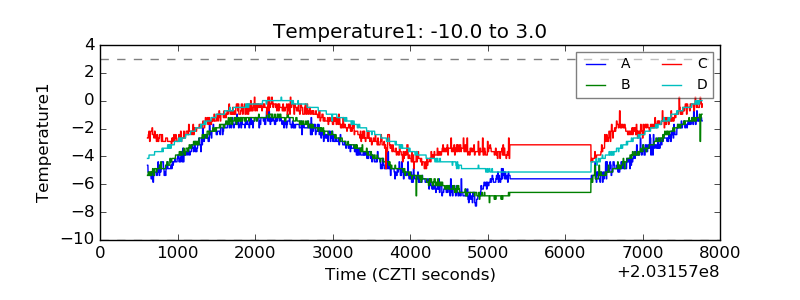 |
| Veto HV Monitor | 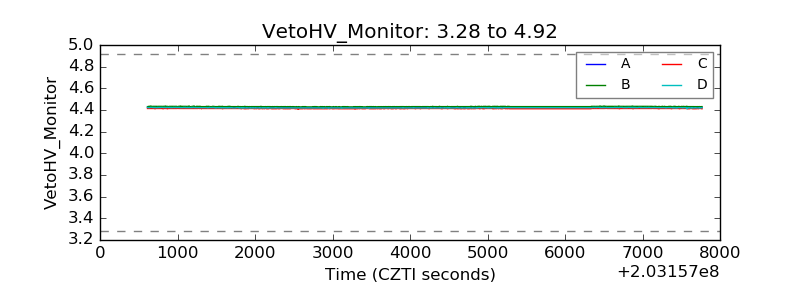 |
| Veto LLD | 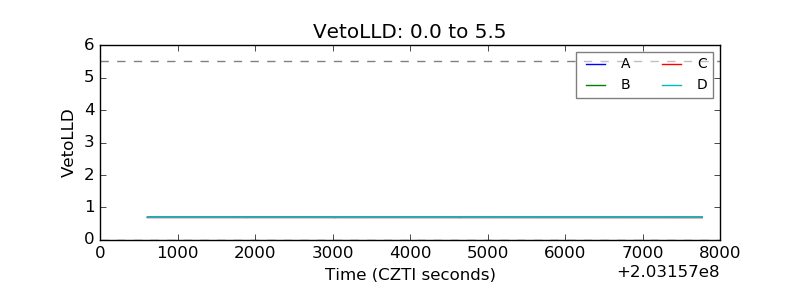 |
| Alpha Counter | 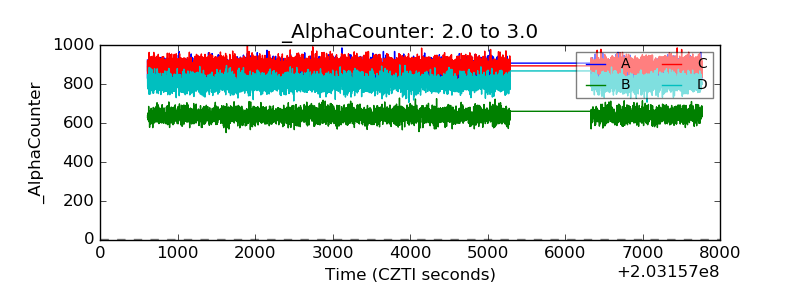 |
| _CPM_Rate | 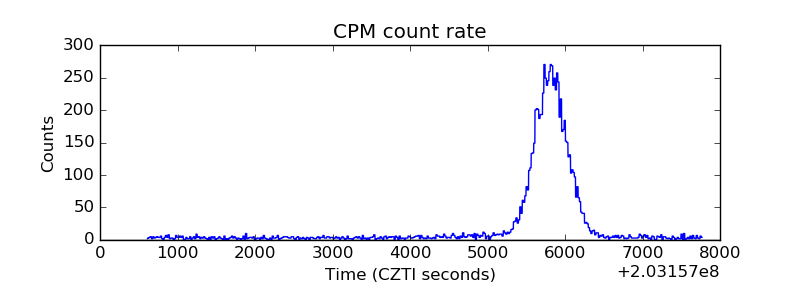 |
| CZT Counter | 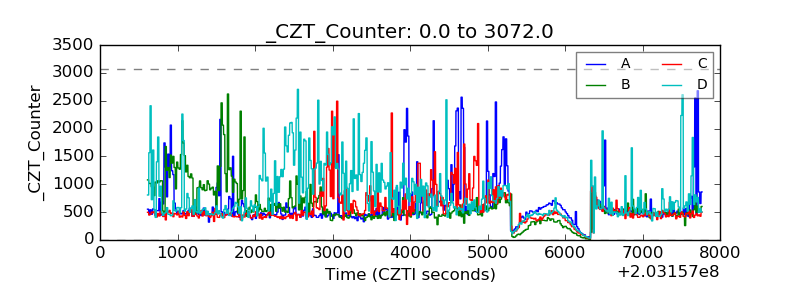 |
| +2.5 Volts monitor |  |
| +5 Volts monitor |  |
| Veto Counter | 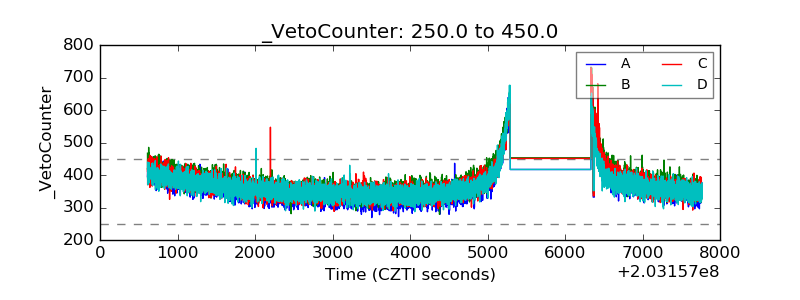 |