| Param | Original file | Final file |
|---|---|---|
| Filename | modeM0/AS1G05_248T01_9000000486_03780cztM0_level2.evt | modeM0/AS1G05_248T01_9000000486_03780cztM0_level2_quad_clean.evt |
| Size (bytes) | 594,129,600 | 89,507,520 |
| Size | 566.6 MB | 85.4 MB |
| Events in quadrant A | 3,870,826 | 562,309 |
| Events in quadrant B | 4,353,168 | 569,273 |
| Events in quadrant C | 3,508,478 | 557,088 |
| Events in quadrant D | 5,777,467 | 524,867 |
| Mode SS | |||
|---|---|---|---|
| Quadrant | BADHDUFLAG | Total packets | Discarded packets |
| A | 0 | 144 | 0 |
| B | 0 | 144 | 0 |
| C | 0 | 144 | 0 |
| D | 0 | 144 | 0 |
| Mode M9 | |||
|---|---|---|---|
| Quadrant | BADHDUFLAG | Total packets | Discarded packets |
| A | 0 | 14 | 0 |
| B | 0 | 14 | 0 |
| C | 0 | 14 | 0 |
| D | 0 | 15 | 0 |
| Mode M0 | |||
|---|---|---|---|
| Quadrant | BADHDUFLAG | Total packets | Discarded packets |
| A | 0 | 16272 | 3 |
| B | 0 | 17582 | 2 |
| C | 0 | 15209 | 2 |
| D | 0 | 22046 | 2 |
| Quadrant | Total seconds | Saturated seconds | Saturation percentage |
|---|---|---|---|
| A | 7138 | 247 | 3.460353% |
| B | 7138 | 136 | 1.905296% |
| C | 7138 | 101 | 1.414962% |
| D | 7138 | 322 | 4.511068% |
Noise dominated data is calculated using 1-second bins in cleaned event files. If a bin has >2000 counts, and if more than 50% of those come from <1% of pixels, then it is considered to be noise-dominated and hence unusable.
| Quadrant | # 1 sec bins | Bins with >0 counts | Bins with >2000 counts | High rate bins dominated by noise | Noise dominated (total time) | Noise dominated (detector-on time) | Marked lightcurve |
|---|---|---|---|---|---|---|---|
| A | 7948 | 7139 | 104 | 104 | 1.31% | 1.46% | 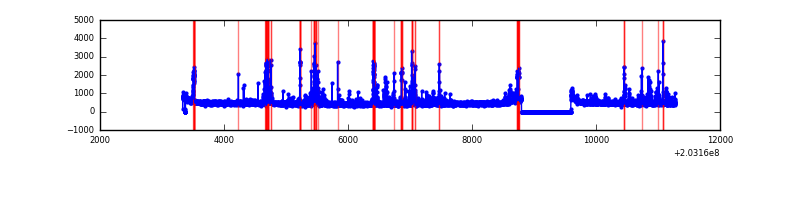 |
| B | 7948 | 7140 | 8 | 8 | 0.10% | 0.11% | 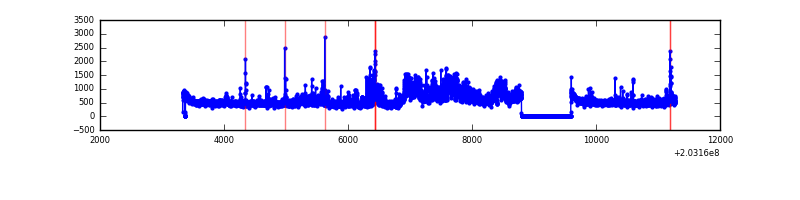 |
| C | 7948 | 7139 | 22 | 22 | 0.28% | 0.31% | 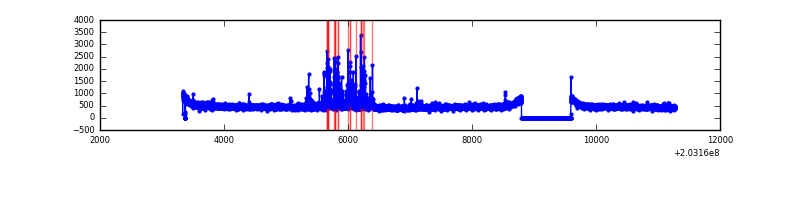 |
| D | 7948 | 7139 | 204 | 204 | 2.57% | 2.86% | 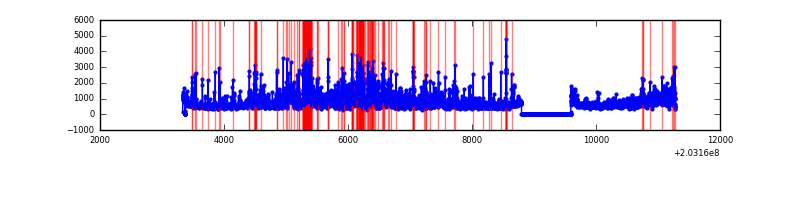 |
Top three noisy pixels from each quadrant. If the there are fewer than three noisy pixels in the level2.evt file, extra rows are filled as -1
| Pixel properties | Quadrant properties | ||||||
|---|---|---|---|---|---|---|---|
| Quadrant | DetID | PixID | Counts | Sigma | Mean | Median | Sigma |
| A | 0 | 118 | 280743 | 1632.5 | 832 | 811 | 171.5 |
| A | 13 | 251 | 205728 | 1195.03 | 832 | 811 | 171.5 |
| A | 0 | 50 | 108112 | 625.75 | 832 | 811 | 171.5 |
| B | 0 | 173 | 821556 | 5021.64 | 844 | 823 | 163.4 |
| B | 15 | 204 | 114153 | 693.4 | 844 | 823 | 163.4 |
| B | 14 | 167 | 33727 | 201.32 | 844 | 823 | 163.4 |
| C | 2 | 53 | 313060 | 1644.87 | 810 | 811 | 189.8 |
| C | 12 | 4 | 12207 | 60.03 | 810 | 811 | 189.8 |
| C | 10 | 65 | 8869 | 42.45 | 810 | 811 | 189.8 |
| D | 1 | 84 | 1778299 | 9275.7 | 802 | 779 | 191.6 |
| D | 8 | 112 | 688218 | 3587.29 | 802 | 779 | 191.6 |
| D | 13 | 249 | 52666 | 270.76 | 802 | 779 | 191.6 |
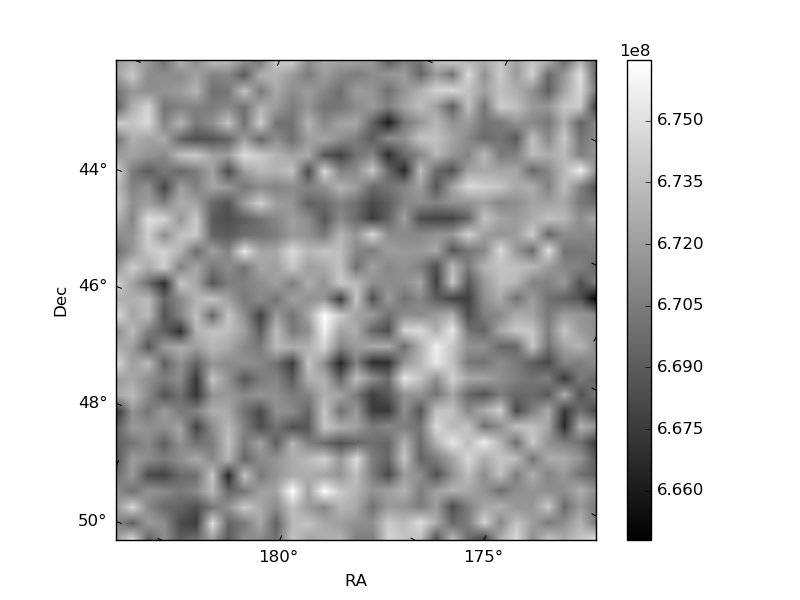
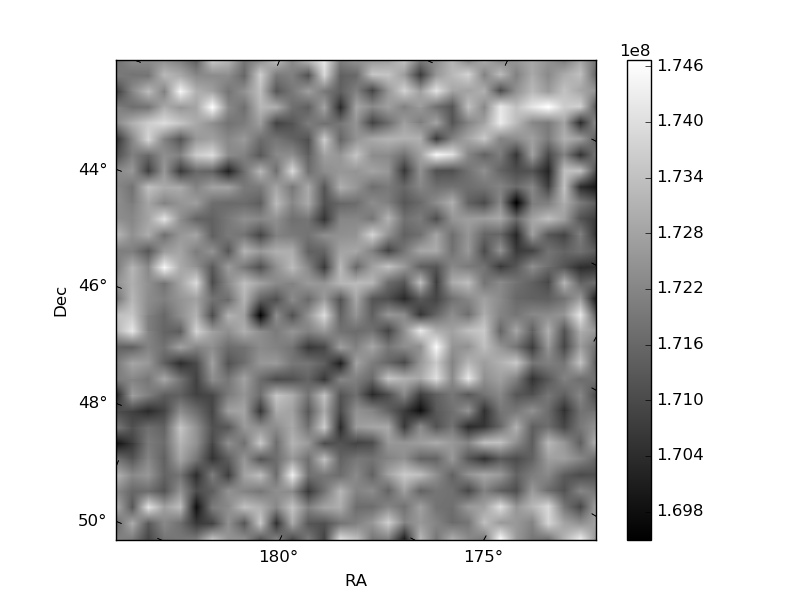
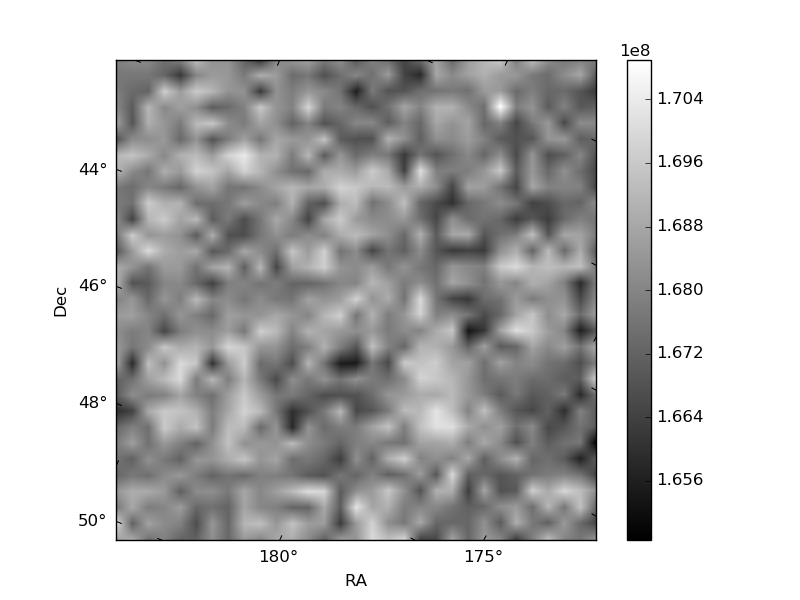
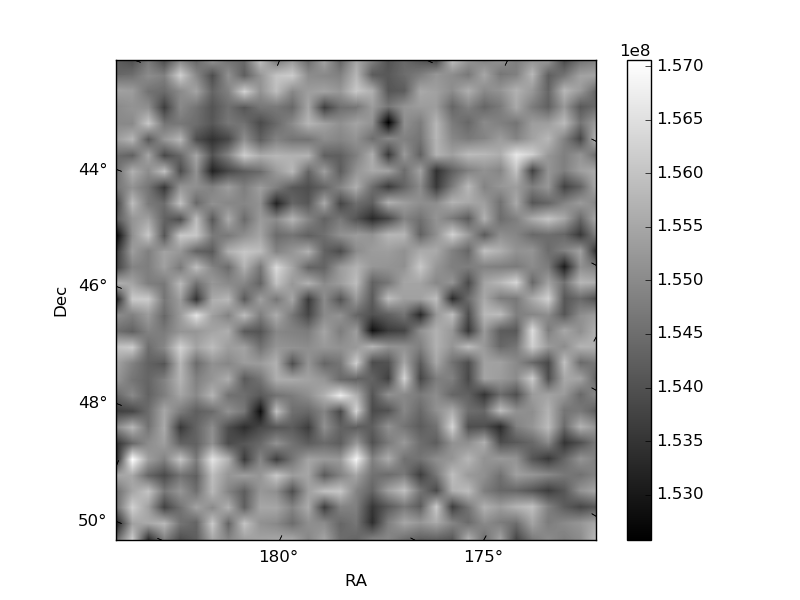
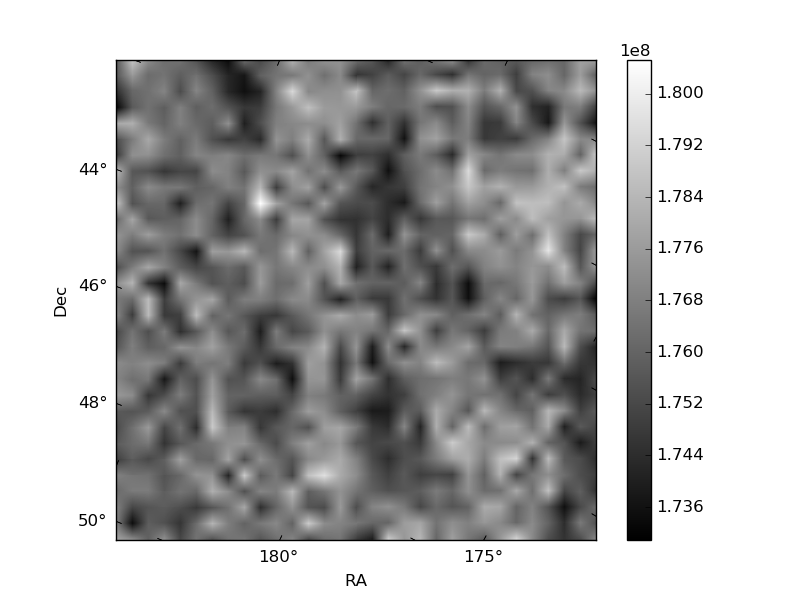
Histogram calculated using DETX and DETY for each event in the final _common_clean file
| Quadrant A | 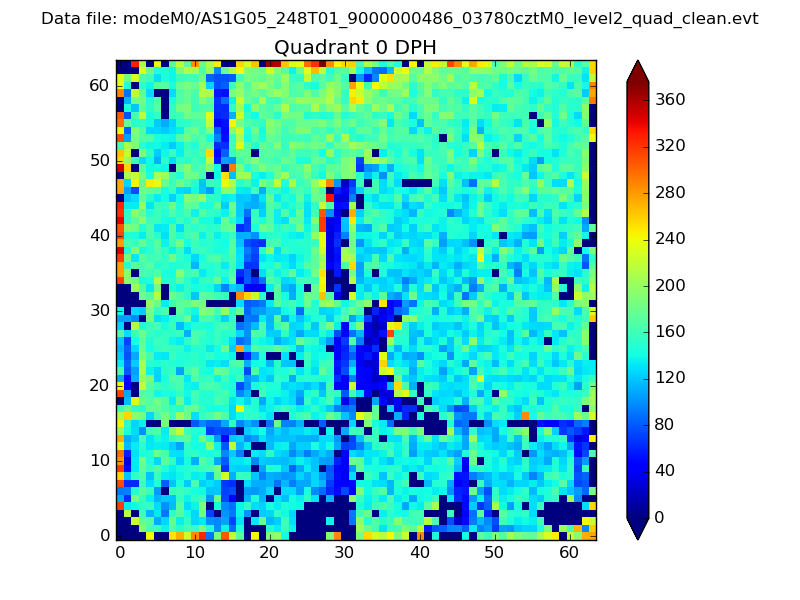 |
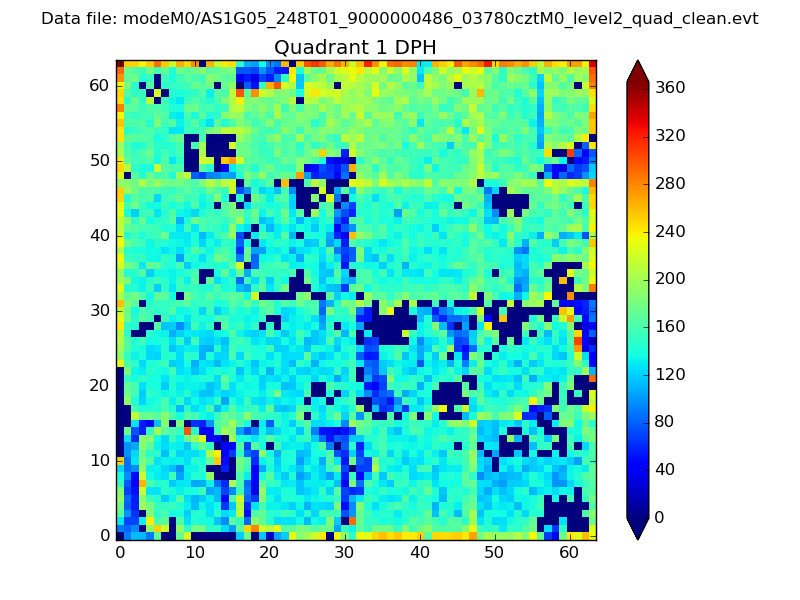 |
Quadrant B |
|---|---|---|---|
| Quadrant D | 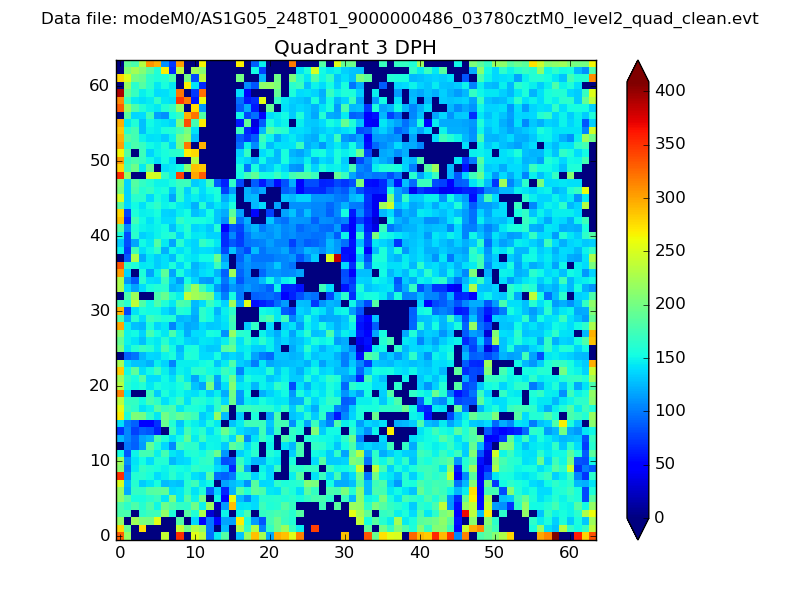 |
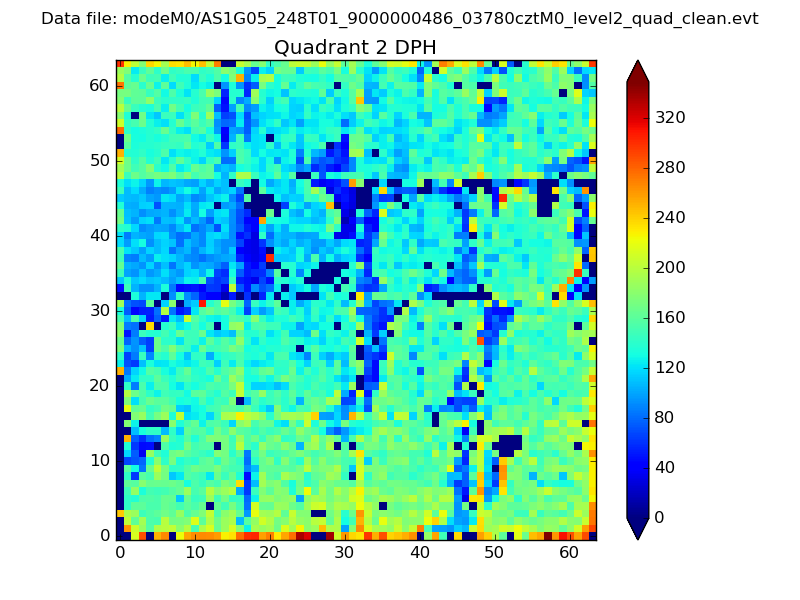 |
Quadrant C |
| Plot type | Count rate plots | Images |
|---|---|---|
| Comparison with Poisson distribution Blue bars denote a histogram of data divided into 1 sec bins. Red curve is a Poisson curve with rate = median count rate of data. |
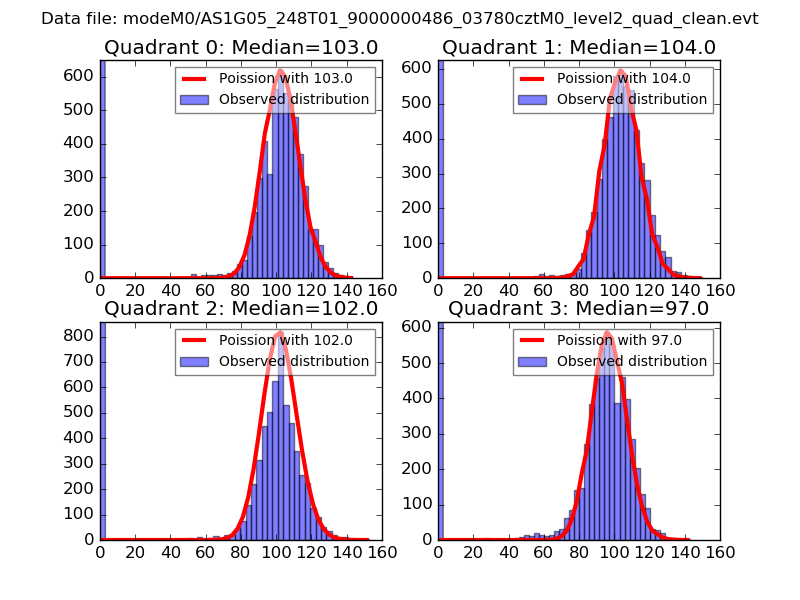 |
 |
| Quadrant-wise count rates Data is divided into 100 sec bins |
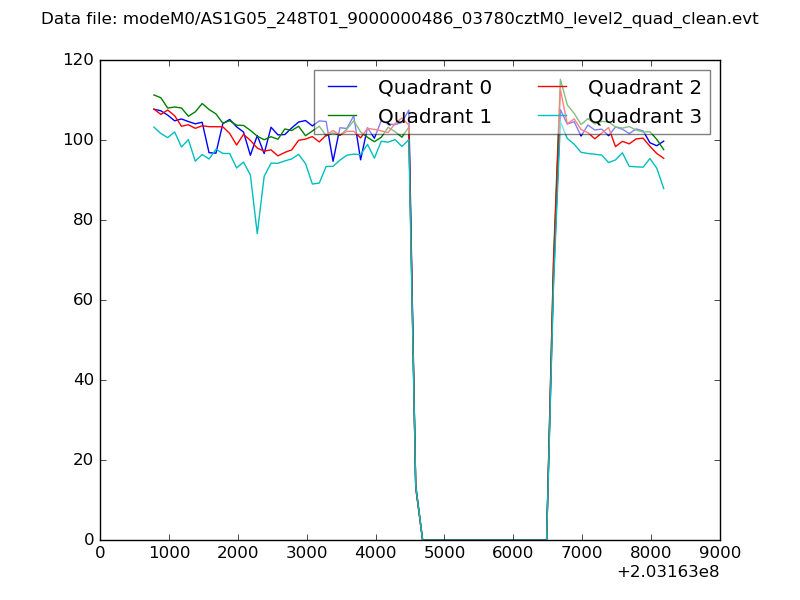 |
|
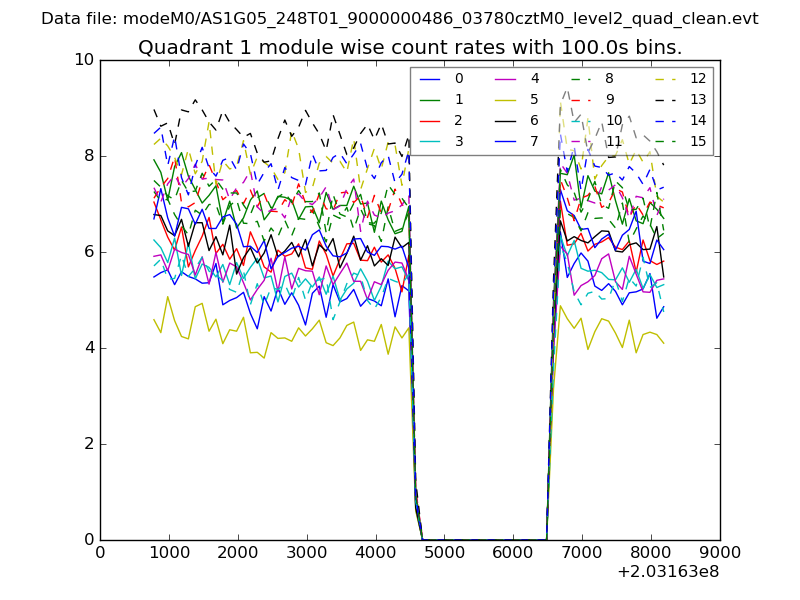
| Module-wise count rates for Quadrant A Data is divided into 100 sec bins |
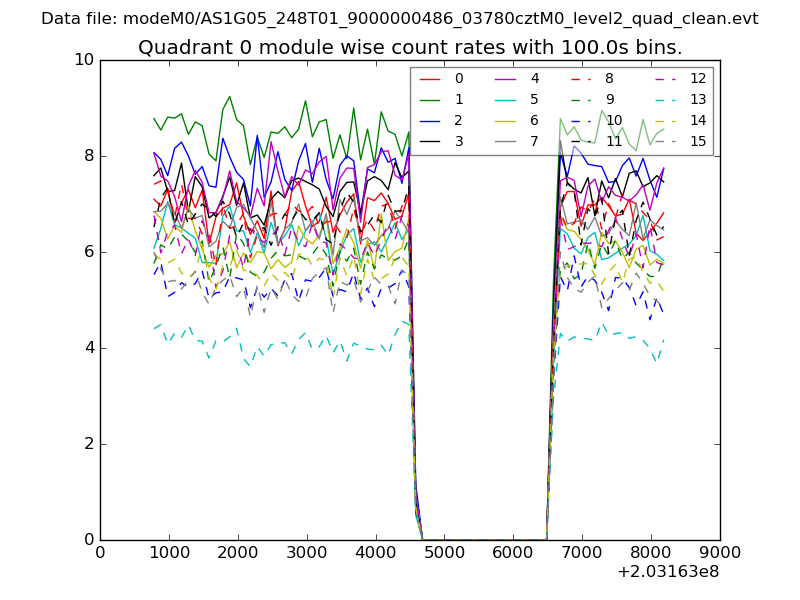 |
 |
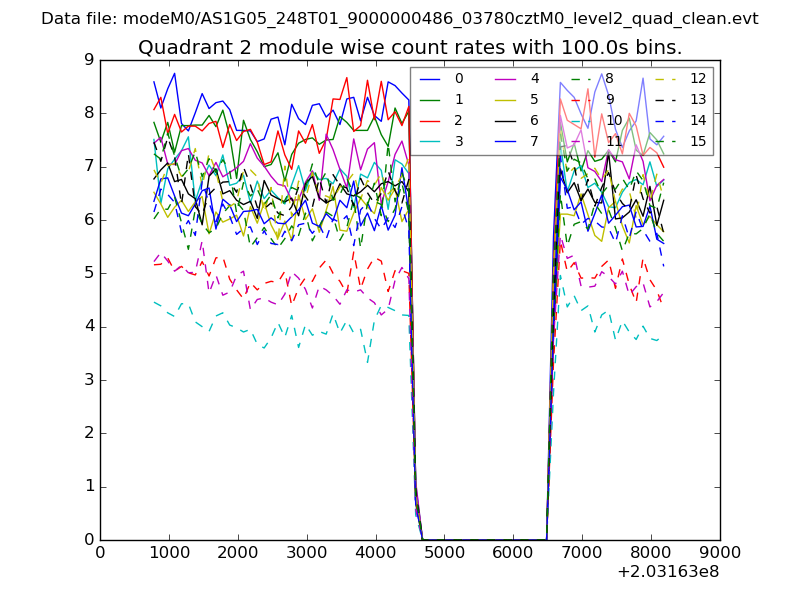
| Module-wise count rates for Quadrant B Data is divided into 100 sec bins |
 |
 |
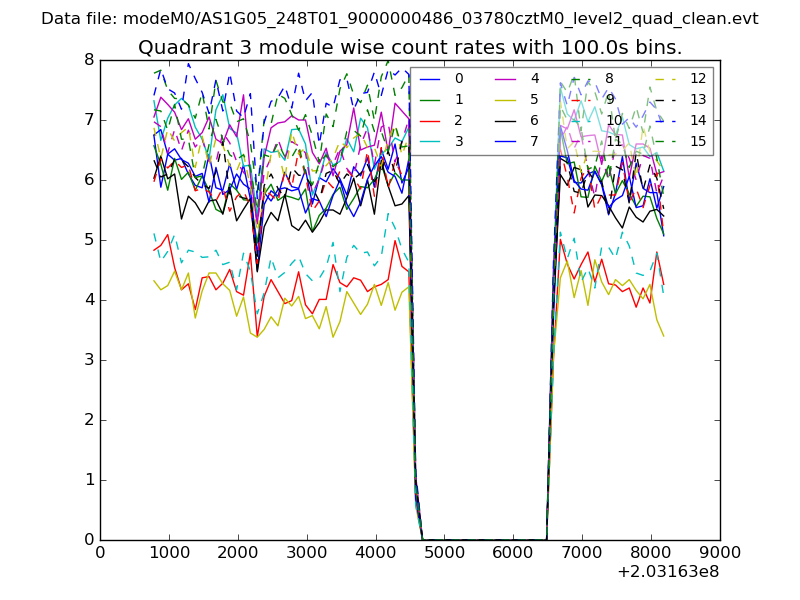
| Module-wise count rates for Quadrant C Data is divided into 100 sec bins |
 |
 |
| Module-wise count rates for Quadrant D Data is divided into 100 sec bins |
 |
 |
| Parameter | Plot |
|---|---|
| CZT HV Monitor | 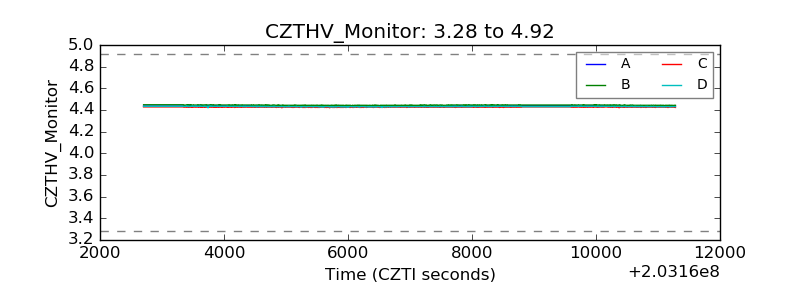 |
| D_VDD | 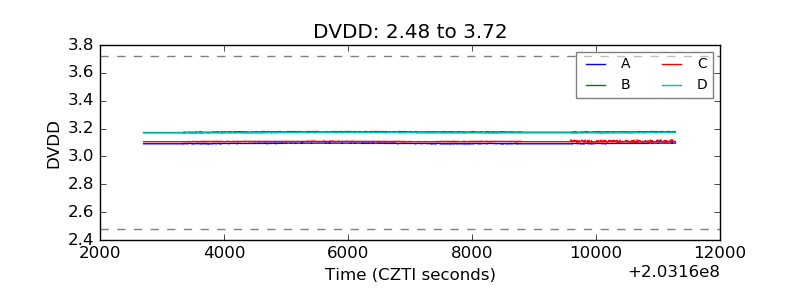 |
| Temperature 1 | 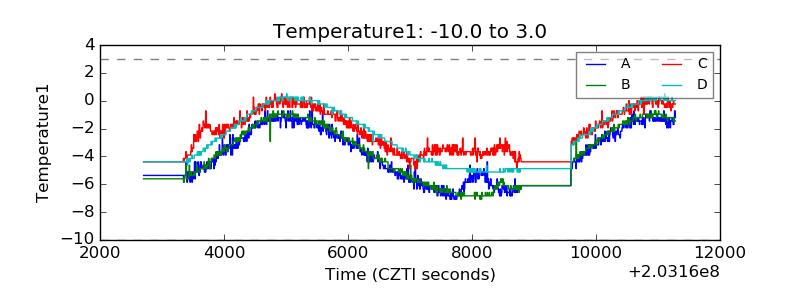 |
| Veto HV Monitor | 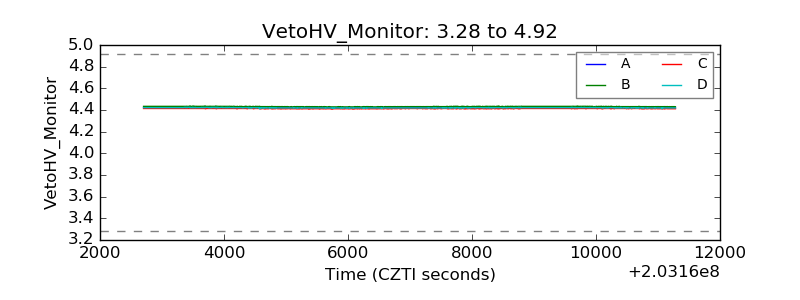 |
| Veto LLD | 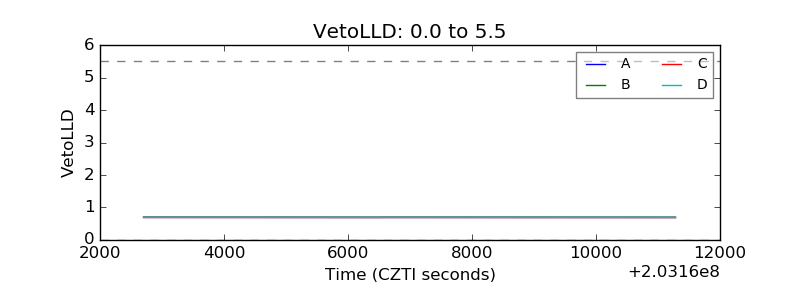 |
| Alpha Counter | 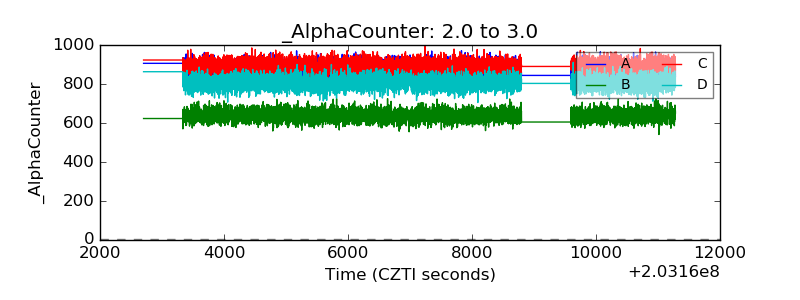 |
| _CPM_Rate | 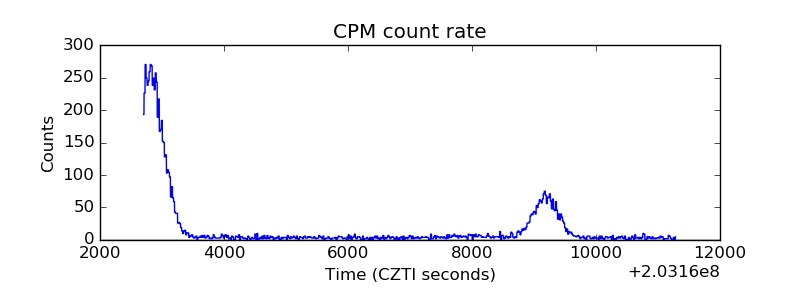 |
| CZT Counter | 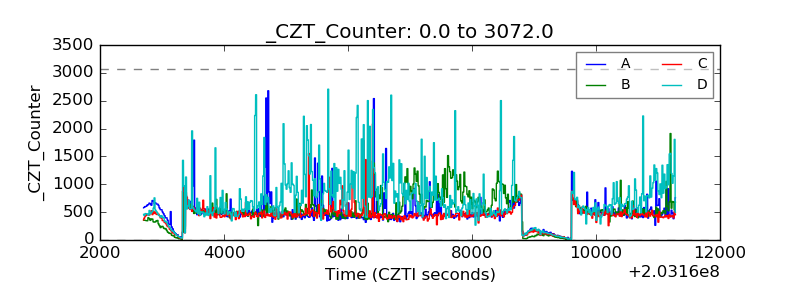 |
| +2.5 Volts monitor | 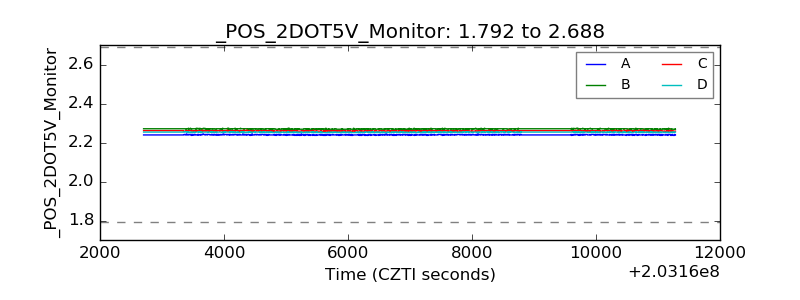 |
| +5 Volts monitor | 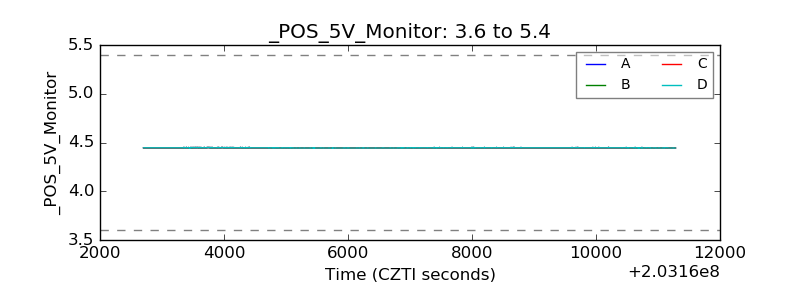 |
| Veto Counter | 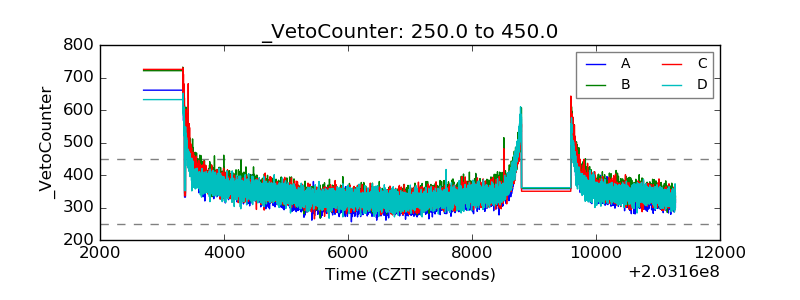 |