| Param | Original file | Final file |
|---|---|---|
| Filename | modeM0/AS1G05_248T01_9000000486_03781cztM0_level2.evt | modeM0/AS1G05_248T01_9000000486_03781cztM0_level2_quad_clean.evt |
| Size (bytes) | 575,426,880 | 83,928,960 |
| Size | 548.8 MB | 80.0 MB |
| Events in quadrant A | 4,257,403 | 516,130 |
| Events in quadrant B | 3,720,313 | 524,797 |
| Events in quadrant C | 3,266,050 | 515,786 |
| Events in quadrant D | 5,697,133 | 485,359 |
| Mode SS | |||
|---|---|---|---|
| Quadrant | BADHDUFLAG | Total packets | Discarded packets |
| A | 0 | 146 | 0 |
| B | 0 | 146 | 0 |
| C | 0 | 146 | 0 |
| D | 0 | 146 | 0 |
| Mode M9 | |||
|---|---|---|---|
| Quadrant | BADHDUFLAG | Total packets | Discarded packets |
| A | 0 | 3 | 0 |
| B | 0 | 3 | 0 |
| C | 0 | 3 | 0 |
| D | 0 | 3 | 0 |
| Mode M0 | |||
|---|---|---|---|
| Quadrant | BADHDUFLAG | Total packets | Discarded packets |
| A | 0 | 17528 | 2 |
| B | 0 | 15668 | 1 |
| C | 0 | 14805 | 1 |
| D | 0 | 21898 | 1 |
| Quadrant | Total seconds | Saturated seconds | Saturation percentage |
|---|---|---|---|
| A | 7167 | 320 | 4.464909% |
| B | 7167 | 133 | 1.855728% |
| C | 7167 | 72 | 1.004604% |
| D | 7167 | 311 | 4.339333% |
Noise dominated data is calculated using 1-second bins in cleaned event files. If a bin has >2000 counts, and if more than 50% of those come from <1% of pixels, then it is considered to be noise-dominated and hence unusable.
| Quadrant | # 1 sec bins | Bins with >0 counts | Bins with >2000 counts | High rate bins dominated by noise | Noise dominated (total time) | Noise dominated (detector-on time) | Marked lightcurve |
|---|---|---|---|---|---|---|---|
| A | 7497 | 7167 | 167 | 167 | 2.23% | 2.33% | 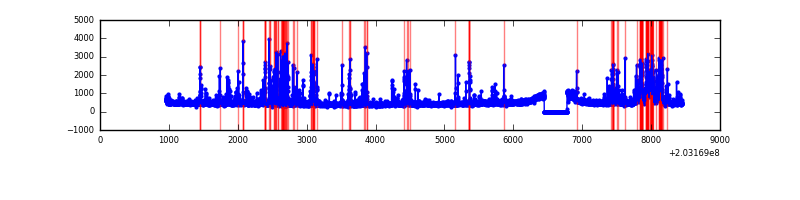 |
| B | 7497 | 7168 | 12 | 12 | 0.16% | 0.17% | 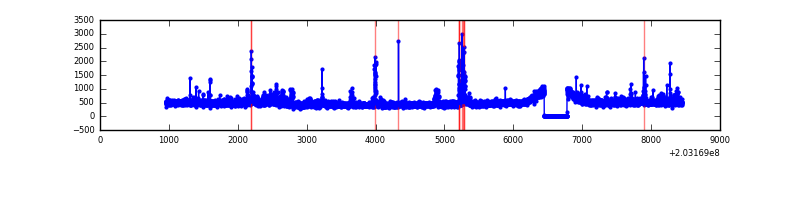 |
| C | 7497 | 7168 | 0 | 0 | 0.00% | 0.00% | 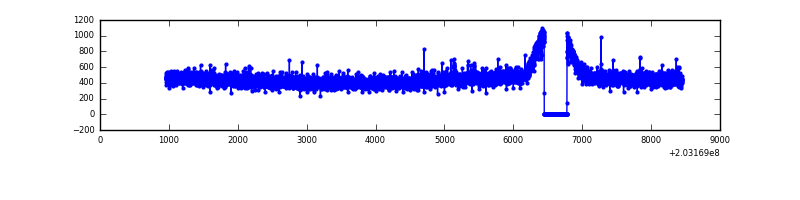 |
| D | 7497 | 7167 | 207 | 207 | 2.76% | 2.89% | 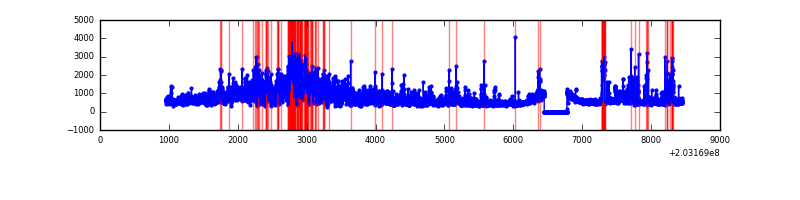 |
Top three noisy pixels from each quadrant. If the there are fewer than three noisy pixels in the level2.evt file, extra rows are filled as -1
| Pixel properties | Quadrant properties | ||||||
|---|---|---|---|---|---|---|---|
| Quadrant | DetID | PixID | Counts | Sigma | Mean | Median | Sigma |
| A | 0 | 118 | 748103 | 4375.14 | 829 | 810 | 170.8 |
| A | 13 | 251 | 127444 | 741.4 | 829 | 810 | 170.8 |
| A | 0 | 50 | 85199 | 494.07 | 829 | 810 | 170.8 |
| B | 15 | 204 | 201176 | 1222.05 | 842 | 820 | 164.0 |
| B | 0 | 172 | 61532 | 370.31 | 842 | 820 | 164.0 |
| B | 0 | 173 | 46551 | 278.93 | 842 | 820 | 164.0 |
| C | 2 | 53 | 45761 | 234.72 | 812 | 812 | 191.5 |
| C | 10 | 65 | 18629 | 93.04 | 812 | 812 | 191.5 |
| C | 8 | 128 | 14547 | 71.72 | 812 | 812 | 191.5 |
| D | 1 | 84 | 1726687 | 8891.27 | 804 | 779 | 194.1 |
| D | 13 | 249 | 218131 | 1119.72 | 804 | 779 | 194.1 |
| D | 1 | 20 | 196571 | 1008.65 | 804 | 779 | 194.1 |
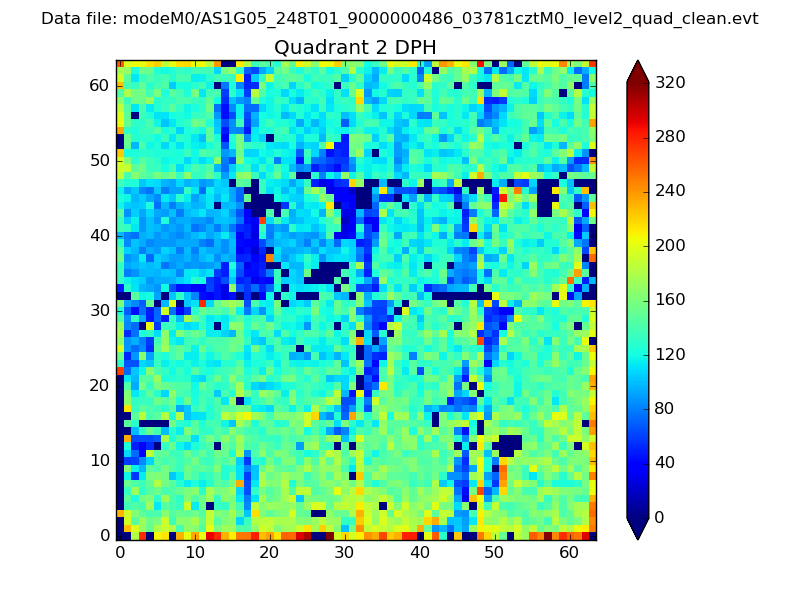
Histogram calculated using DETX and DETY for each event in the final _common_clean file
| Quadrant A | 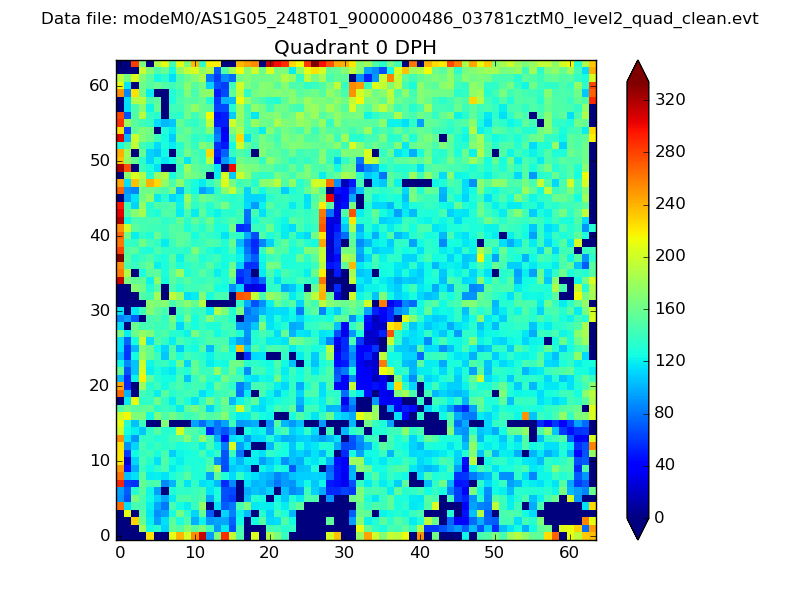 |
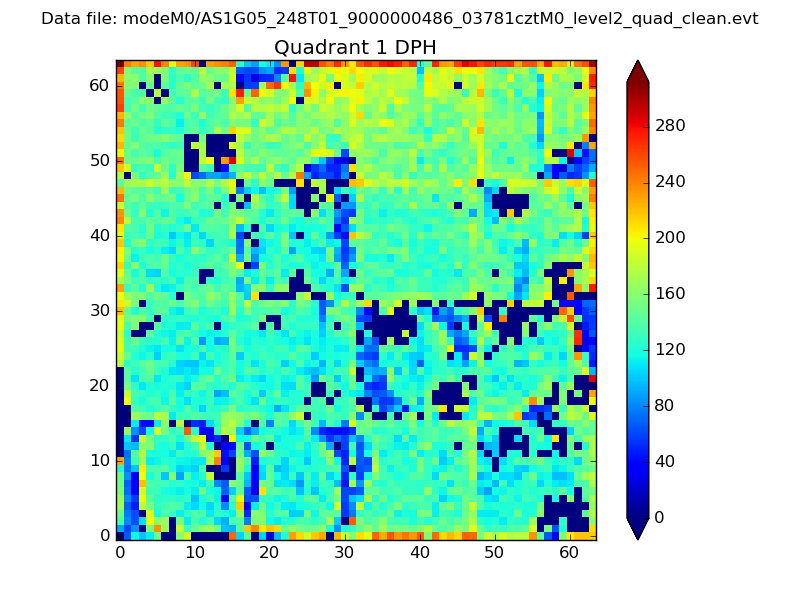 |
Quadrant B |
|---|---|---|---|
| Quadrant D | 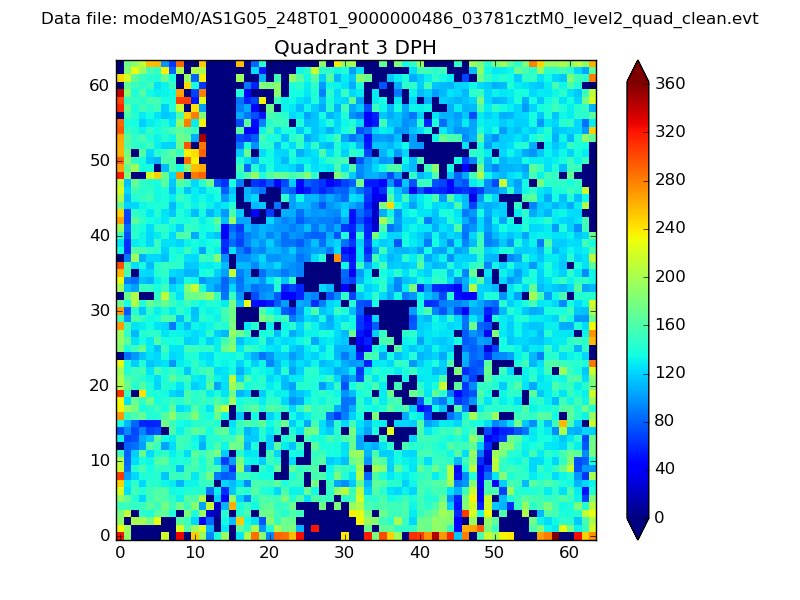 |
 |
Quadrant C |
| Plot type | Count rate plots | Images |
|---|---|---|
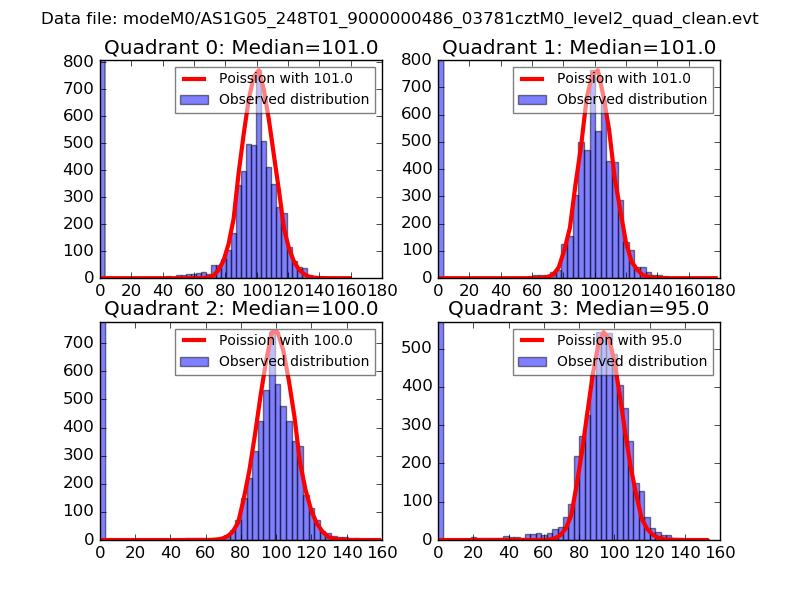
| Comparison with Poisson distribution Blue bars denote a histogram of data divided into 1 sec bins. Red curve is a Poisson curve with rate = median count rate of data. |
 |
 |
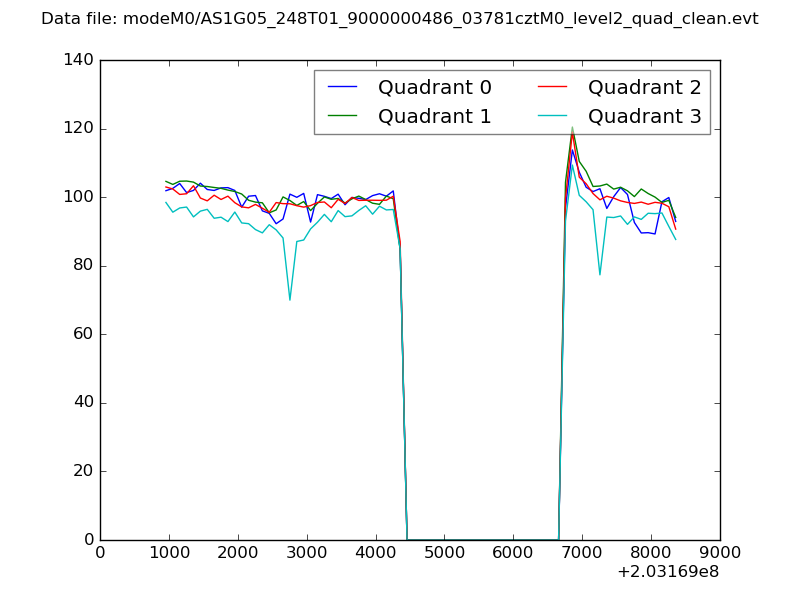
| Quadrant-wise count rates Data is divided into 100 sec bins |
 |
|
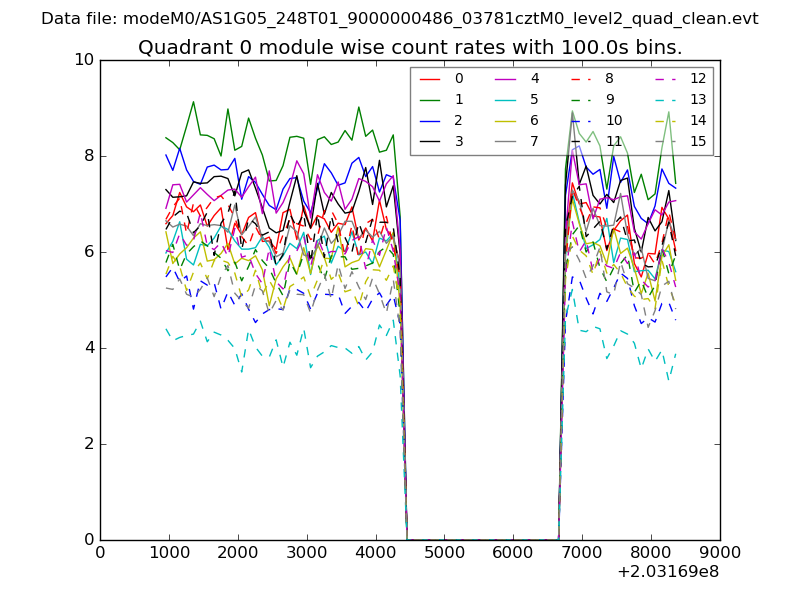
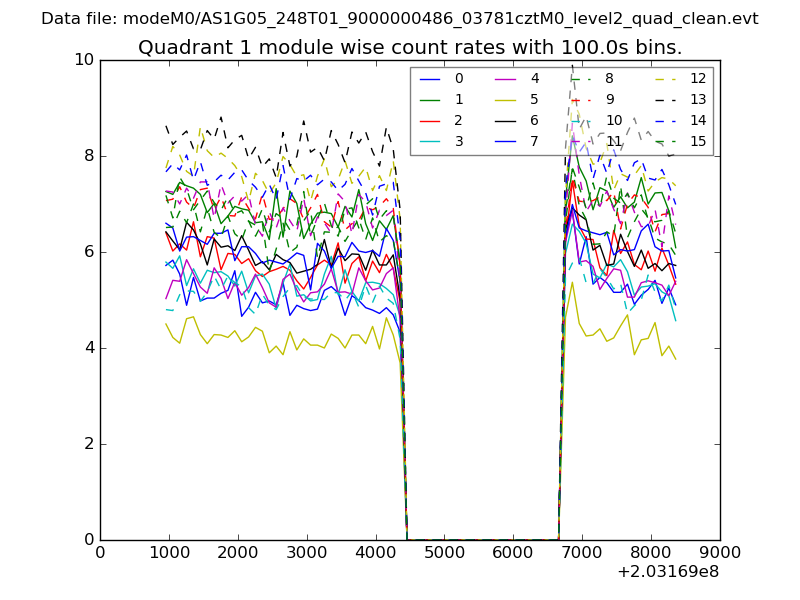
| Module-wise count rates for Quadrant A Data is divided into 100 sec bins |
 |
 |
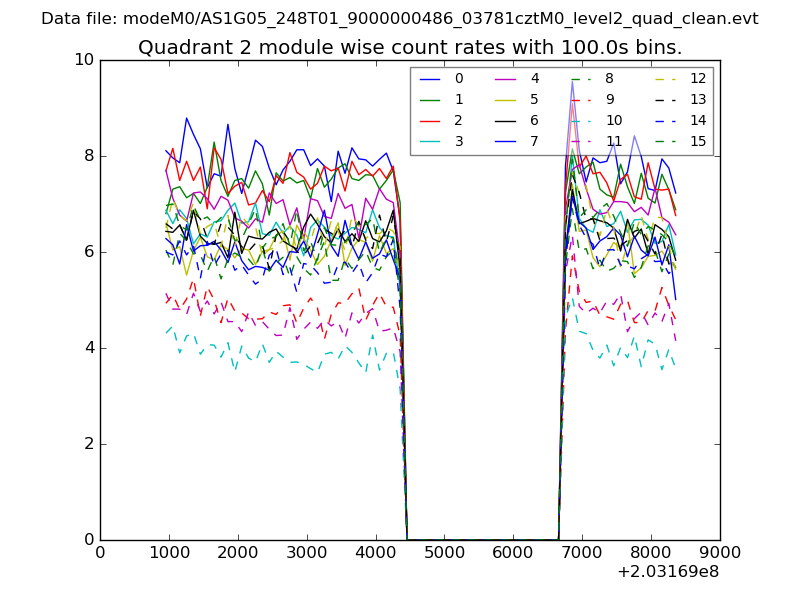
| Module-wise count rates for Quadrant B Data is divided into 100 sec bins |
 |
 |
| Module-wise count rates for Quadrant C Data is divided into 100 sec bins |
 |
 |
| Module-wise count rates for Quadrant D Data is divided into 100 sec bins |
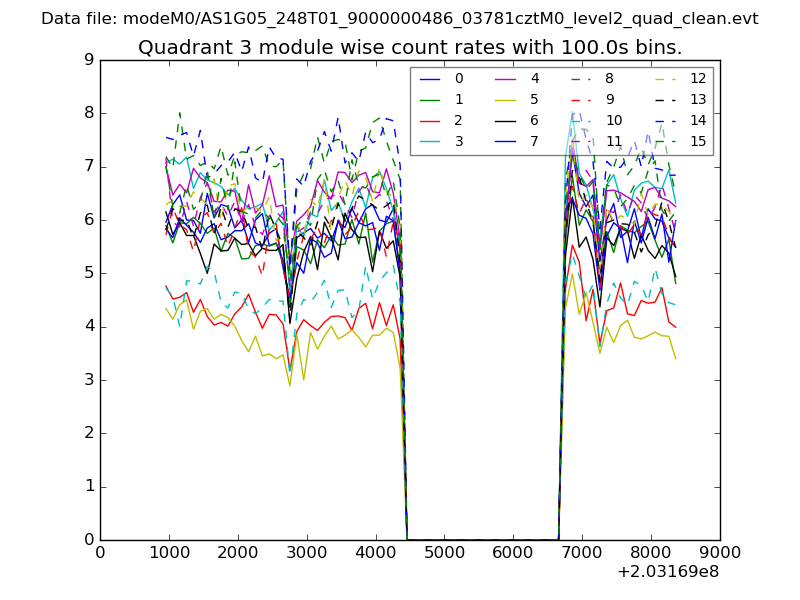 |
 |
| Parameter | Plot |
|---|---|
| CZT HV Monitor | 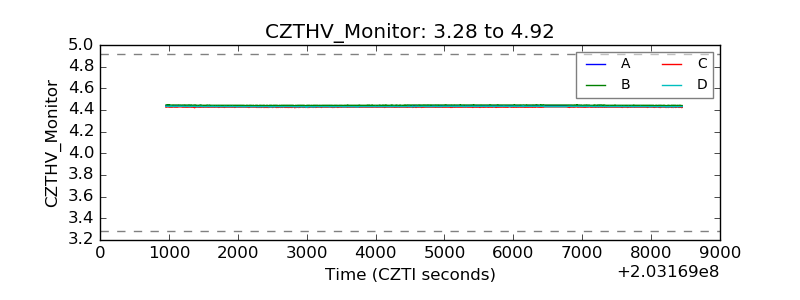 |
| D_VDD | 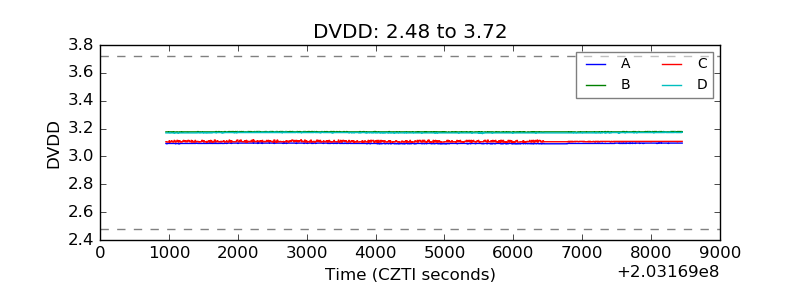 |
| Temperature 1 | 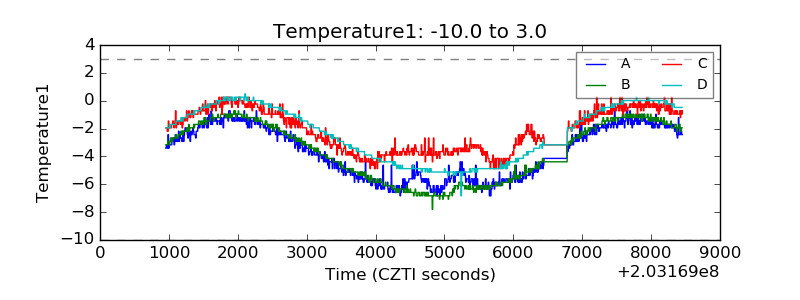 |
| Veto HV Monitor | 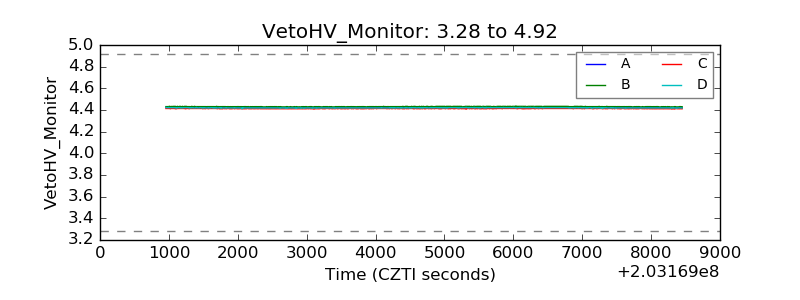 |
| Veto LLD | 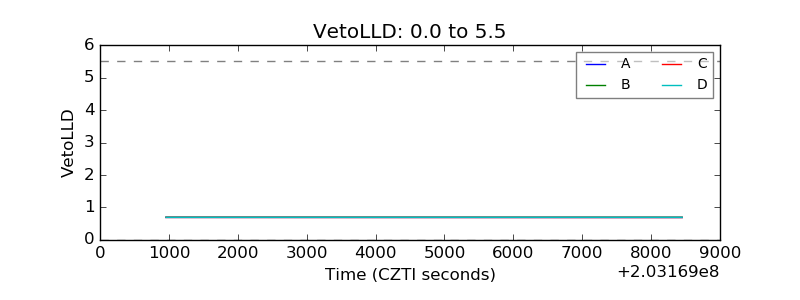 |
| Alpha Counter | 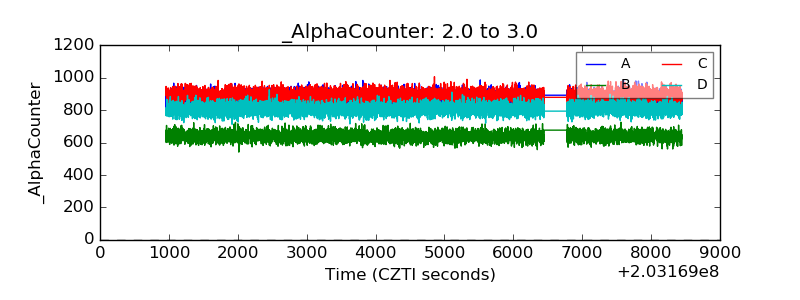 |
| _CPM_Rate | 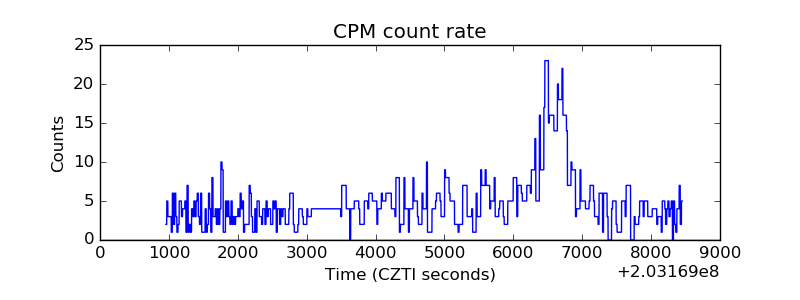 |
| CZT Counter | 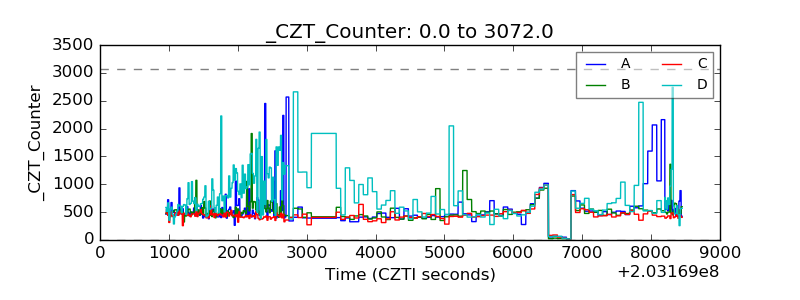 |
| +2.5 Volts monitor |  |
| +5 Volts monitor |  |
| Veto Counter | 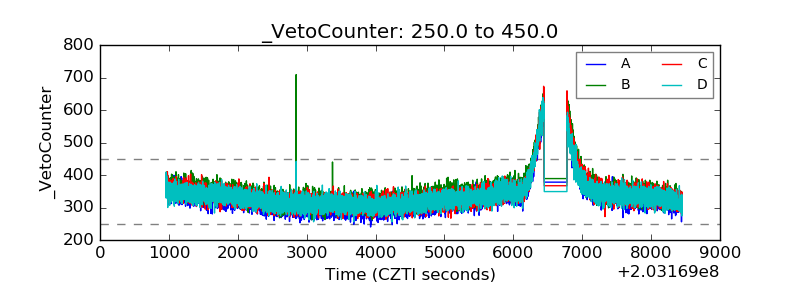 |