| Param | Original file | Final file |
|---|---|---|
| Filename | modeM0/AS1G05_248T01_9000000486_03782cztM0_level2.evt | modeM0/AS1G05_248T01_9000000486_03782cztM0_level2_quad_clean.evt |
| Size (bytes) | 530,193,600 | 82,932,480 |
| Size | 505.6 MB | 79.1 MB |
| Events in quadrant A | 4,258,803 | 506,709 |
| Events in quadrant B | 3,748,326 | 516,474 |
| Events in quadrant C | 3,411,714 | 505,617 |
| Events in quadrant D | 4,157,054 | 488,481 |
| Mode SS | |||
|---|---|---|---|
| Quadrant | BADHDUFLAG | Total packets | Discarded packets |
| A | 0 | 144 | 0 |
| B | 0 | 144 | 0 |
| C | 0 | 144 | 0 |
| D | 0 | 144 | 0 |
| Mode M0 | |||
|---|---|---|---|
| Quadrant | BADHDUFLAG | Total packets | Discarded packets |
| A | 0 | 17488 | 3 |
| B | 0 | 15754 | 2 |
| C | 0 | 15102 | 2 |
| D | 0 | 17110 | 2 |
| Quadrant | Total seconds | Saturated seconds | Saturation percentage |
|---|---|---|---|
| A | 7082 | 245 | 3.459475% |
| B | 7082 | 80 | 1.129624% |
| C | 7082 | 83 | 1.171985% |
| D | 7082 | 171 | 2.414572% |
Noise dominated data is calculated using 1-second bins in cleaned event files. If a bin has >2000 counts, and if more than 50% of those come from <1% of pixels, then it is considered to be noise-dominated and hence unusable.
| Quadrant | # 1 sec bins | Bins with >0 counts | Bins with >2000 counts | High rate bins dominated by noise | Noise dominated (total time) | Noise dominated (detector-on time) | Marked lightcurve |
|---|---|---|---|---|---|---|---|
| A | 7197 | 7084 | 145 | 145 | 2.01% | 2.05% | 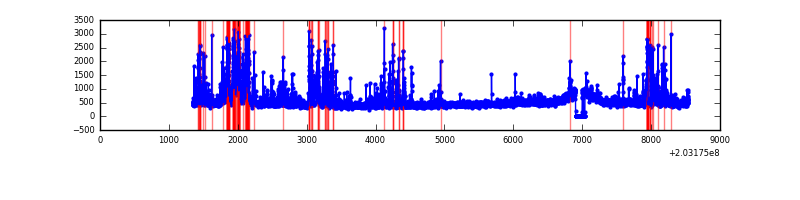 |
| B | 7197 | 7084 | 6 | 6 | 0.08% | 0.08% | 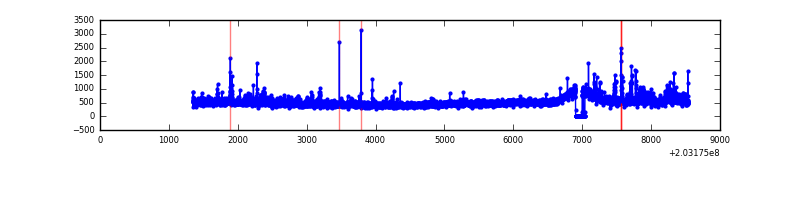 |
| C | 7197 | 7084 | 36 | 36 | 0.50% | 0.51% | 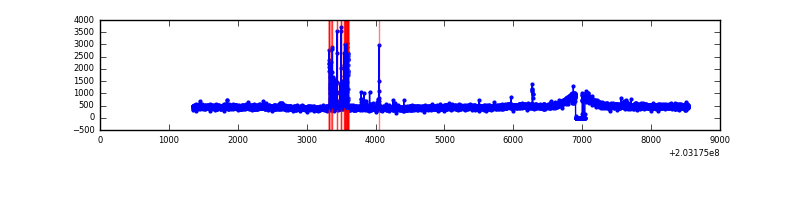 |
| D | 7197 | 7084 | 82 | 82 | 1.14% | 1.16% | 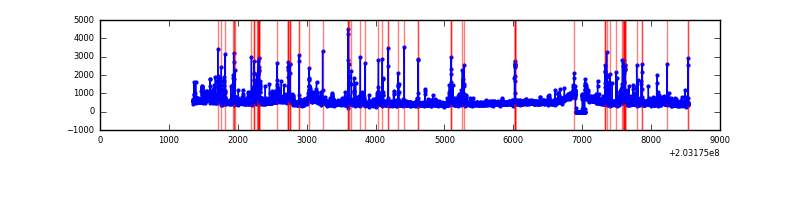 |
Top three noisy pixels from each quadrant. If the there are fewer than three noisy pixels in the level2.evt file, extra rows are filled as -1
| Pixel properties | Quadrant properties | ||||||
|---|---|---|---|---|---|---|---|
| Quadrant | DetID | PixID | Counts | Sigma | Mean | Median | Sigma |
| A | 0 | 118 | 723641 | 4287.38 | 818 | 797 | 168.6 |
| A | 13 | 251 | 135974 | 801.77 | 818 | 797 | 168.6 |
| A | 0 | 50 | 91450 | 537.69 | 818 | 797 | 168.6 |
| B | 15 | 204 | 355434 | 2178.57 | 833 | 813 | 162.8 |
| B | 5 | 200 | 54428 | 329.37 | 833 | 813 | 162.8 |
| B | 4 | 81 | 39219 | 235.94 | 833 | 813 | 162.8 |
| C | 14 | 234 | 168887 | 898.36 | 798 | 802 | 187.1 |
| C | 2 | 53 | 107381 | 569.63 | 798 | 802 | 187.1 |
| C | 1 | 16 | 7961 | 38.26 | 798 | 802 | 187.1 |
| D | 13 | 137 | 383051 | 1968.18 | 798 | 775 | 194.2 |
| D | 8 | 112 | 193523 | 992.38 | 798 | 775 | 194.2 |
| D | 1 | 20 | 121735 | 622.77 | 798 | 775 | 194.2 |
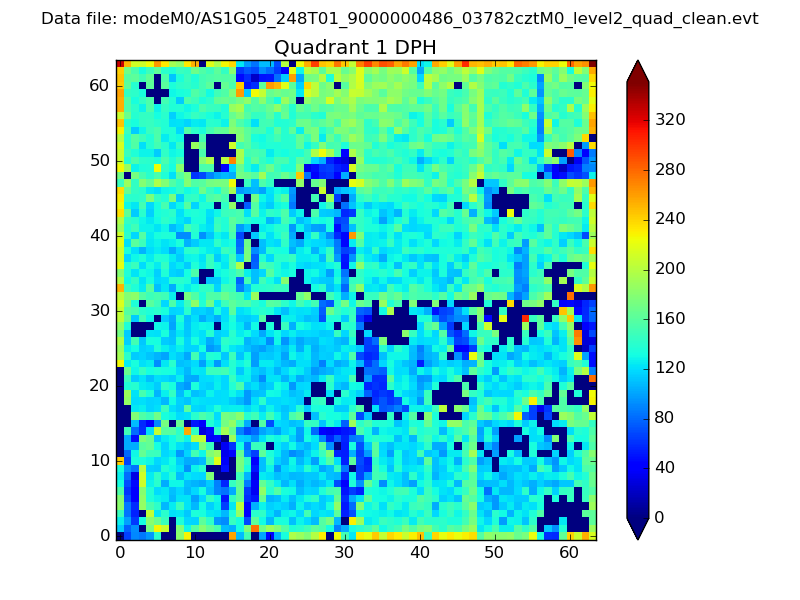
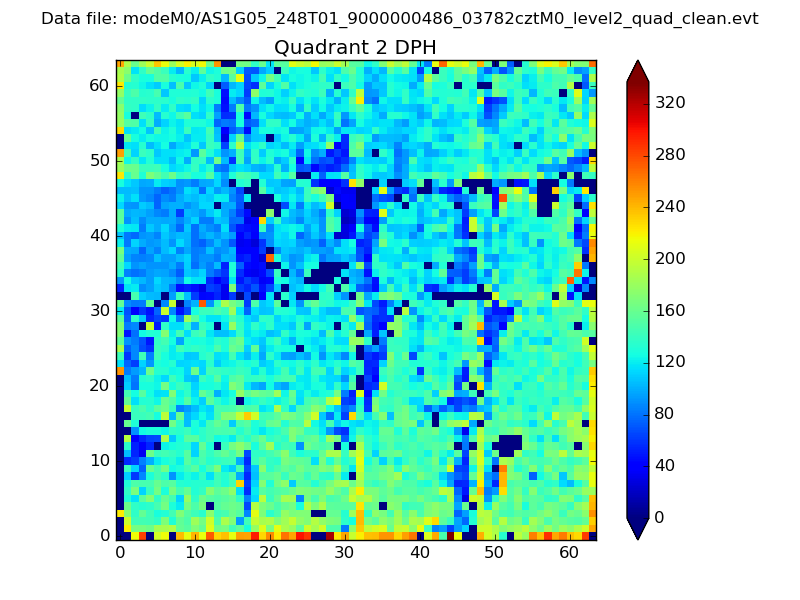
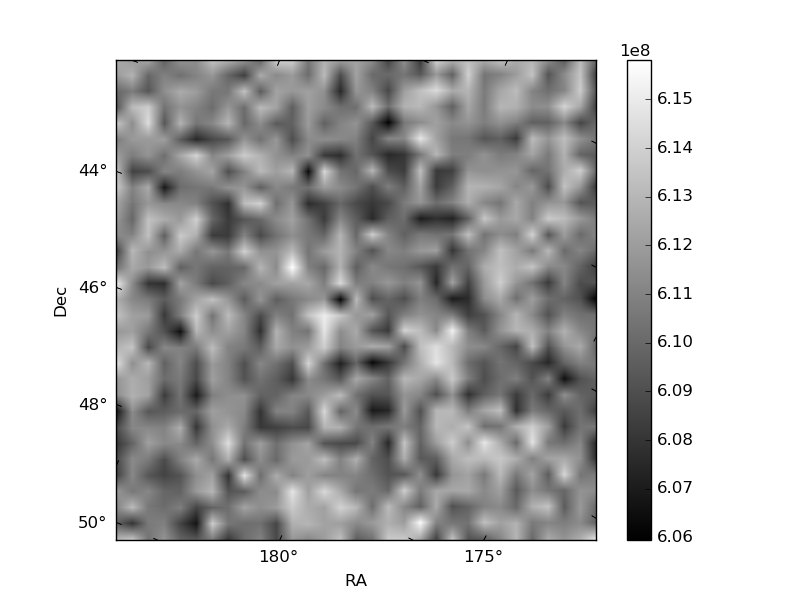
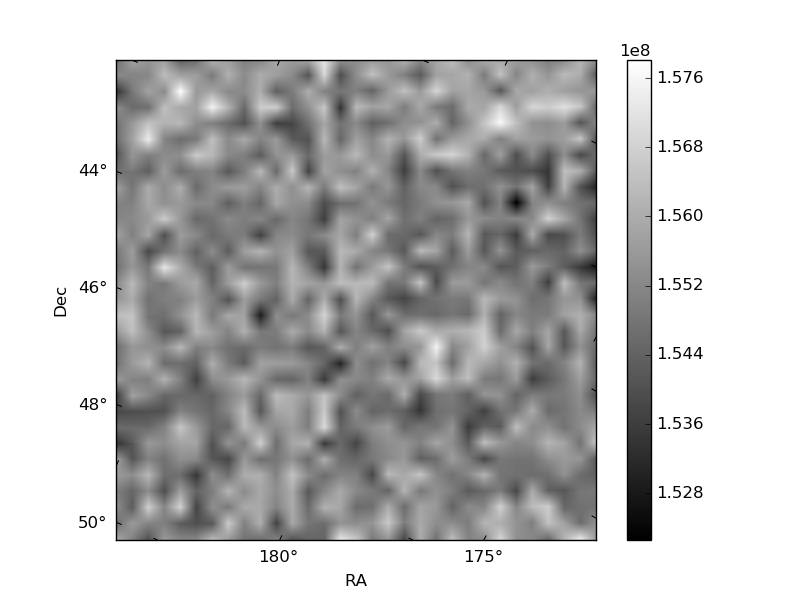
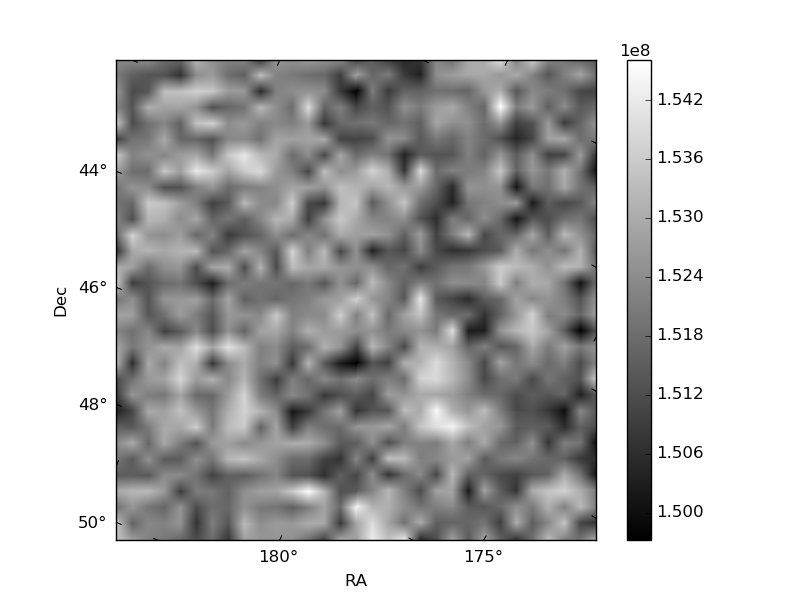
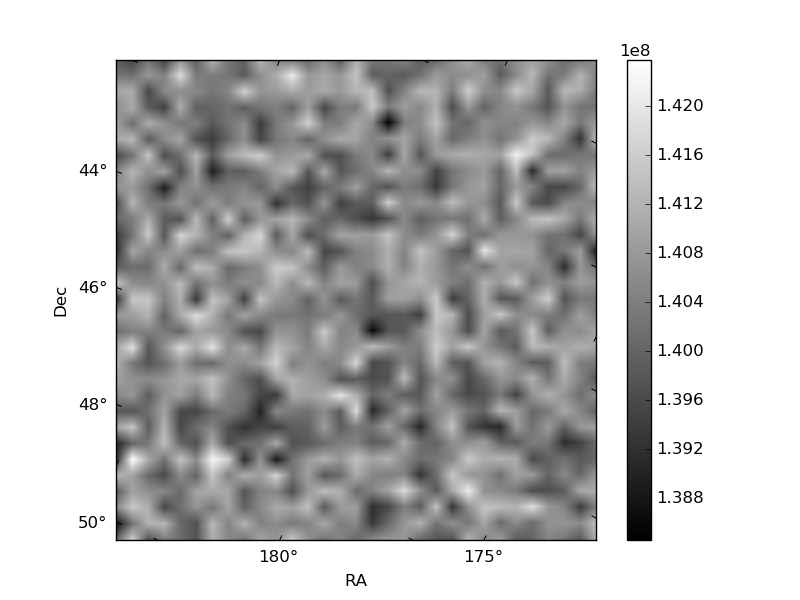
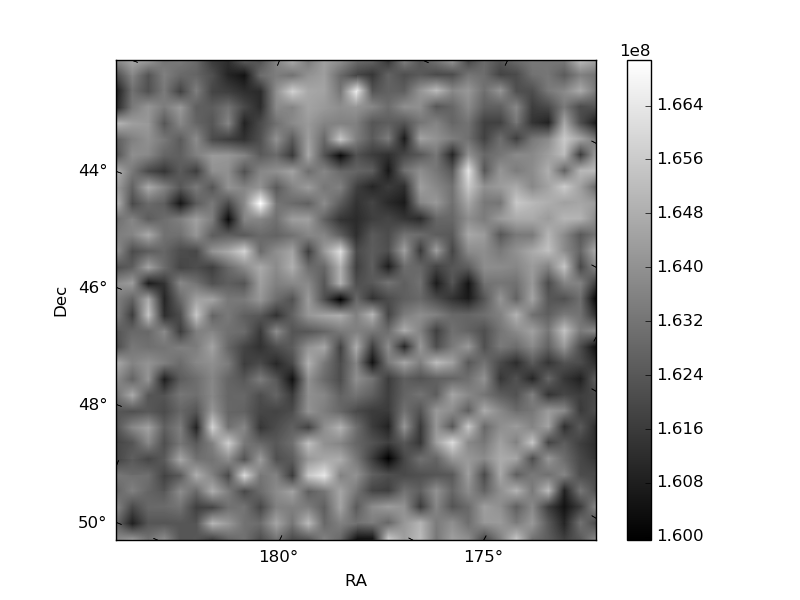
Histogram calculated using DETX and DETY for each event in the final _common_clean file
| Quadrant A |  |
 |
Quadrant B |
|---|---|---|---|
| Quadrant D | 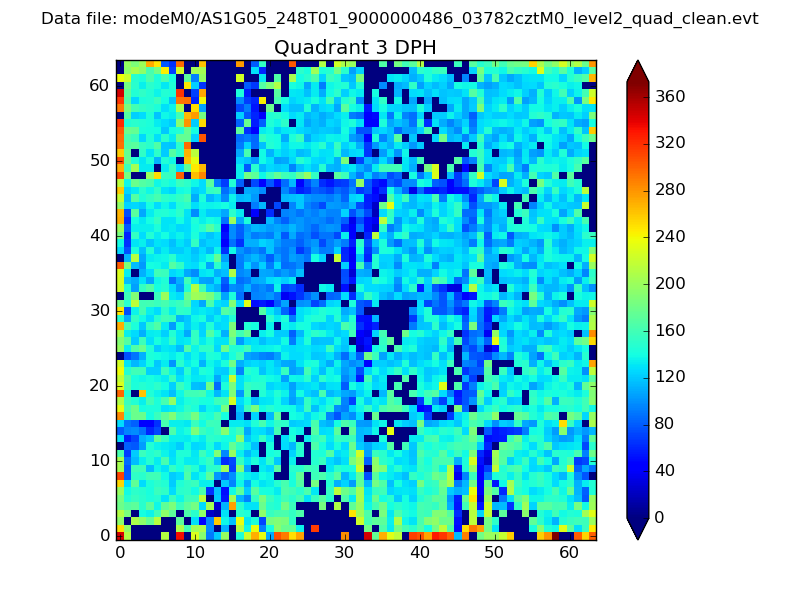 |
 |
Quadrant C |
| Plot type | Count rate plots | Images |
|---|---|---|
| Comparison with Poisson distribution Blue bars denote a histogram of data divided into 1 sec bins. Red curve is a Poisson curve with rate = median count rate of data. |
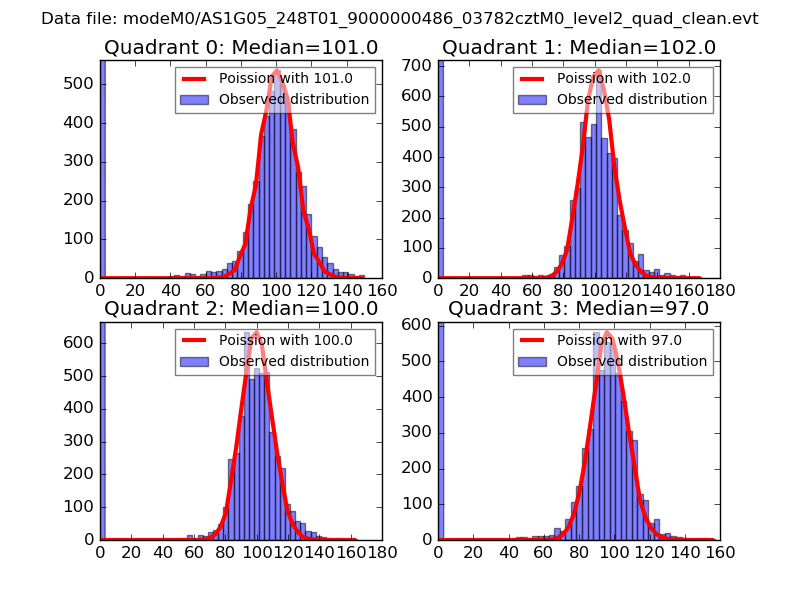 |
 |
| Quadrant-wise count rates Data is divided into 100 sec bins |
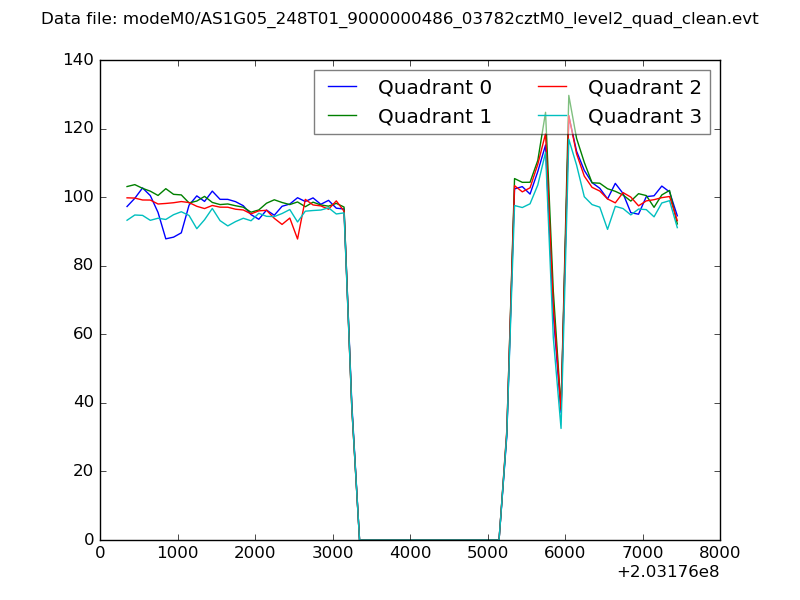 |
|
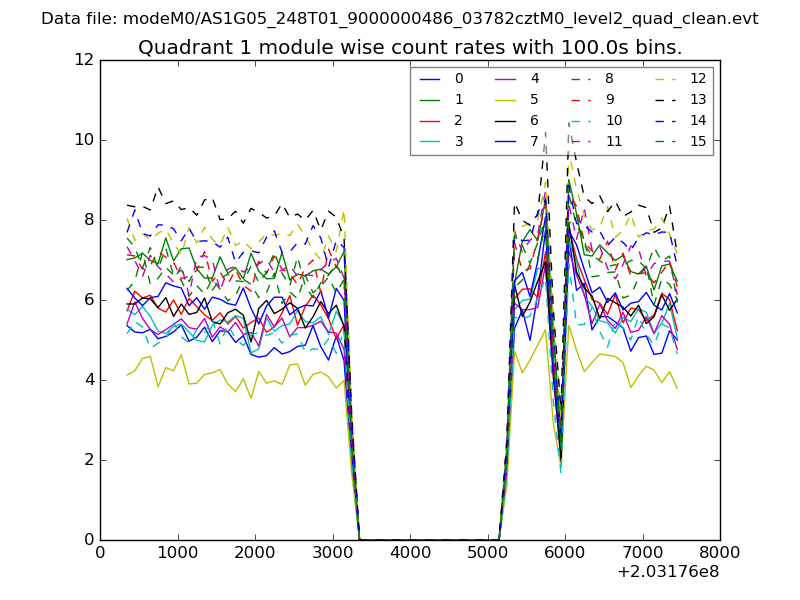
| Module-wise count rates for Quadrant A Data is divided into 100 sec bins |
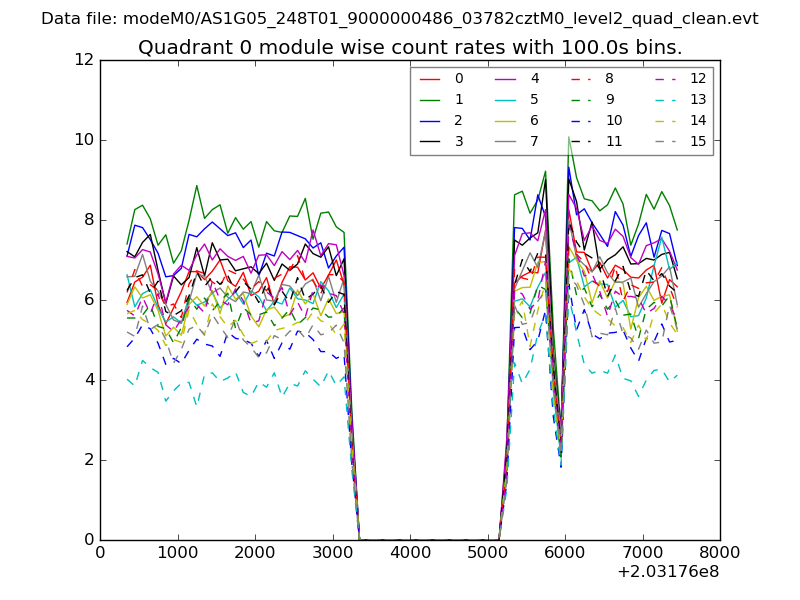 |
 |
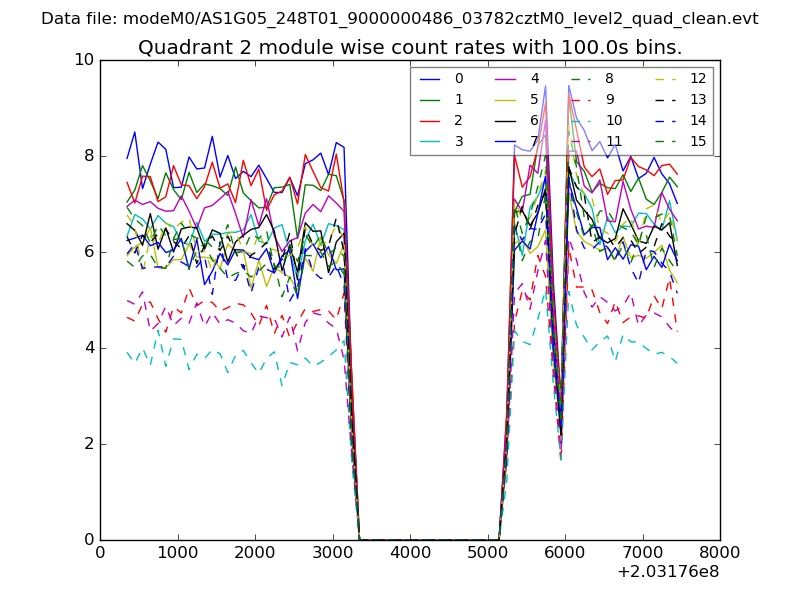
| Module-wise count rates for Quadrant B Data is divided into 100 sec bins |
 |
 |
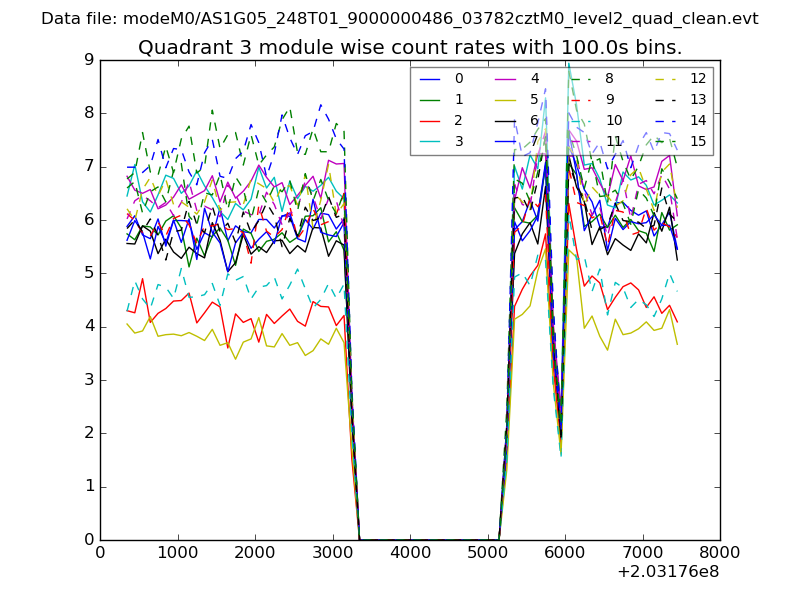
| Module-wise count rates for Quadrant C Data is divided into 100 sec bins |
 |
 |
| Module-wise count rates for Quadrant D Data is divided into 100 sec bins |
 |
 |
| Parameter | Plot |
|---|---|
| CZT HV Monitor | 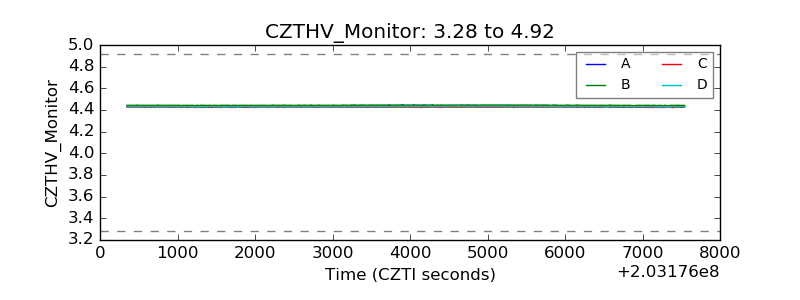 |
| D_VDD | 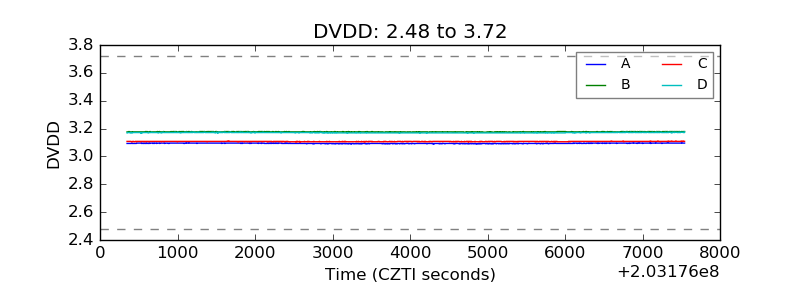 |
| Temperature 1 | 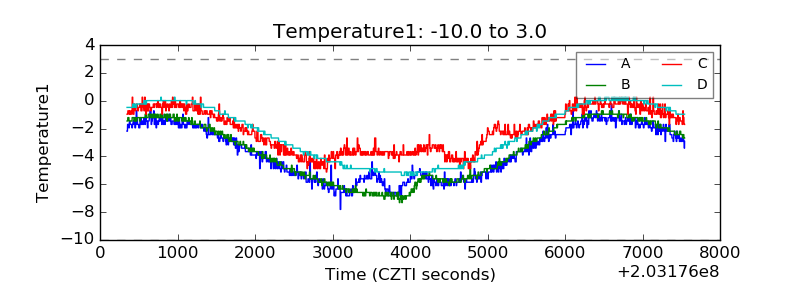 |
| Veto HV Monitor | 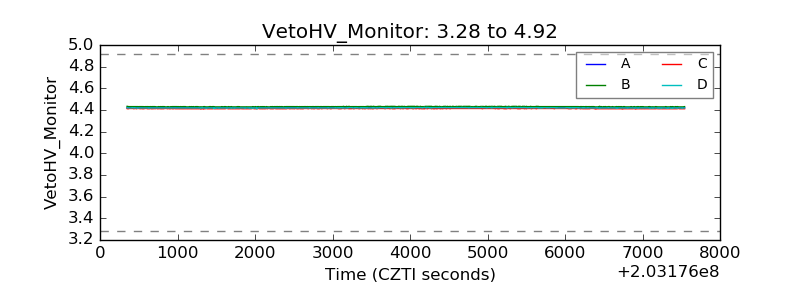 |
| Veto LLD | 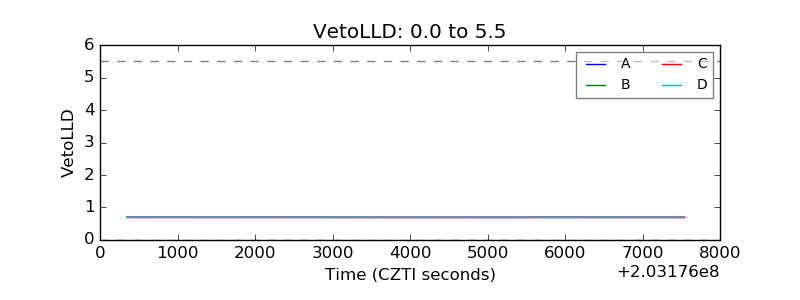 |
| Alpha Counter | 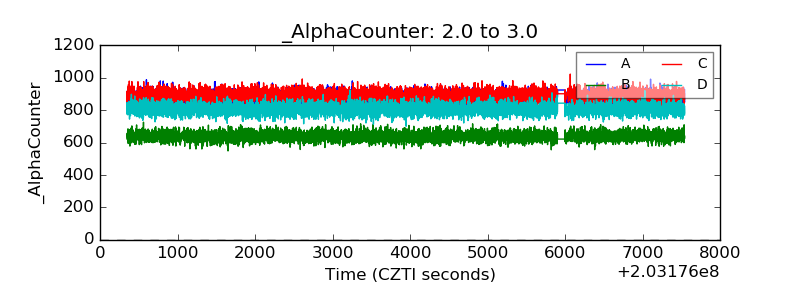 |
| _CPM_Rate | 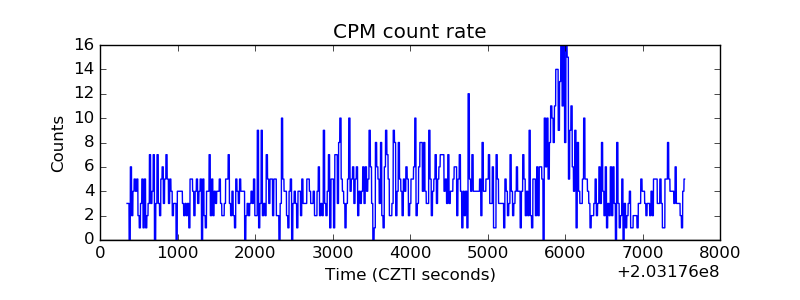 |
| CZT Counter | 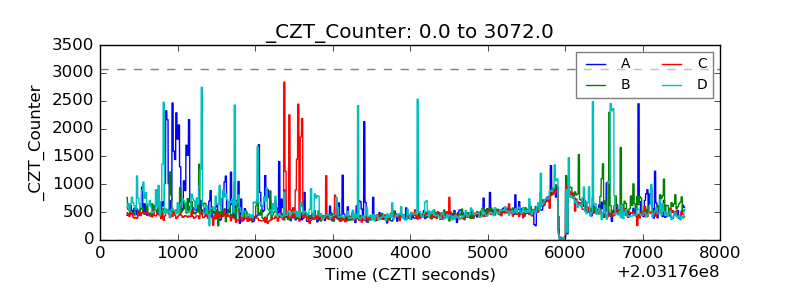 |
| +2.5 Volts monitor |  |
| +5 Volts monitor | 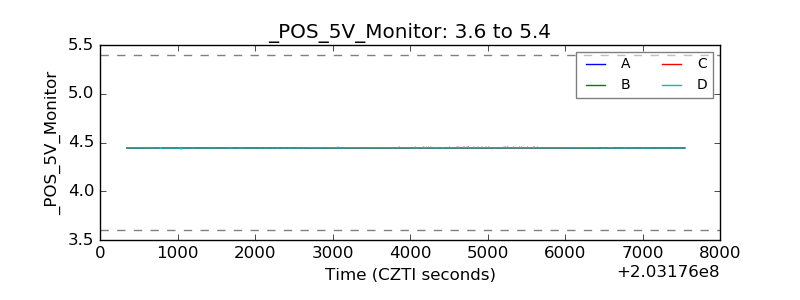 |
| Veto Counter | 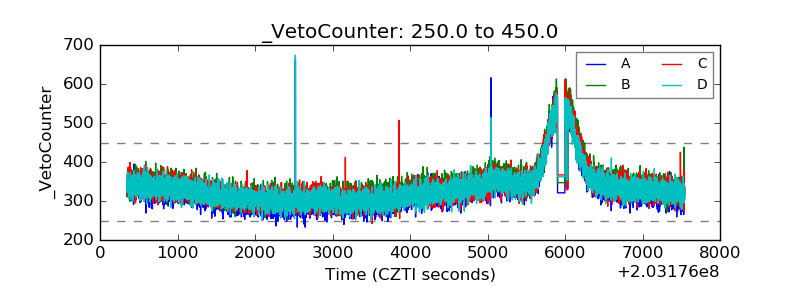 |