| Param | Original file | Final file |
|---|---|---|
| Filename | modeM0/AS1G05_248T01_9000000486_03783cztM0_level2.evt | modeM0/AS1G05_248T01_9000000486_03783cztM0_level2_quad_clean.evt |
| Size (bytes) | 554,420,160 | 93,441,600 |
| Size | 528.7 MB | 89.1 MB |
| Events in quadrant A | 4,080,349 | 581,128 |
| Events in quadrant B | 4,242,502 | 583,799 |
| Events in quadrant C | 4,155,613 | 565,517 |
| Events in quadrant D | 3,787,150 | 561,134 |
| Mode SS | |||
|---|---|---|---|
| Quadrant | BADHDUFLAG | Total packets | Discarded packets |
| A | 0 | 158 | 0 |
| B | 0 | 158 | 0 |
| C | 0 | 158 | 0 |
| D | 0 | 158 | 0 |
| Mode M9 | |||
|---|---|---|---|
| Quadrant | BADHDUFLAG | Total packets | Discarded packets |
| A | 0 | 2 | 0 |
| B | 0 | 2 | 0 |
| C | 0 | 2 | 0 |
| D | 0 | 2 | 0 |
| Mode M0 | |||
|---|---|---|---|
| Quadrant | BADHDUFLAG | Total packets | Discarded packets |
| A | 0 | 17498 | 3 |
| B | 0 | 17840 | 2 |
| C | 0 | 17726 | 2 |
| D | 0 | 16883 | 2 |
| Quadrant | Total seconds | Saturated seconds | Saturation percentage |
|---|---|---|---|
| A | 7732 | 164 | 2.121055% |
| B | 7732 | 106 | 1.370926% |
| C | 7732 | 252 | 3.259183% |
| D | 7732 | 96 | 1.241593% |
Noise dominated data is calculated using 1-second bins in cleaned event files. If a bin has >2000 counts, and if more than 50% of those come from <1% of pixels, then it is considered to be noise-dominated and hence unusable.
| Quadrant | # 1 sec bins | Bins with >0 counts | Bins with >2000 counts | High rate bins dominated by noise | Noise dominated (total time) | Noise dominated (detector-on time) | Marked lightcurve |
|---|---|---|---|---|---|---|---|
| A | 8037 | 7734 | 46 | 46 | 0.57% | 0.59% | 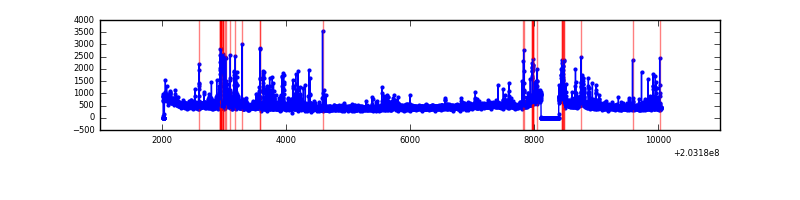 |
| B | 8037 | 7734 | 12 | 12 | 0.15% | 0.16% | 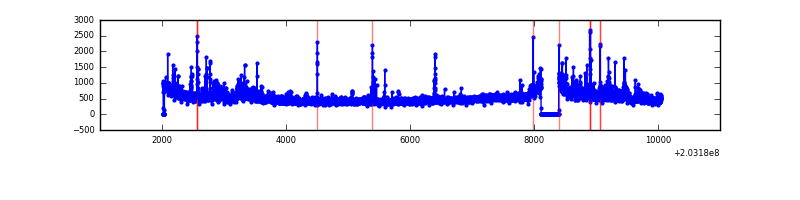 |
| C | 8037 | 7734 | 212 | 212 | 2.64% | 2.74% | 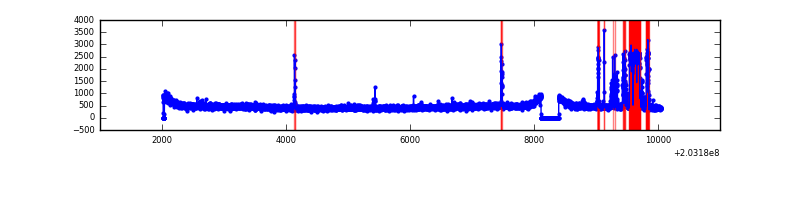 |
| D | 8037 | 7734 | 44 | 44 | 0.55% | 0.57% | 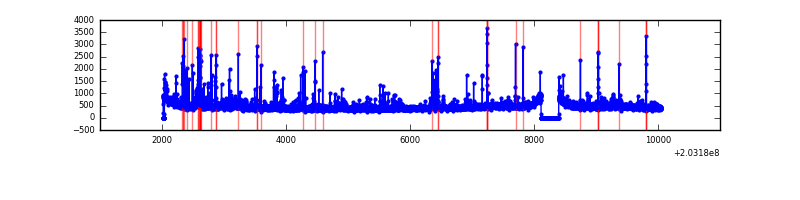 |
Top three noisy pixels from each quadrant. If the there are fewer than three noisy pixels in the level2.evt file, extra rows are filled as -1
| Pixel properties | Quadrant properties | ||||||
|---|---|---|---|---|---|---|---|
| Quadrant | DetID | PixID | Counts | Sigma | Mean | Median | Sigma |
| A | 0 | 118 | 265617 | 1432.03 | 893 | 871 | 184.9 |
| A | 13 | 251 | 171909 | 925.16 | 893 | 871 | 184.9 |
| A | 0 | 50 | 59982 | 319.74 | 893 | 871 | 184.9 |
| B | 15 | 204 | 531647 | 3012.48 | 907 | 888 | 176.2 |
| B | 5 | 200 | 67061 | 375.58 | 907 | 888 | 176.2 |
| B | 4 | 81 | 56523 | 315.77 | 907 | 888 | 176.2 |
| C | 2 | 53 | 734439 | 3647.06 | 861 | 862 | 201.1 |
| C | 1 | 16 | 49642 | 242.52 | 861 | 862 | 201.1 |
| C | 13 | 61 | 7338 | 32.2 | 861 | 862 | 201.1 |
| D | 8 | 112 | 131855 | 612.49 | 874 | 848 | 213.9 |
| D | 1 | 84 | 74650 | 345.04 | 874 | 848 | 213.9 |
| D | 2 | 14 | 58740 | 270.66 | 874 | 848 | 213.9 |
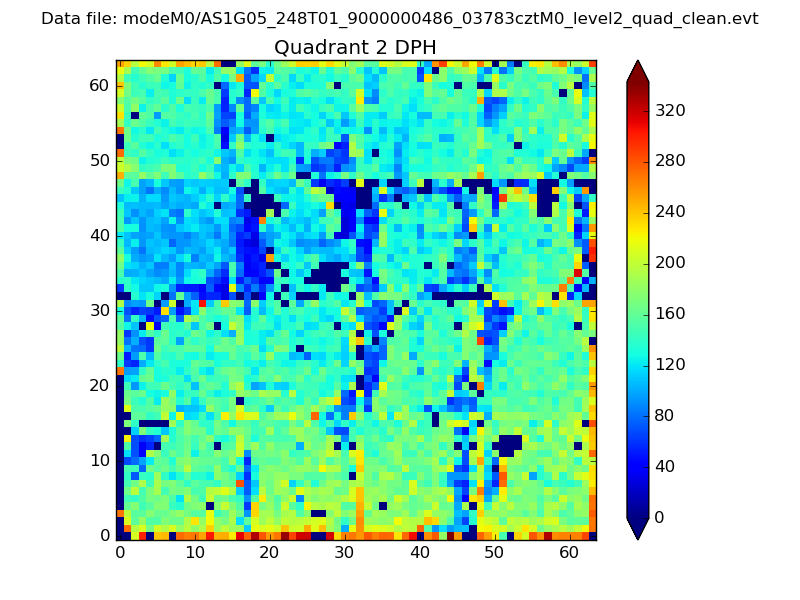
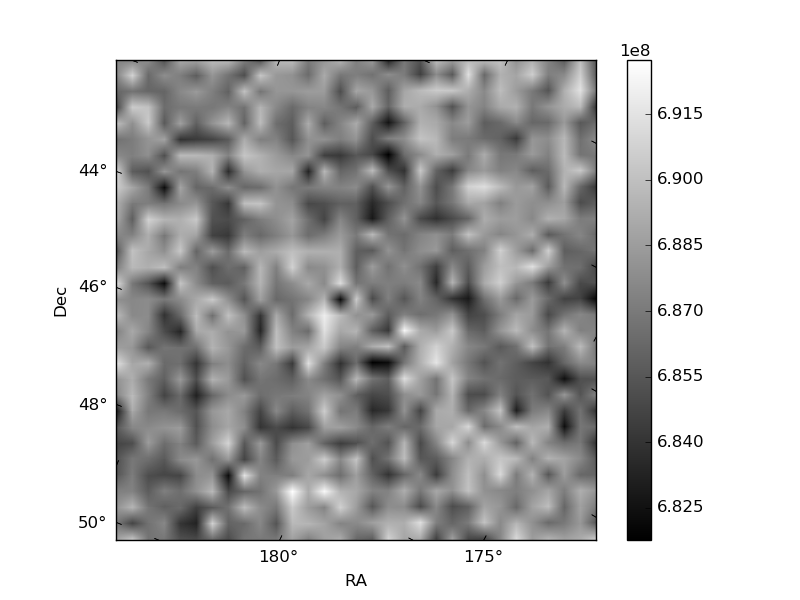
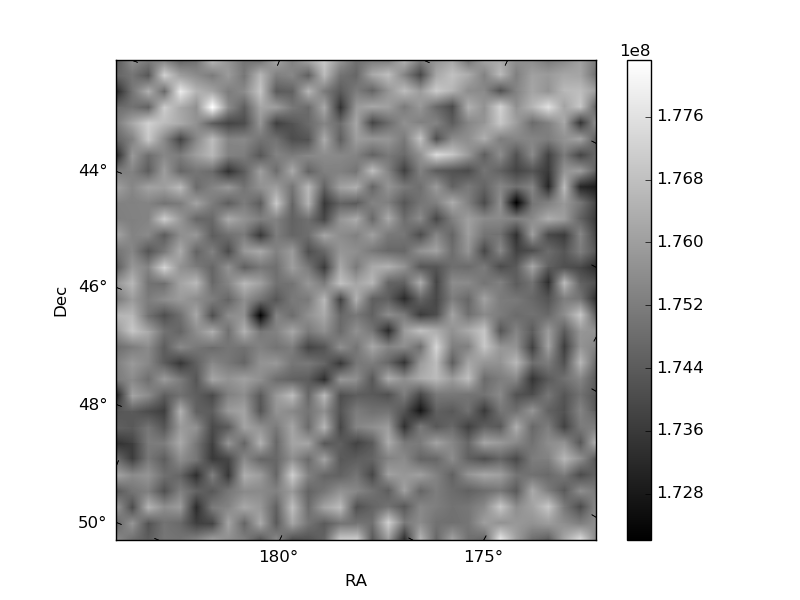
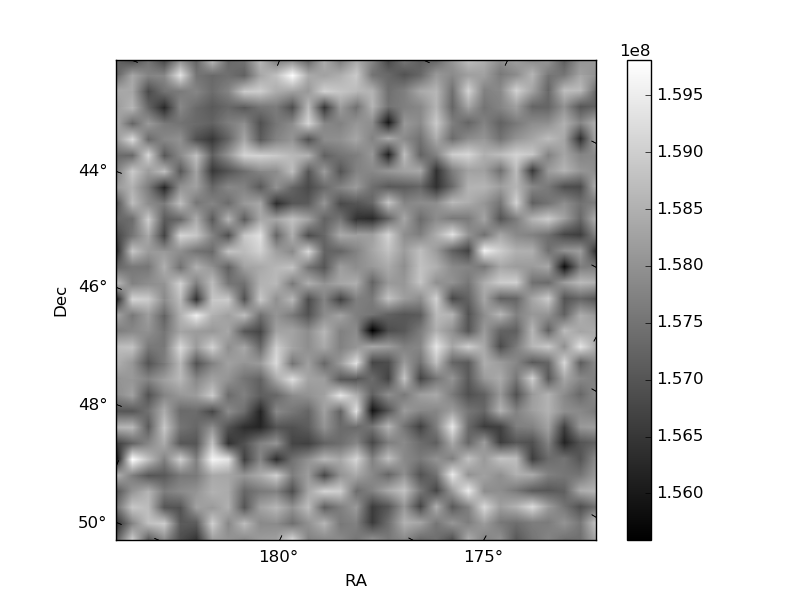
Histogram calculated using DETX and DETY for each event in the final _common_clean file
| Quadrant A | 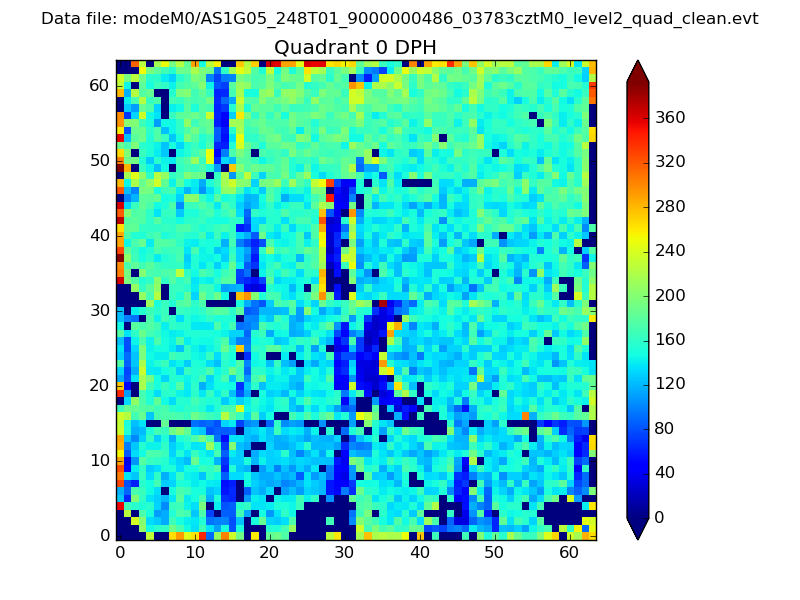 |
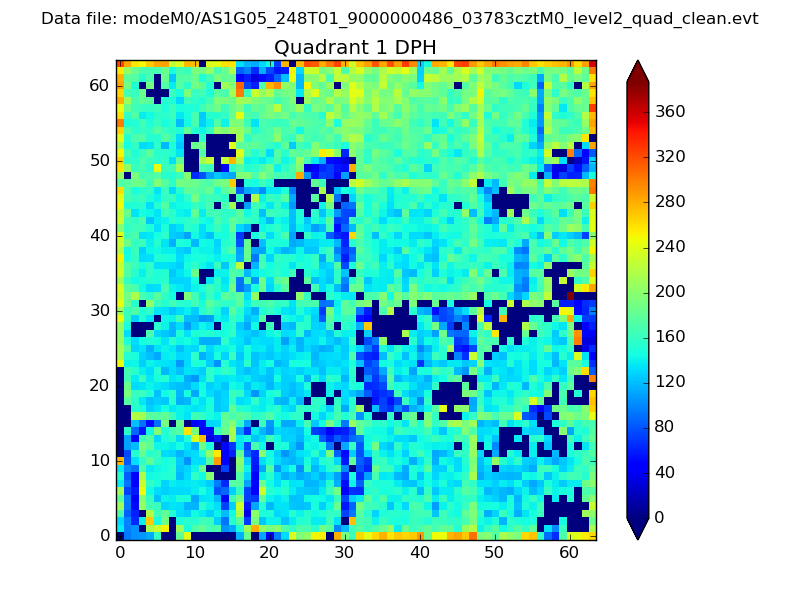 |
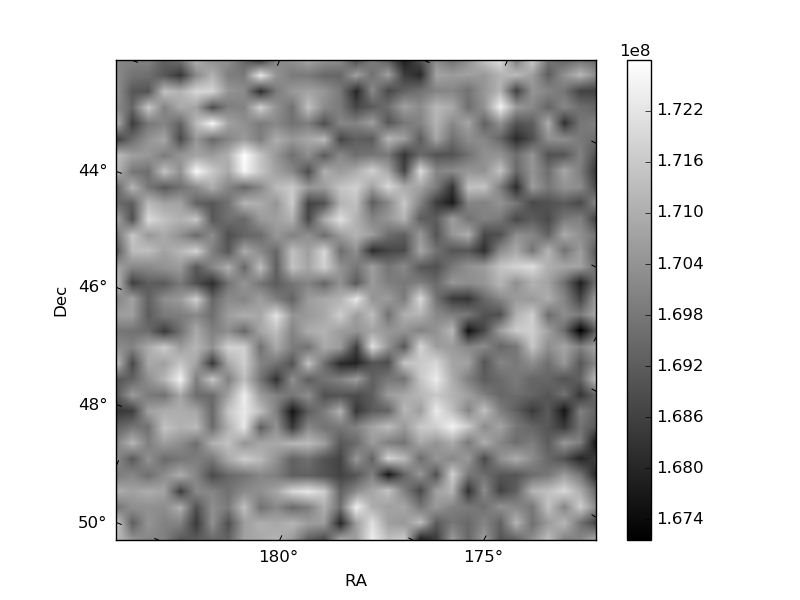
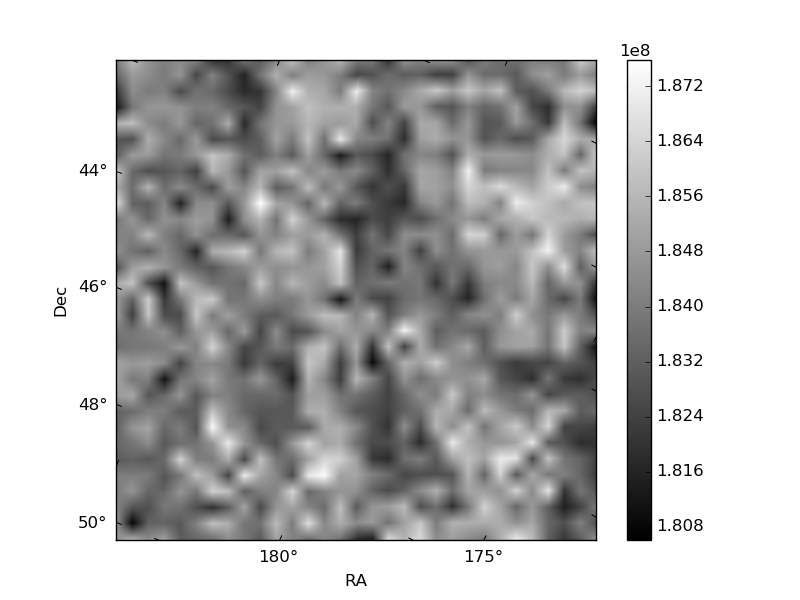
Quadrant B |
|---|---|---|---|
| Quadrant D | 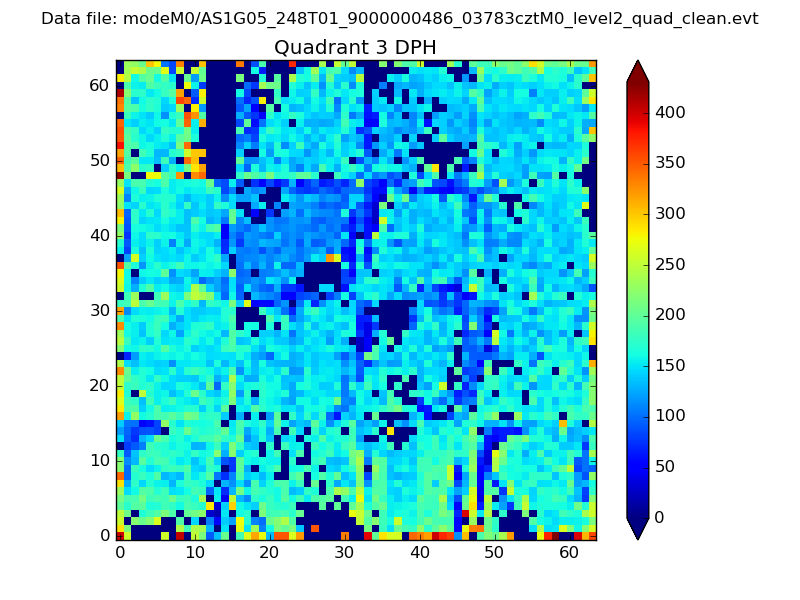 |
 |
Quadrant C |
| Plot type | Count rate plots | Images |
|---|---|---|
| Comparison with Poisson distribution Blue bars denote a histogram of data divided into 1 sec bins. Red curve is a Poisson curve with rate = median count rate of data. |
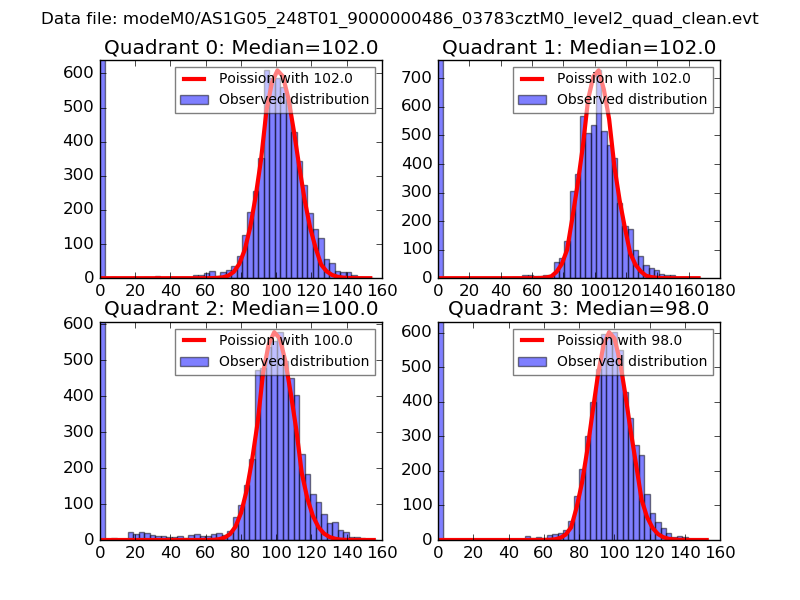 |
 |
| Quadrant-wise count rates Data is divided into 100 sec bins |
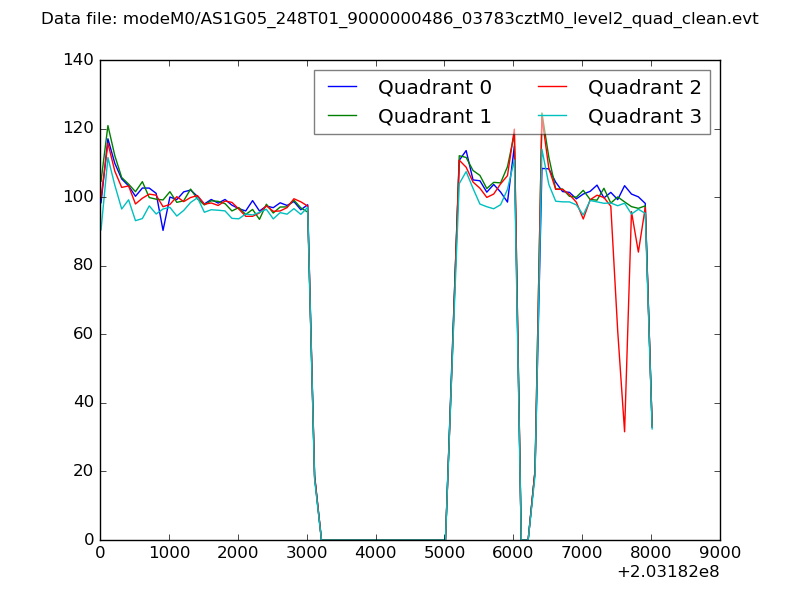 |
|
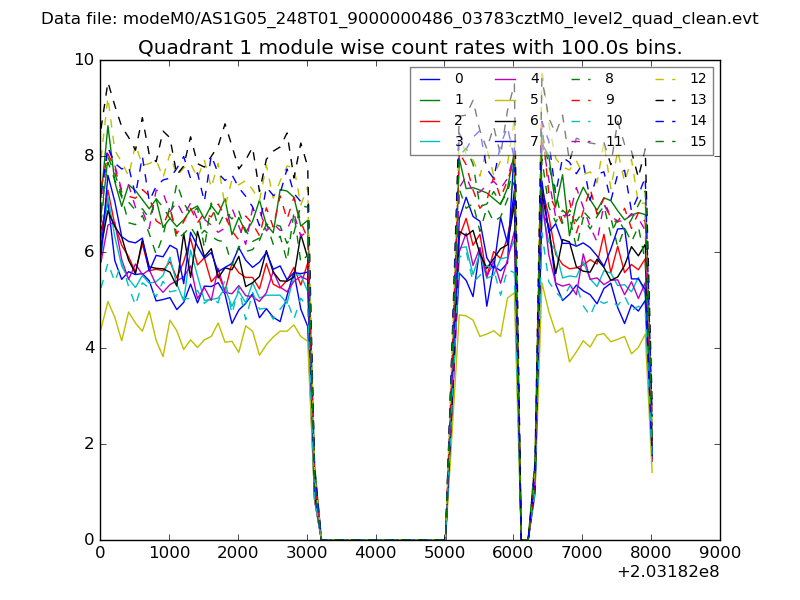
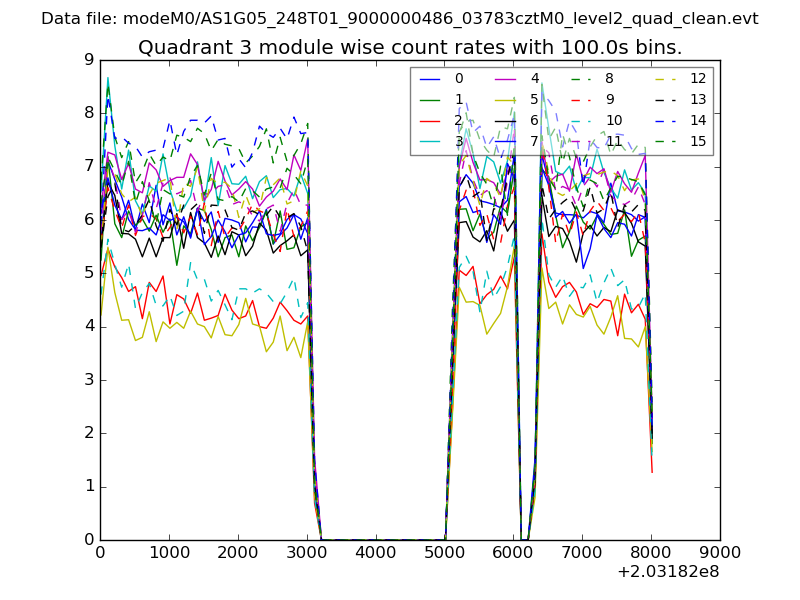
| Module-wise count rates for Quadrant A Data is divided into 100 sec bins |
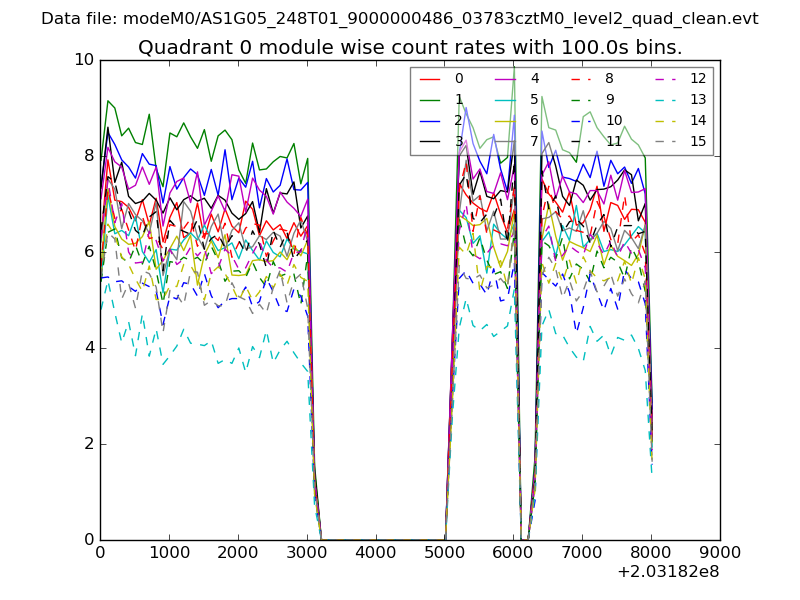 |
 |
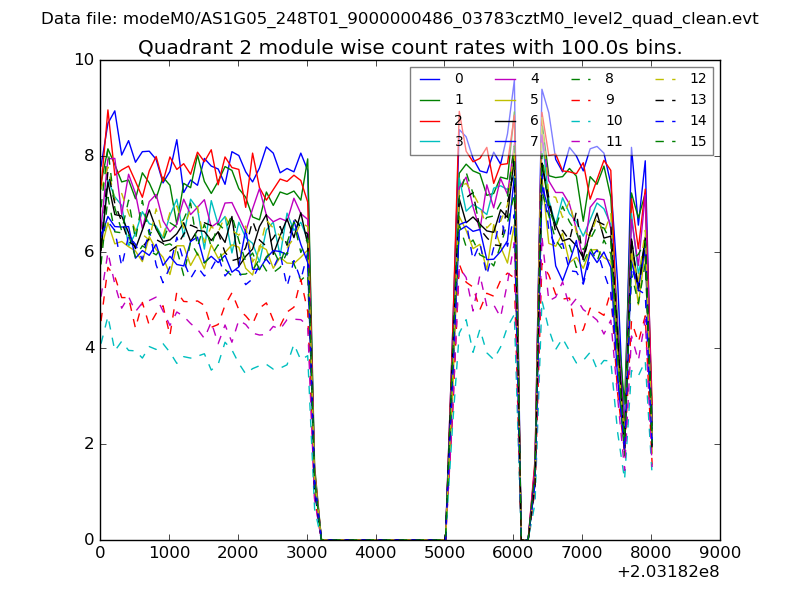
| Module-wise count rates for Quadrant B Data is divided into 100 sec bins |
 |
 |
| Module-wise count rates for Quadrant C Data is divided into 100 sec bins |
 |
 |
| Module-wise count rates for Quadrant D Data is divided into 100 sec bins |
 |
 |
| Parameter | Plot |
|---|---|
| CZT HV Monitor | 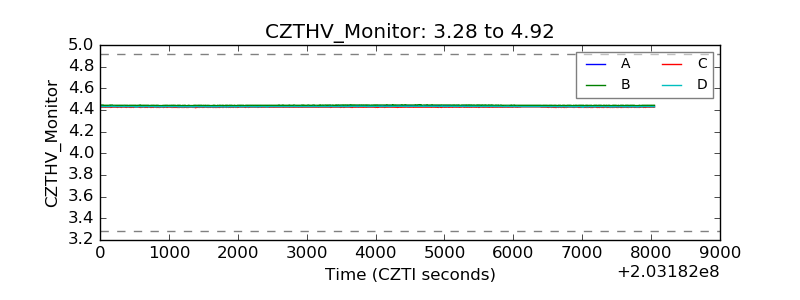 |
| D_VDD | 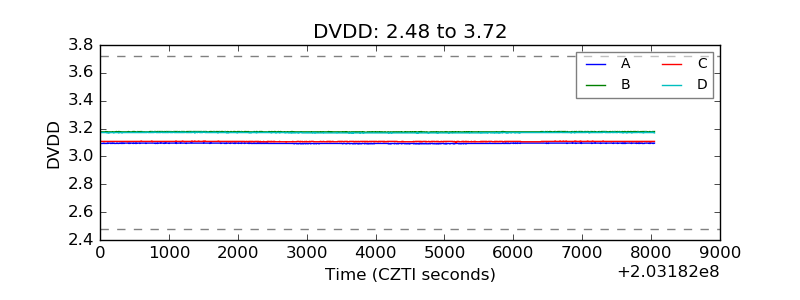 |
| Temperature 1 | 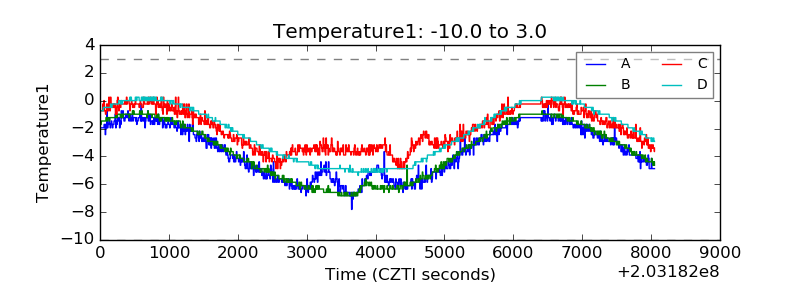 |
| Veto HV Monitor | 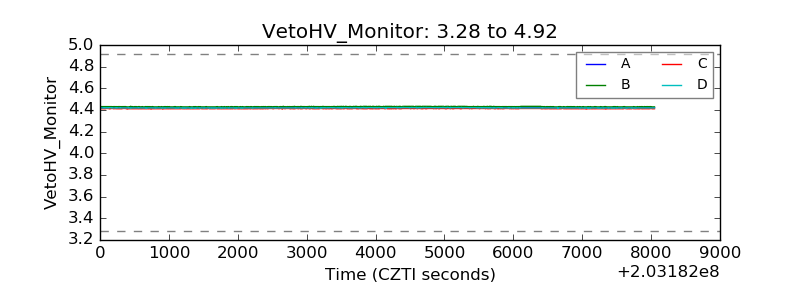 |
| Veto LLD | 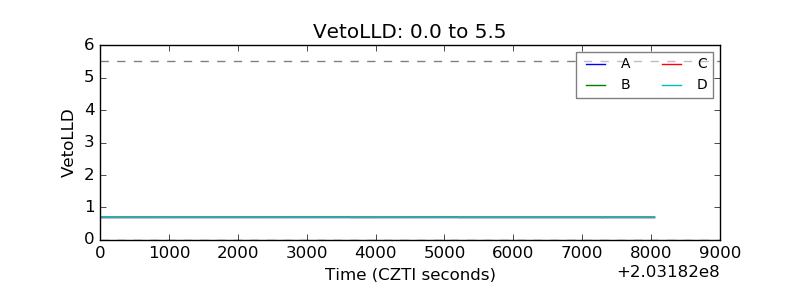 |
| Alpha Counter | 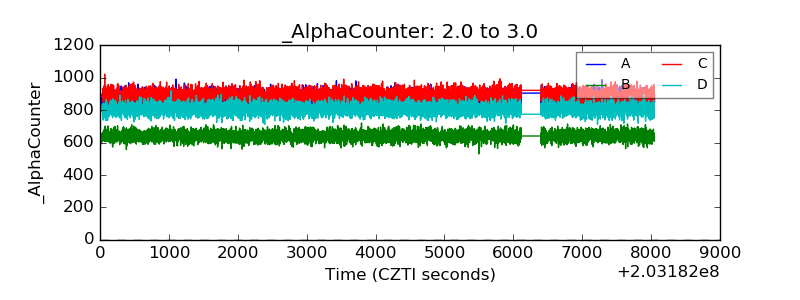 |
| _CPM_Rate | 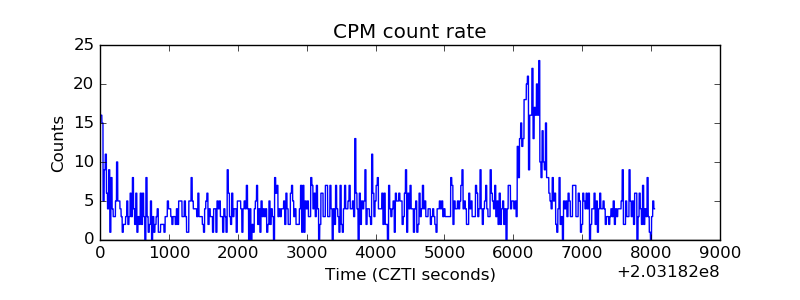 |
| CZT Counter | 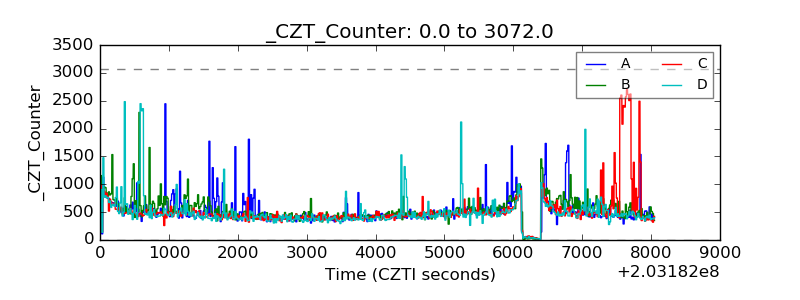 |
| +2.5 Volts monitor | 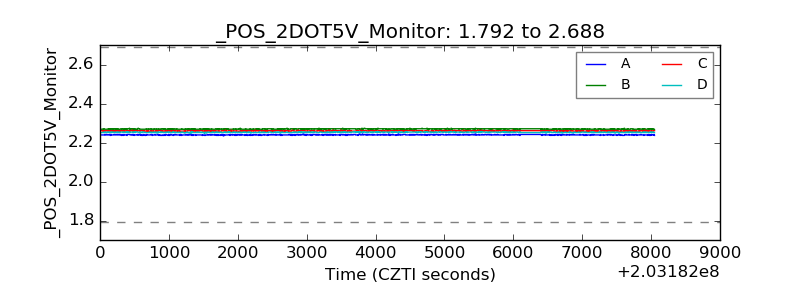 |
| +5 Volts monitor |  |
| Veto Counter | 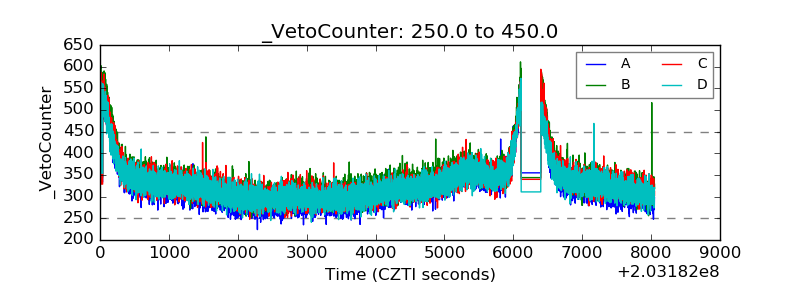 |