| Param | Original file | Final file |
|---|---|---|
| Filename | modeM0/AS1G05_248T01_9000000486_03786cztM0_level2.evt | modeM0/AS1G05_248T01_9000000486_03786cztM0_level2_quad_clean.evt |
| Size (bytes) | 905,379,840 | 138,464,640 |
| Size | 863.4 MB | 132.1 MB |
| Events in quadrant A | 6,910,067 | 849,419 |
| Events in quadrant B | 6,841,943 | 847,273 |
| Events in quadrant C | 6,323,088 | 826,436 |
| Events in quadrant D | 6,507,514 | 814,923 |
| Mode SS | |||
|---|---|---|---|
| Quadrant | BADHDUFLAG | Total packets | Discarded packets |
| A | 0 | 252 | 0 |
| B | 0 | 252 | 0 |
| C | 0 | 252 | 0 |
| D | 0 | 252 | 0 |
| Mode M9 | |||
|---|---|---|---|
| Quadrant | BADHDUFLAG | Total packets | Discarded packets |
| A | 0 | 12 | 0 |
| B | 0 | 12 | 0 |
| C | 0 | 12 | 0 |
| D | 0 | 12 | 0 |
| Mode M0 | |||
|---|---|---|---|
| Quadrant | BADHDUFLAG | Total packets | Discarded packets |
| A | 0 | 29202 | 2 |
| B | 0 | 28891 | 2 |
| C | 0 | 27584 | 2 |
| D | 0 | 28213 | 2 |
| Quadrant | Total seconds | Saturated seconds | Saturation percentage |
|---|---|---|---|
| A | 12366 | 288 | 2.328967% |
| B | 12366 | 119 | 0.962316% |
| C | 12366 | 308 | 2.490700% |
| D | 12366 | 190 | 1.536471% |
Noise dominated data is calculated using 1-second bins in cleaned event files. If a bin has >2000 counts, and if more than 50% of those come from <1% of pixels, then it is considered to be noise-dominated and hence unusable.
| Quadrant | # 1 sec bins | Bins with >0 counts | Bins with >2000 counts | High rate bins dominated by noise | Noise dominated (total time) | Noise dominated (detector-on time) | Marked lightcurve |
|---|---|---|---|---|---|---|---|
| A | 13566 | 12368 | 174 | 174 | 1.28% | 1.41% | 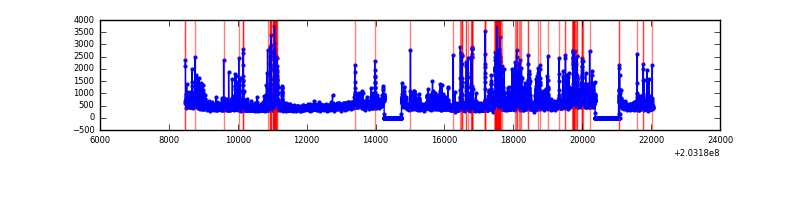 |
| B | 13566 | 12369 | 52 | 52 | 0.38% | 0.42% | 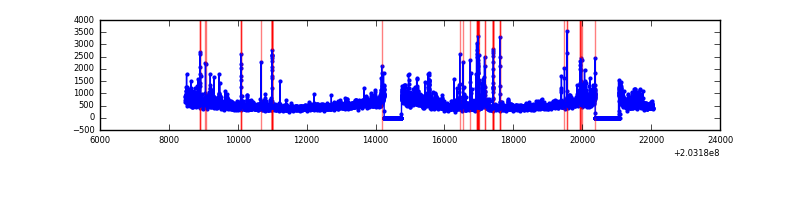 |
| C | 13566 | 12369 | 250 | 250 | 1.84% | 2.02% | 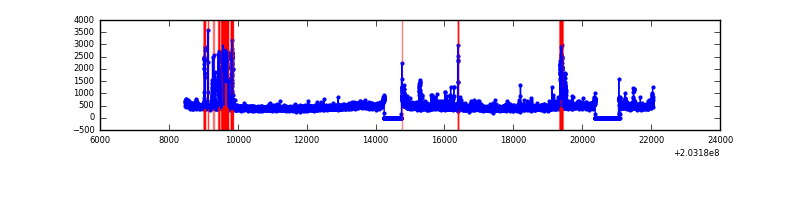 |
| D | 13566 | 12369 | 178 | 178 | 1.31% | 1.44% | 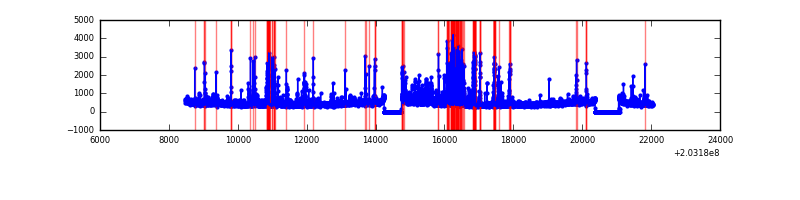 |
Top three noisy pixels from each quadrant. If the there are fewer than three noisy pixels in the level2.evt file, extra rows are filled as -1
| Pixel properties | Quadrant properties | ||||||
|---|---|---|---|---|---|---|---|
| Quadrant | DetID | PixID | Counts | Sigma | Mean | Median | Sigma |
| A | 13 | 251 | 812279 | 2864.31 | 1380 | 1346 | 283.1 |
| A | 0 | 50 | 440907 | 1552.58 | 1380 | 1346 | 283.1 |
| A | 0 | 118 | 250650 | 880.57 | 1380 | 1346 | 283.1 |
| B | 15 | 204 | 855256 | 3135.08 | 1410 | 1375 | 272.4 |
| B | 5 | 200 | 256157 | 935.45 | 1410 | 1375 | 272.4 |
| B | 4 | 81 | 79148 | 285.55 | 1410 | 1375 | 272.4 |
| C | 2 | 53 | 1001258 | 3187.27 | 1343 | 1346 | 313.7 |
| C | 1 | 16 | 47537 | 147.24 | 1343 | 1346 | 313.7 |
| C | 10 | 65 | 22430 | 67.21 | 1343 | 1346 | 313.7 |
| D | 8 | 112 | 480980 | 1465.19 | 1350 | 1308 | 327.4 |
| D | 1 | 84 | 164266 | 497.77 | 1350 | 1308 | 327.4 |
| D | 2 | 232 | 136989 | 414.45 | 1350 | 1308 | 327.4 |
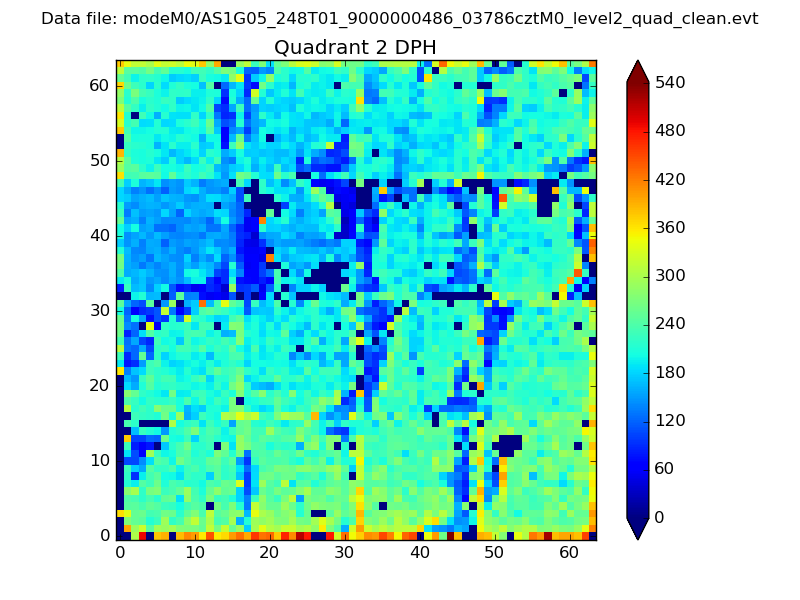
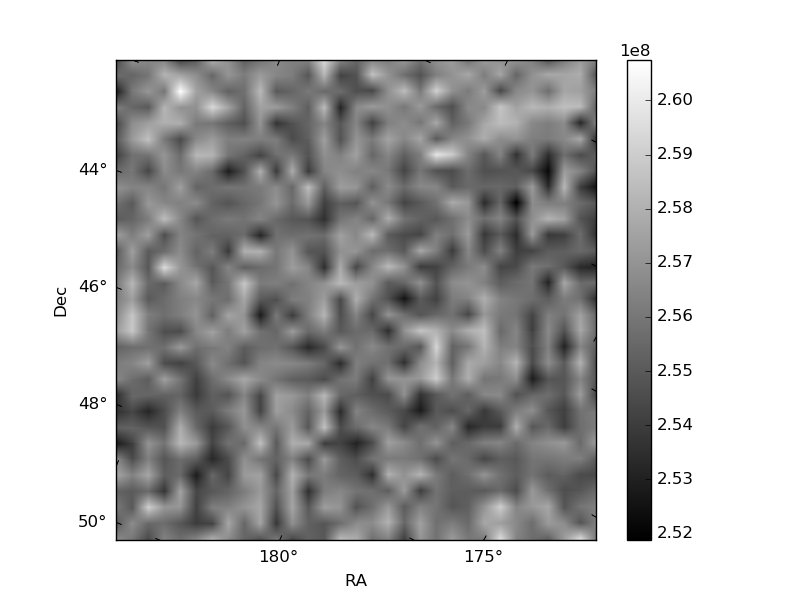
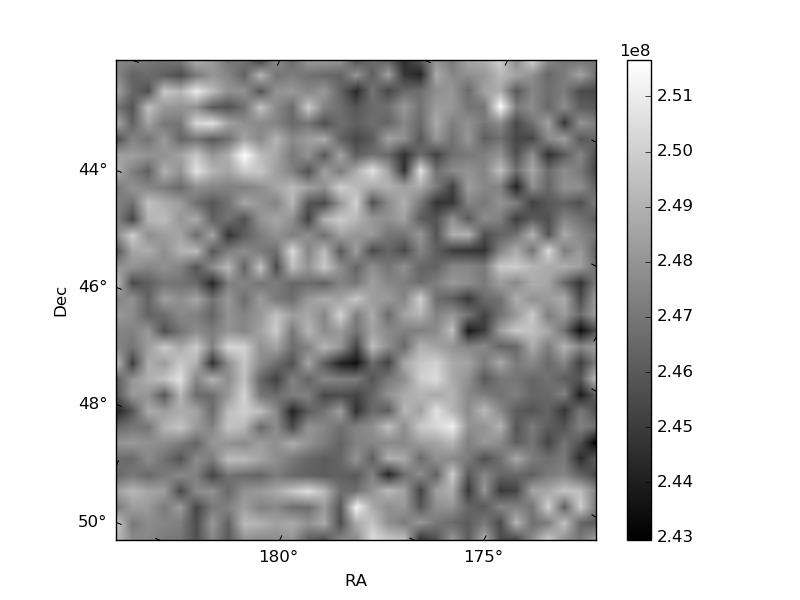
Histogram calculated using DETX and DETY for each event in the final _common_clean file
| Quadrant A | 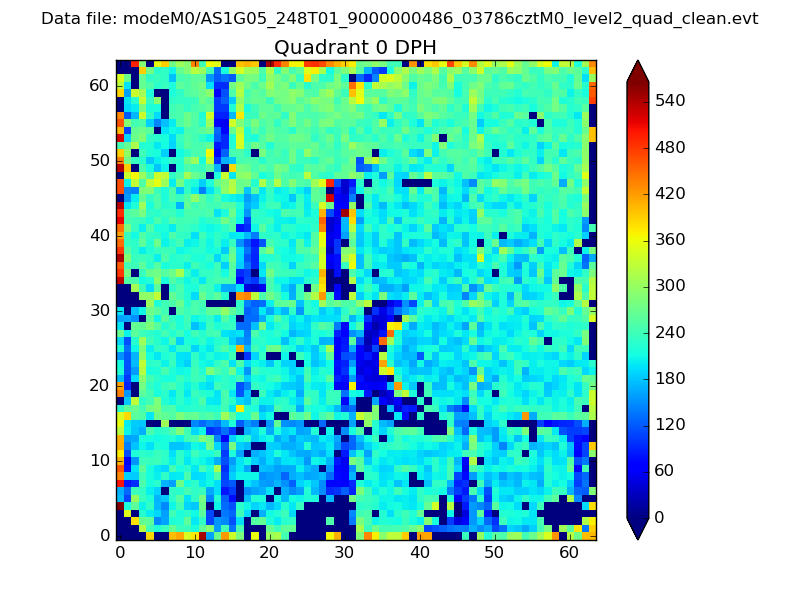 |
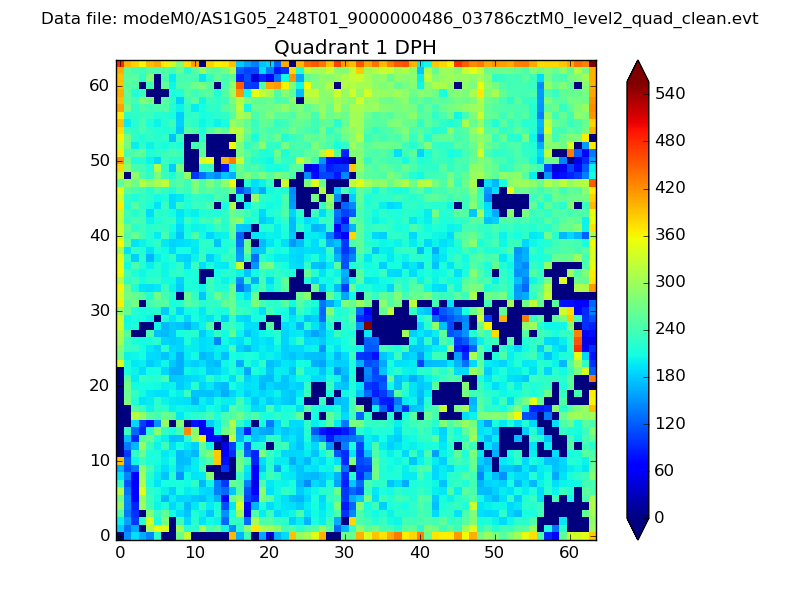 |
Quadrant B |
|---|---|---|---|
| Quadrant D | 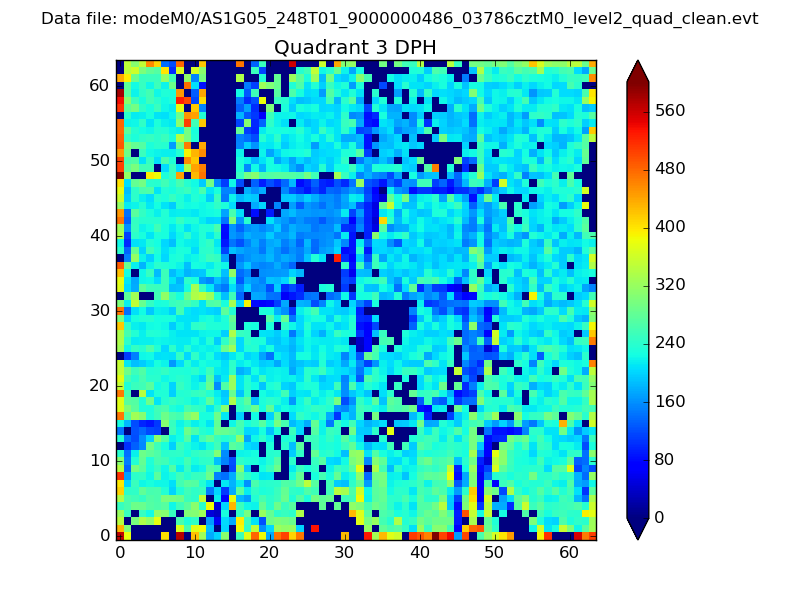 |
 |
Quadrant C |
| Plot type | Count rate plots | Images |
|---|---|---|
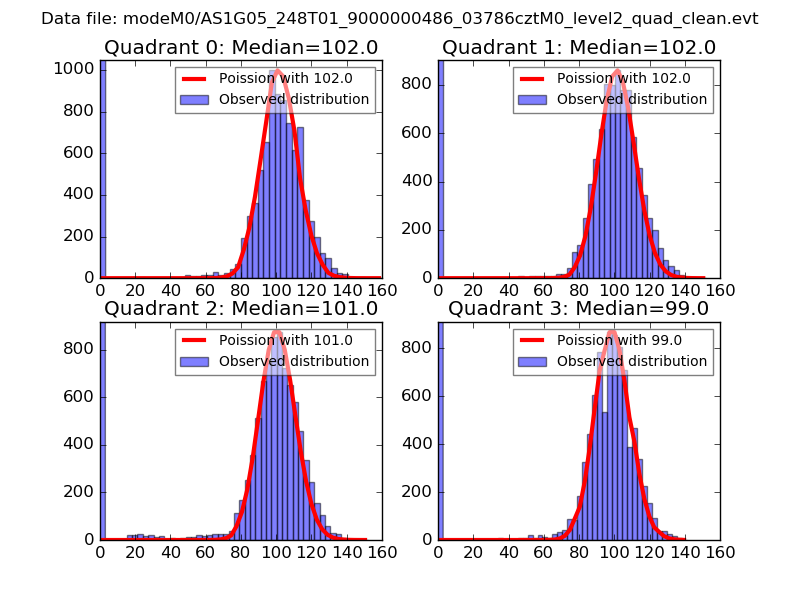
| Comparison with Poisson distribution Blue bars denote a histogram of data divided into 1 sec bins. Red curve is a Poisson curve with rate = median count rate of data. |
 |
 |
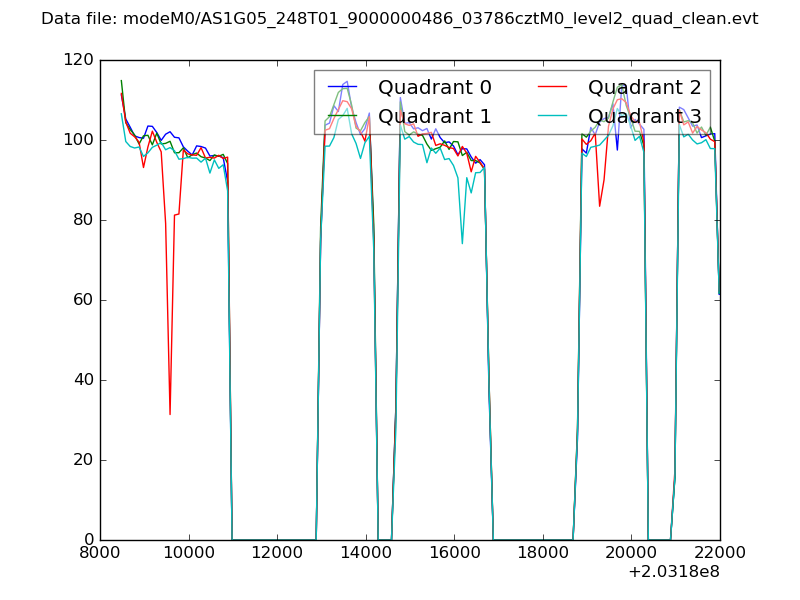
| Quadrant-wise count rates Data is divided into 100 sec bins |
 |
|
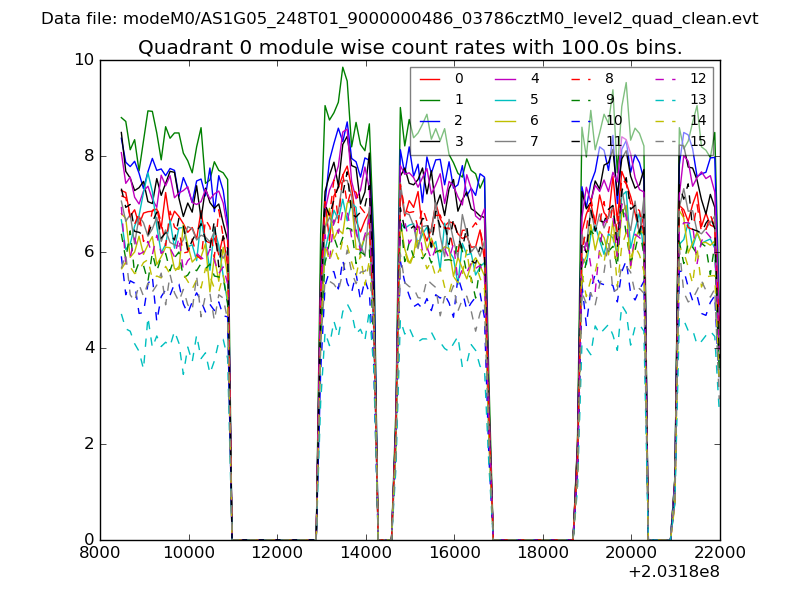
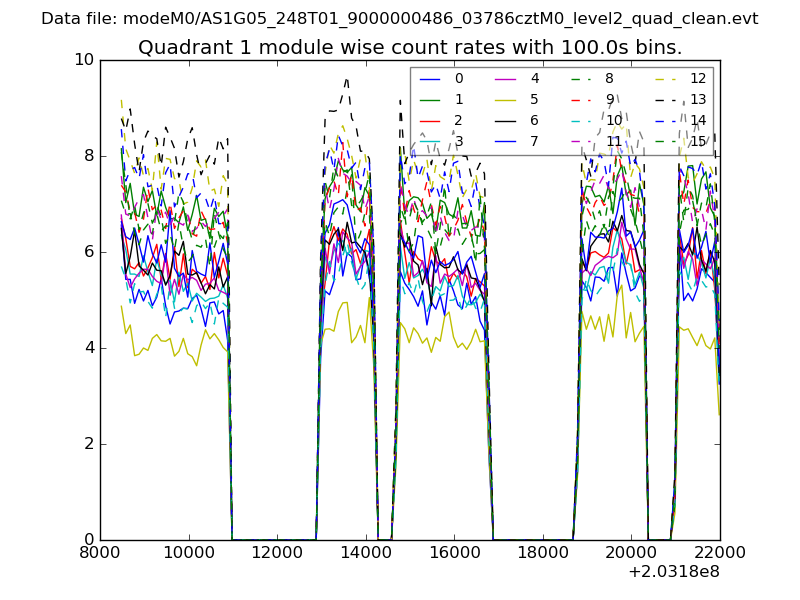
| Module-wise count rates for Quadrant A Data is divided into 100 sec bins |
 |
 |
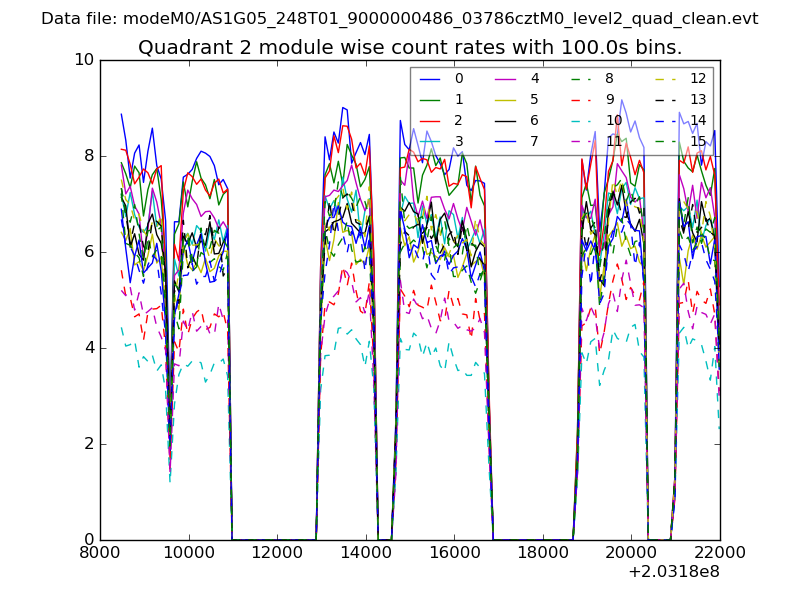
| Module-wise count rates for Quadrant B Data is divided into 100 sec bins |
 |
 |
| Module-wise count rates for Quadrant C Data is divided into 100 sec bins |
 |
 |
| Module-wise count rates for Quadrant D Data is divided into 100 sec bins |
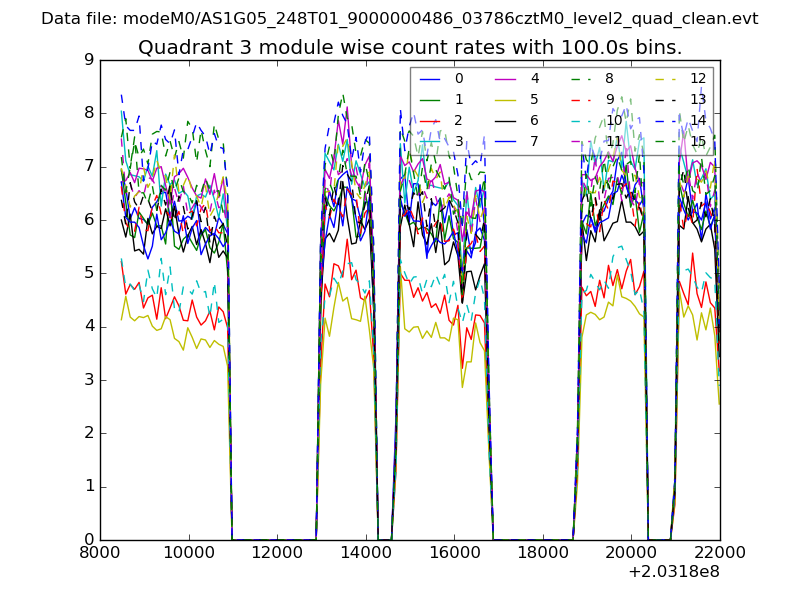 |
 |
| Parameter | Plot |
|---|---|
| CZT HV Monitor | 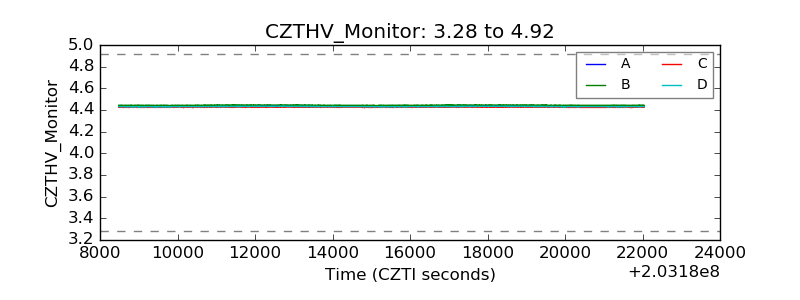 |
| D_VDD | 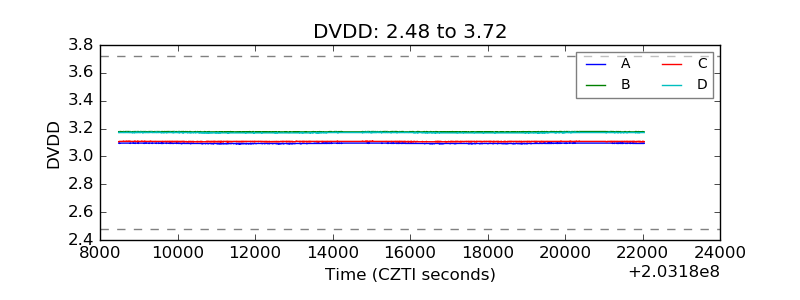 |
| Temperature 1 | 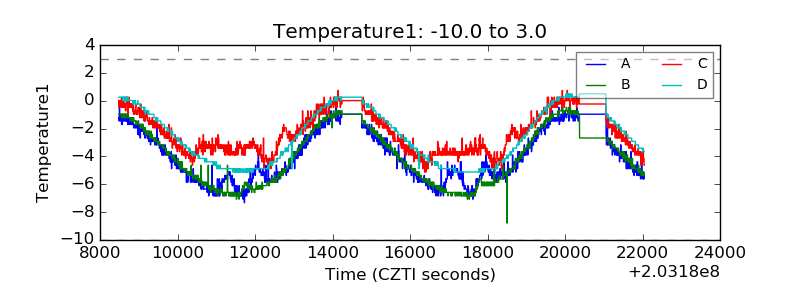 |
| Veto HV Monitor | 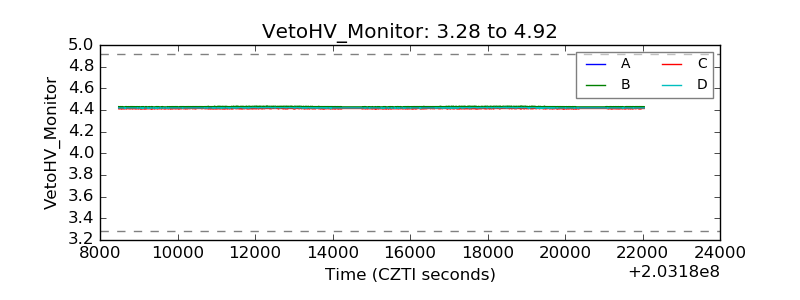 |
| Veto LLD | 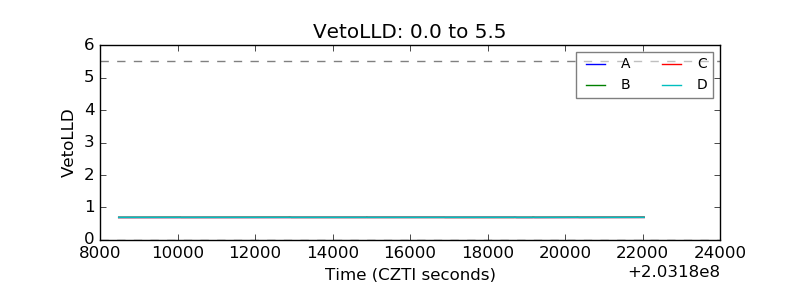 |
| Alpha Counter | 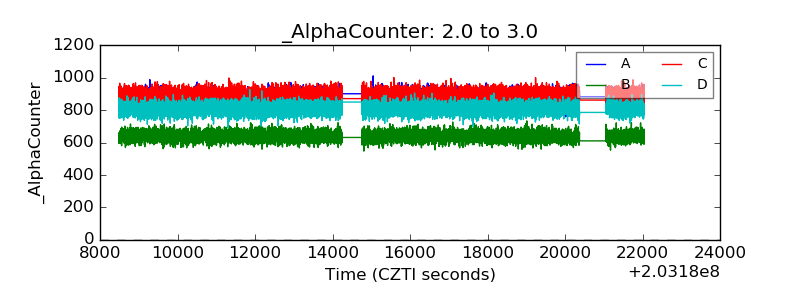 |
| _CPM_Rate | 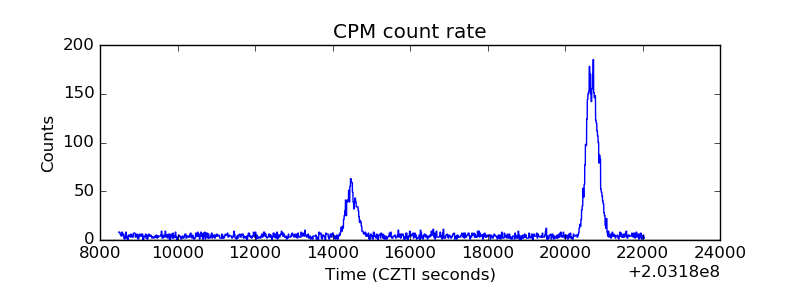 |
| CZT Counter | 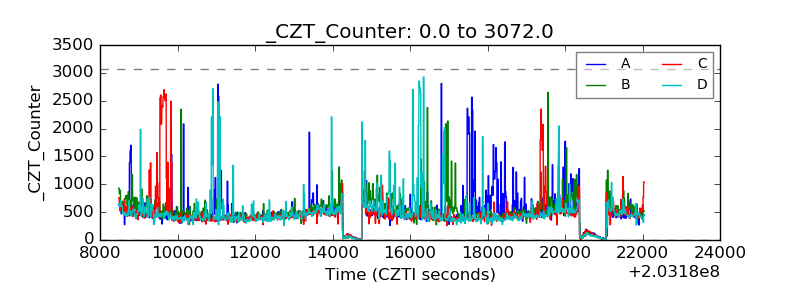 |
| +2.5 Volts monitor |  |
| +5 Volts monitor |  |
| Veto Counter | 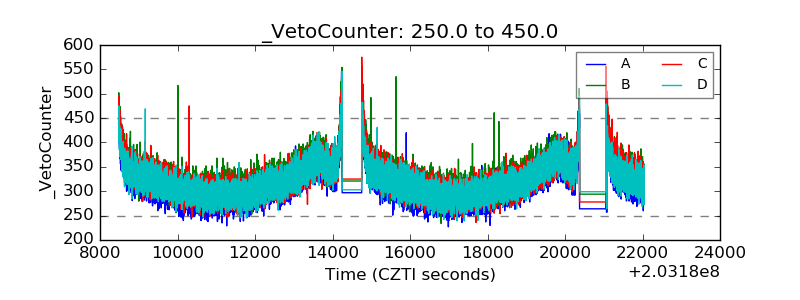 |