| Param | Original file | Final file |
|---|---|---|
| Filename | modeM0/AS1G05_152T03_9000000488cztM0_level2.fits | modeM0/AS1G05_152T03_9000000488cztM0_level2_quad_clean.evt |
| Size (bytes) | 511,194,240 | 538,142,400 |
| Size | 487.5 MB | 513.2 MB |
| Events in quadrant A | 3,063,034 | 3,250,005 |
| Events in quadrant B | 2,973,408 | 3,243,224 |
| Events in quadrant C | 3,026,816 | 3,107,380 |
| Events in quadrant D | 2,569,366 | 2,851,241 |
| Mode M9 | |||
|---|---|---|---|
| Quadrant | BADHDUFLAG | Total packets | Discarded packets |
| A | 0 | 97 | 0 |
| B | 0 | 97 | 0 |
| C | 0 | 97 | 0 |
| D | 0 | 97 | 0 |
| Mode SS | |||
|---|---|---|---|
| Quadrant | BADHDUFLAG | Total packets | Discarded packets |
| A | 0 | 1146 | 0 |
| B | 0 | 1146 | 0 |
| C | 0 | 1146 | 0 |
| D | 0 | 1146 | 0 |
| Mode M0 | |||
|---|---|---|---|
| Quadrant | BADHDUFLAG | Total packets | Discarded packets |
| A | 0 | 142940 | 0 |
| B | 0 | 140261 | 0 |
| C | 0 | 128381 | 0 |
| D | 0 | 141856 | 0 |
| Quadrant | Total seconds | Saturated seconds | Saturation percentage |
|---|---|---|---|
| A | 56055 | 2308 | 4.117385% |
| B | 56055 | 1956 | 3.489430% |
| C | 56056 | 1438 | 2.565292% |
| D | 56057 | 2831 | 5.050217% |
Noise dominated data is calculated using 1-second bins in cleaned event files. If a bin has >2000 counts, and if more than 50% of those come from <1% of pixels, then it is considered to be noise-dominated and hence unusable.
| Quadrant | # 1 sec bins | Bins with >0 counts | Bins with >2000 counts | High rate bins dominated by noise | Noise dominated (total time) | Noise dominated (detector-on time) | Marked lightcurve |
|---|---|---|---|---|---|---|---|
| A | 65812 | 56039 | 0 | 0 | 0.00% | 0.00% | 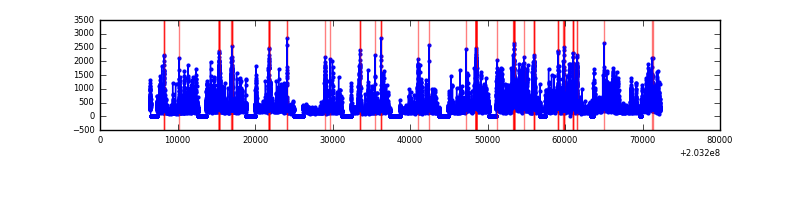 |
| B | 65812 | 56045 | 0 | 0 | 0.00% | 0.00% | 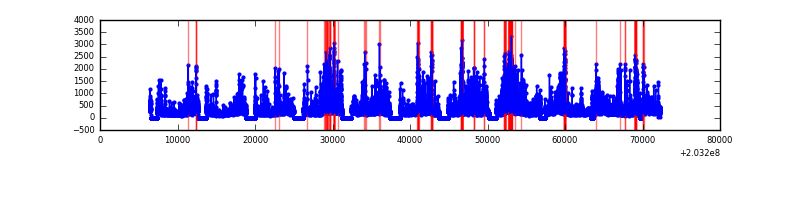 |
| C | 65812 | 56047 | 0 | 0 | 0.00% | 0.00% |  |
| D | 65812 | 56020 | 0 | 0 | 0.00% | 0.00% |  |
Top three noisy pixels from each quadrant. If the there are fewer than three noisy pixels in the level2.evt file, extra rows are filled as -1
| Pixel properties | Quadrant properties | ||||||
|---|---|---|---|---|---|---|---|
| Quadrant | DetID | PixID | Counts | Sigma | Mean | Median | Sigma |
| A | 0 | 29 | 2861 | 10.37 | 797 | 744 | 204.1 |
| A | 7 | 110 | 2638 | 9.28 | 797 | 744 | 204.1 |
| A | 9 | 19 | 2303 | 7.64 | 797 | 744 | 204.1 |
| B | 2 | 9 | 2545 | 11.34 | 786 | 747 | 158.5 |
| B | 12 | 226 | 2176 | 9.01 | 786 | 747 | 158.5 |
| B | 14 | 254 | 2082 | 8.42 | 786 | 747 | 158.5 |
| C | 1 | 80 | 2265 | 7.18 | 798 | 737 | 212.8 |
| C | 1 | 81 | 2156 | 6.67 | 798 | 737 | 212.8 |
| C | 9 | 188 | 2090 | 6.36 | 798 | 737 | 212.8 |
| D | 3 | 14 | 1923 | 6.35 | 735 | 667 | 197.9 |
| D | 7 | 5 | 1874 | 6.1 | 735 | 667 | 197.9 |
| D | 1 | 19 | 1862 | 6.04 | 735 | 667 | 197.9 |
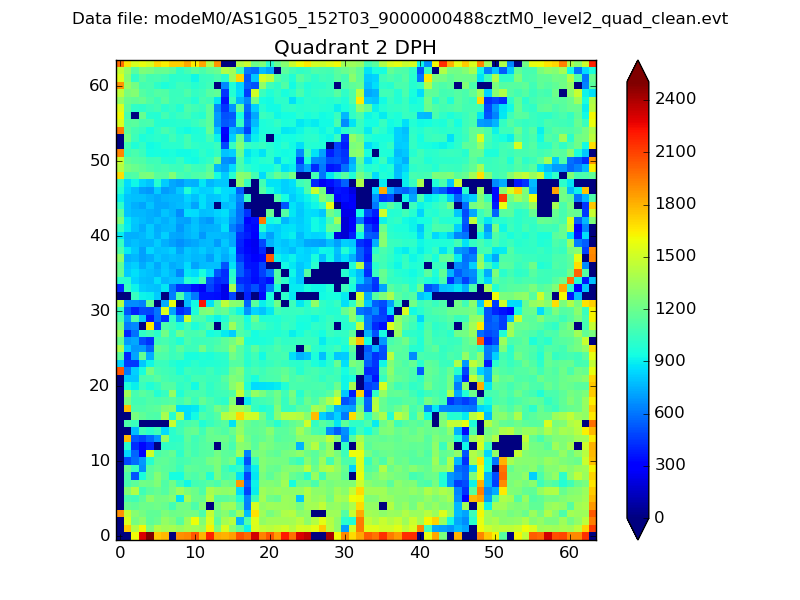
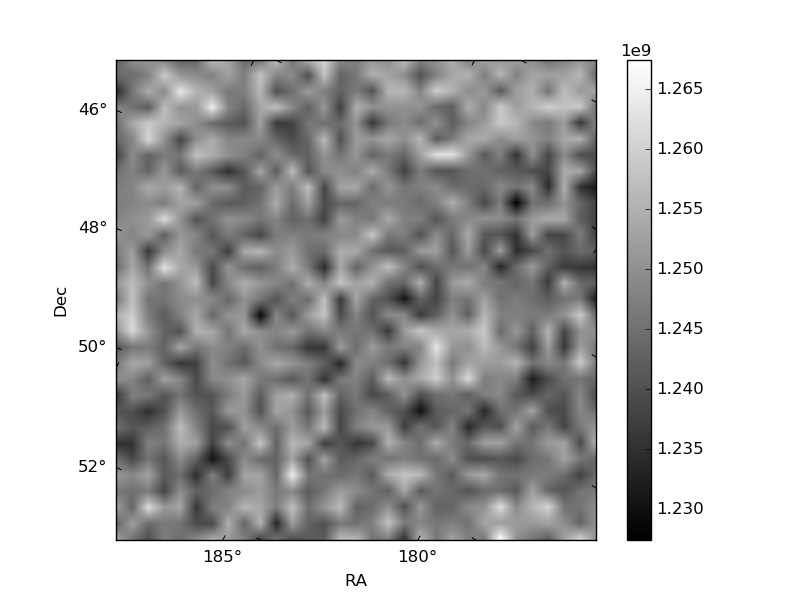
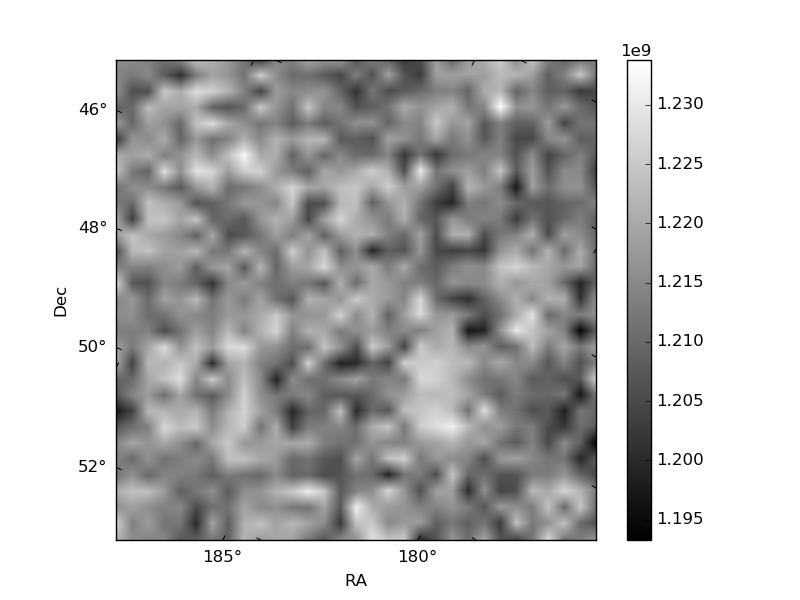
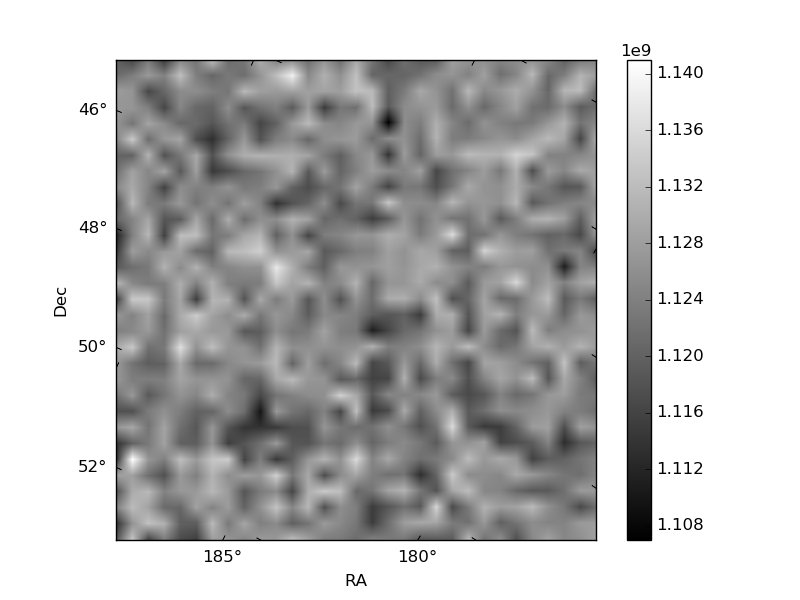
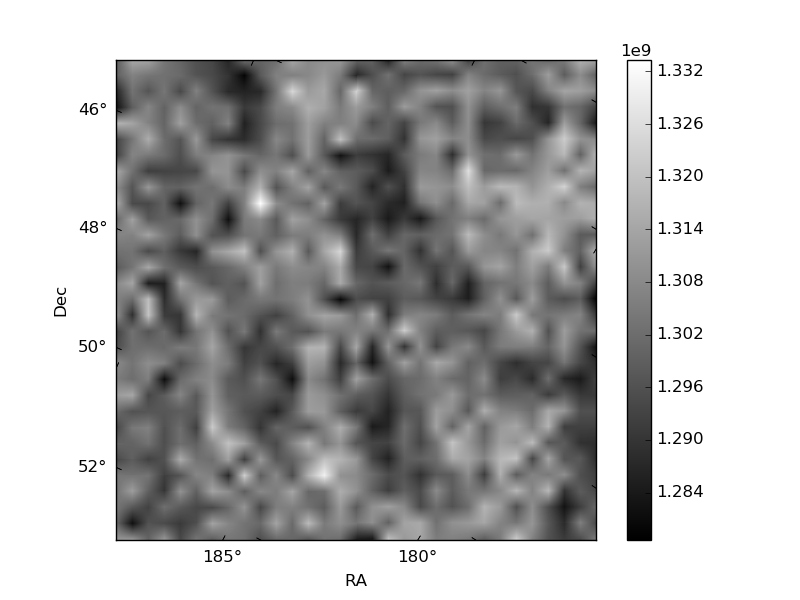
Histogram calculated using DETX and DETY for each event in the final _common_clean file
| Quadrant A | 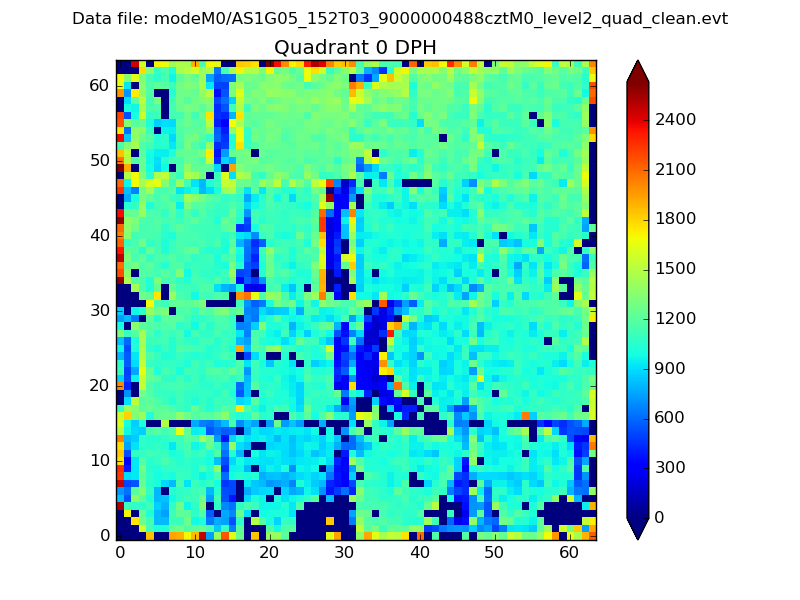 |
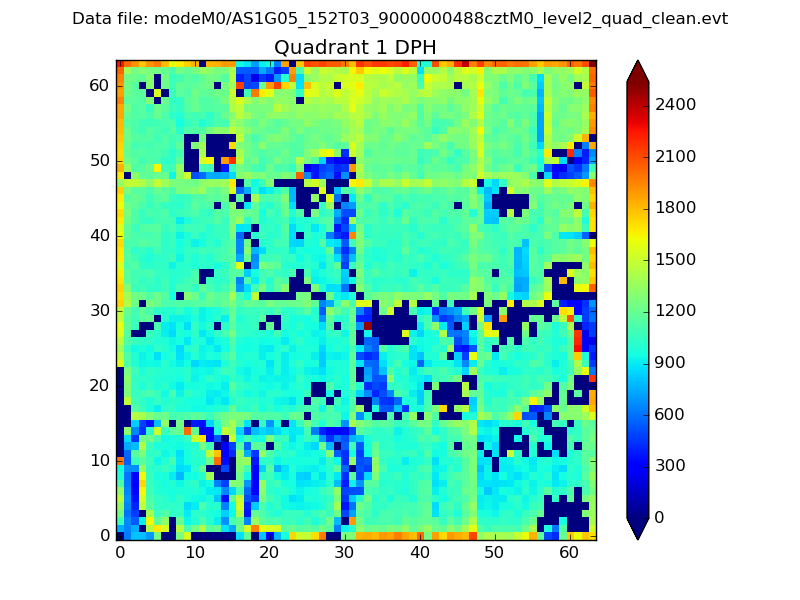 |
Quadrant B |
|---|---|---|---|
| Quadrant D | 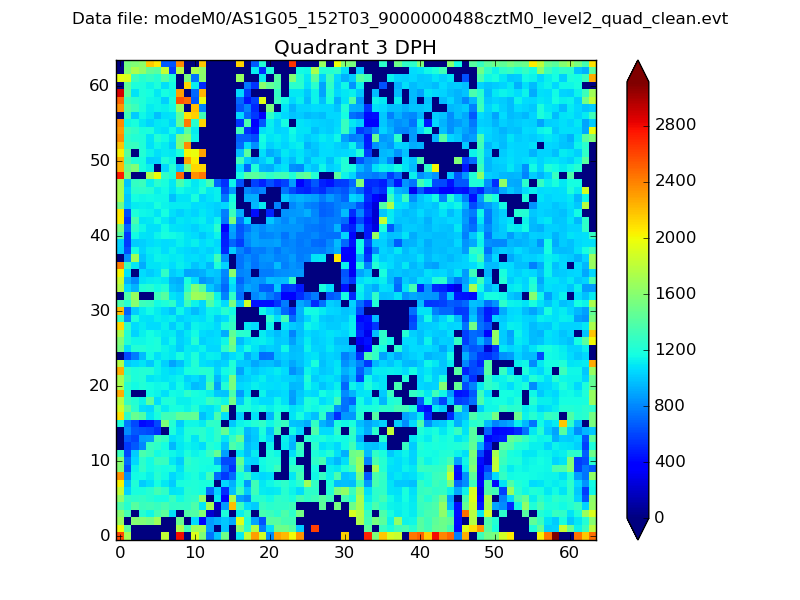 |
 |
Quadrant C |
| Plot type | Count rate plots | Images |
|---|---|---|
| Comparison with Poisson distribution Blue bars denote a histogram of data divided into 1 sec bins. Red curve is a Poisson curve with rate = median count rate of data. |
 |
 |
| Quadrant-wise count rates Data is divided into 100 sec bins |
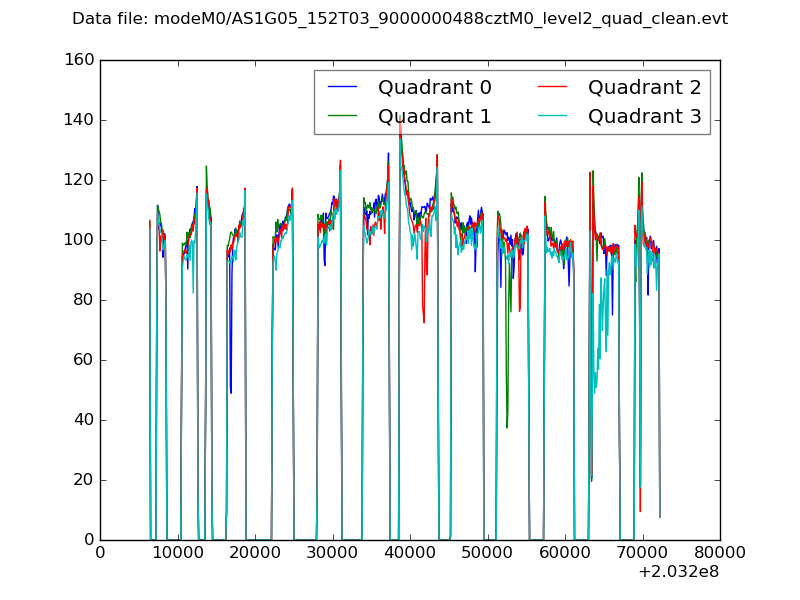 |
|
| Module-wise count rates for Quadrant A Data is divided into 100 sec bins |
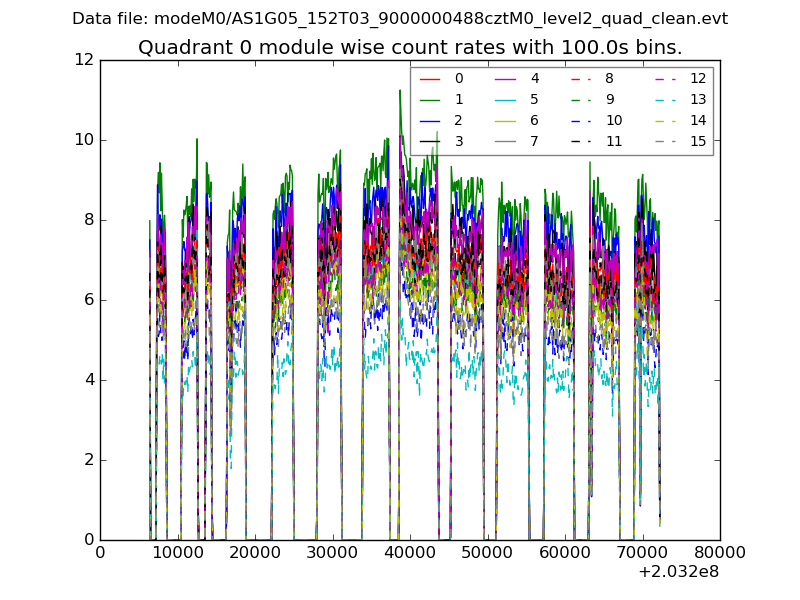 |
 |
| Module-wise count rates for Quadrant B Data is divided into 100 sec bins |
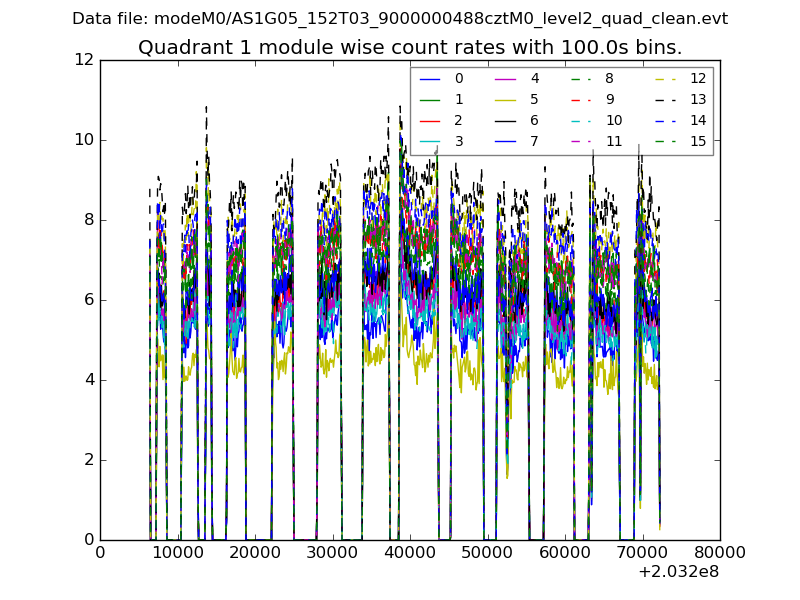 |
 |
| Module-wise count rates for Quadrant C Data is divided into 100 sec bins |
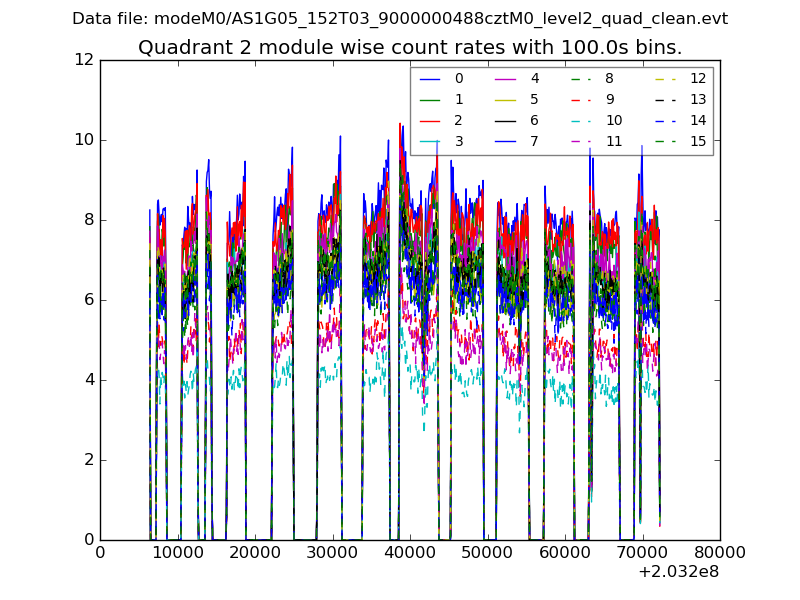 |
 |
| Module-wise count rates for Quadrant D Data is divided into 100 sec bins |
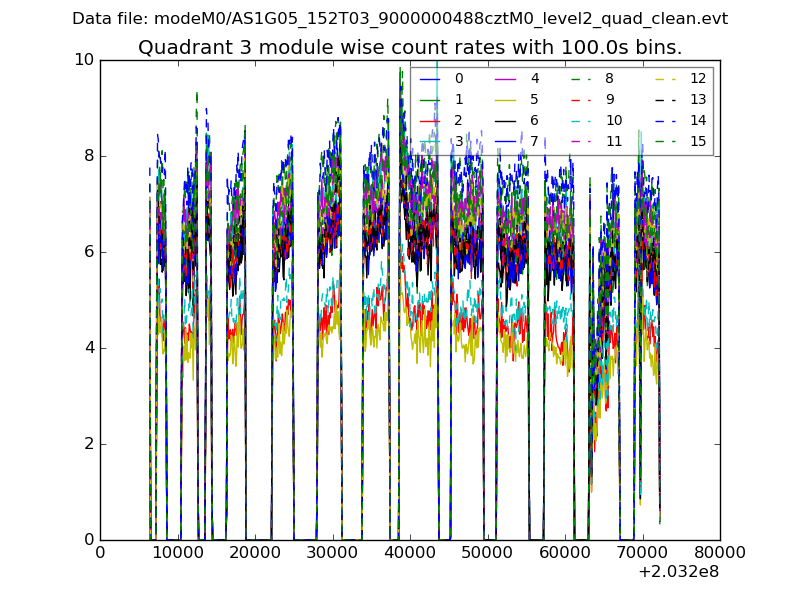 |
 |
| Parameter | Plot |
|---|---|
| CZT HV Monitor | 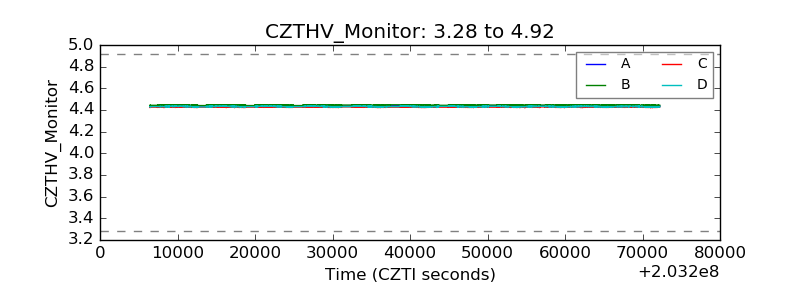 |
| D_VDD | 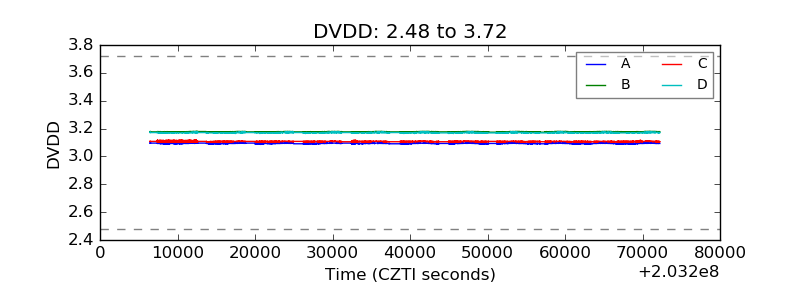 |
| Temperature 1 |  |
| Veto HV Monitor | 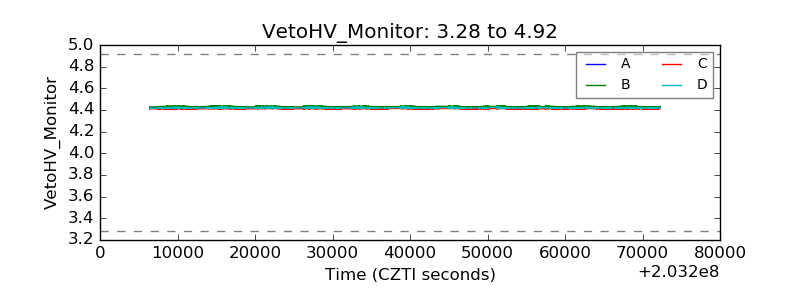 |
| Veto LLD | 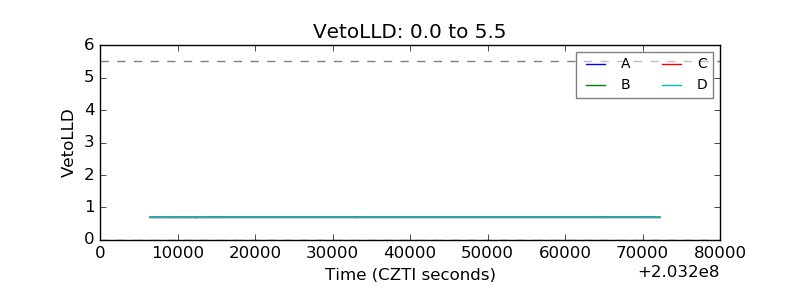 |
| Alpha Counter | 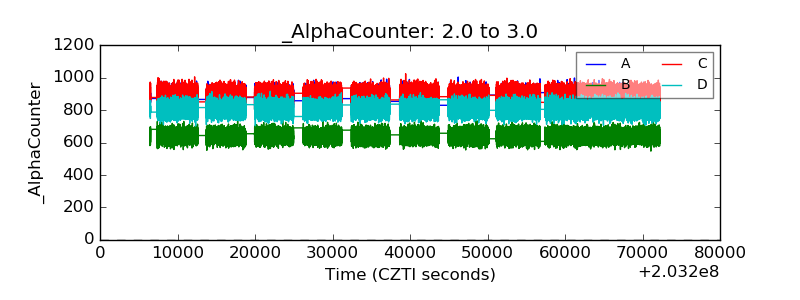 |
| _CPM_Rate | 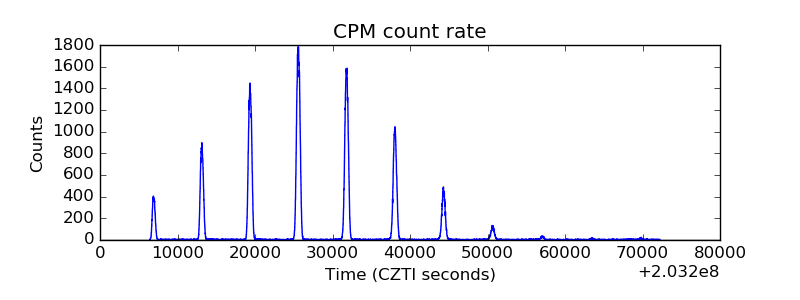 |
| CZT Counter | 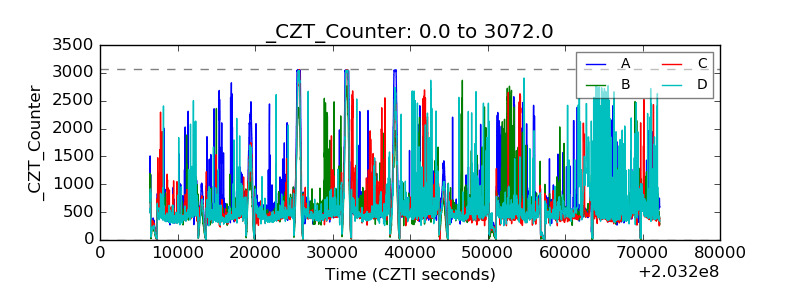 |
| +2.5 Volts monitor | 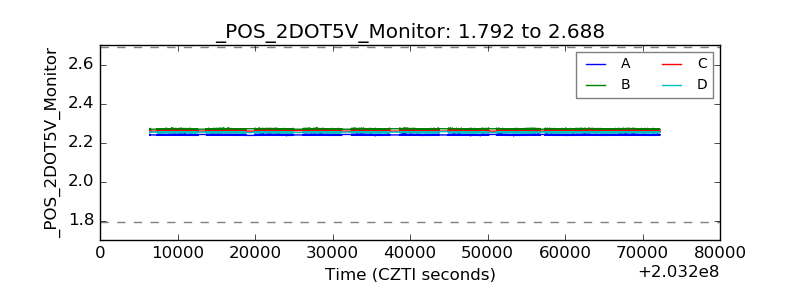 |
| +5 Volts monitor | 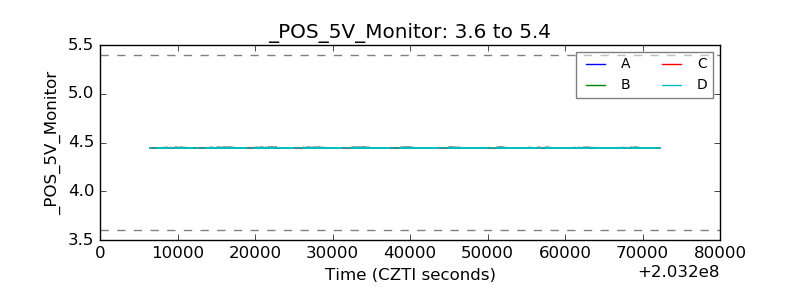 |
| _ROLL_ROT | 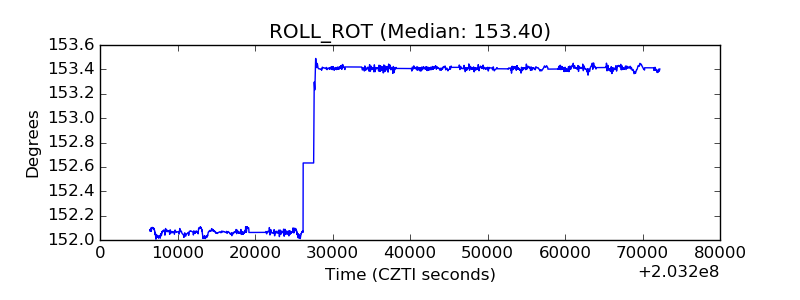 |
| _Roll_DEC | 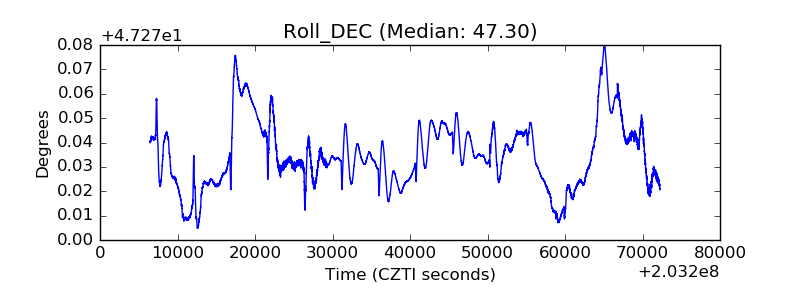 |
| _Roll_RA | 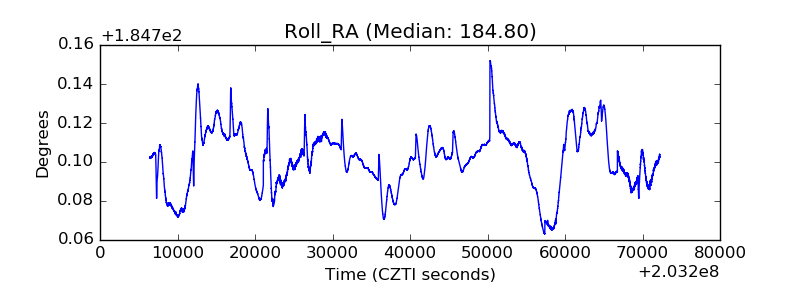 |
| Veto Counter | 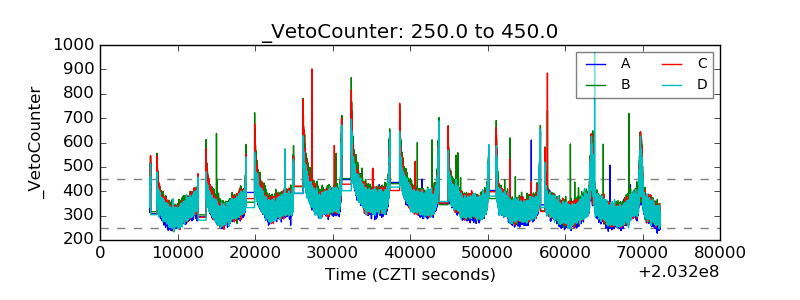 |