| Param | Original file | Final file |
|---|---|---|
| Filename | modeM0/AS1G05_152T03_9000000488_03787cztM0_level2.evt | modeM0/AS1G05_152T03_9000000488_03787cztM0_level2_quad_clean.evt |
| Size (bytes) | 501,589,440 | 72,887,040 |
| Size | 478.4 MB | 69.5 MB |
| Events in quadrant A | 3,922,841 | 436,293 |
| Events in quadrant B | 3,634,528 | 443,137 |
| Events in quadrant C | 3,810,555 | 433,906 |
| Events in quadrant D | 3,364,179 | 422,712 |
| Mode M9 | |||
|---|---|---|---|
| Quadrant | BADHDUFLAG | Total packets | Discarded packets |
| A | 0 | 18 | 0 |
| B | 0 | 18 | 0 |
| C | 0 | 18 | 0 |
| D | 0 | 18 | 0 |
| Mode SS | |||
|---|---|---|---|
| Quadrant | BADHDUFLAG | Total packets | Discarded packets |
| A | 0 | 140 | 0 |
| B | 0 | 140 | 0 |
| C | 0 | 140 | 0 |
| D | 0 | 140 | 0 |
| Mode M0 | |||
|---|---|---|---|
| Quadrant | BADHDUFLAG | Total packets | Discarded packets |
| A | 0 | 16358 | 3 |
| B | 0 | 15511 | 2 |
| C | 0 | 15999 | 2 |
| D | 0 | 15025 | 2 |
| Quadrant | Total seconds | Saturated seconds | Saturation percentage |
|---|---|---|---|
| A | 6753 | 162 | 2.398934% |
| B | 6753 | 61 | 0.903302% |
| C | 6753 | 69 | 1.021768% |
| D | 6753 | 115 | 1.702947% |
Noise dominated data is calculated using 1-second bins in cleaned event files. If a bin has >2000 counts, and if more than 50% of those come from <1% of pixels, then it is considered to be noise-dominated and hence unusable.
| Quadrant | # 1 sec bins | Bins with >0 counts | Bins with >2000 counts | High rate bins dominated by noise | Noise dominated (total time) | Noise dominated (detector-on time) | Marked lightcurve |
|---|---|---|---|---|---|---|---|
| A | 8633 | 6754 | 94 | 94 | 1.09% | 1.39% | 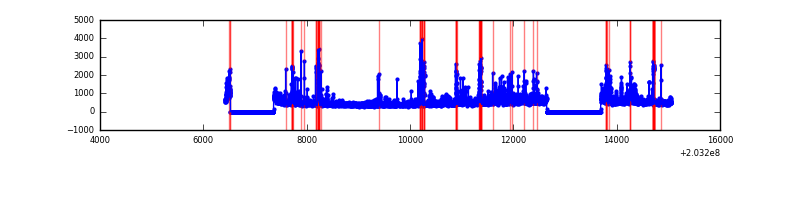 |
| B | 8633 | 6755 | 23 | 23 | 0.27% | 0.34% | 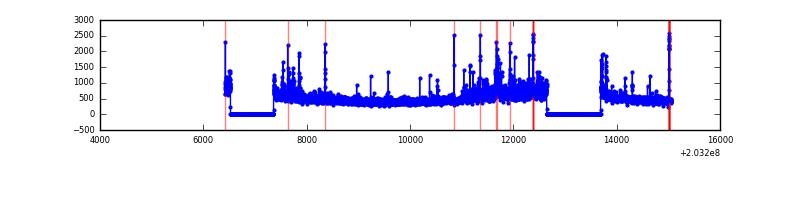 |
| C | 8633 | 6755 | 41 | 41 | 0.47% | 0.61% | 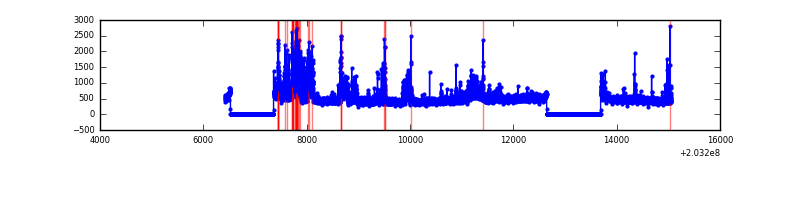 |
| D | 8633 | 6755 | 102 | 102 | 1.18% | 1.51% | 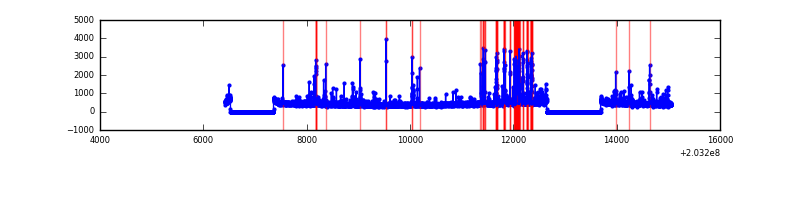 |
Top three noisy pixels from each quadrant. If the there are fewer than three noisy pixels in the level2.evt file, extra rows are filled as -1
| Pixel properties | Quadrant properties | ||||||
|---|---|---|---|---|---|---|---|
| Quadrant | DetID | PixID | Counts | Sigma | Mean | Median | Sigma |
| A | 13 | 251 | 631458 | 4045.89 | 760 | 741 | 155.9 |
| A | 0 | 118 | 262642 | 1680.03 | 760 | 741 | 155.9 |
| A | 0 | 50 | 44485 | 280.61 | 760 | 741 | 155.9 |
| B | 15 | 204 | 304105 | 2007.87 | 779 | 759 | 151.1 |
| B | 0 | 173 | 77749 | 509.6 | 779 | 759 | 151.1 |
| B | 4 | 81 | 70798 | 463.59 | 779 | 759 | 151.1 |
| C | 2 | 53 | 796023 | 4539.3 | 746 | 750 | 175.2 |
| C | 1 | 16 | 44682 | 250.76 | 746 | 750 | 175.2 |
| C | 10 | 65 | 20796 | 114.42 | 746 | 750 | 175.2 |
| D | 8 | 112 | 352846 | 1967.42 | 738 | 718 | 179.0 |
| D | 13 | 239 | 100776 | 559.05 | 738 | 718 | 179.0 |
| D | 11 | 132 | 23872 | 129.37 | 738 | 718 | 179.0 |
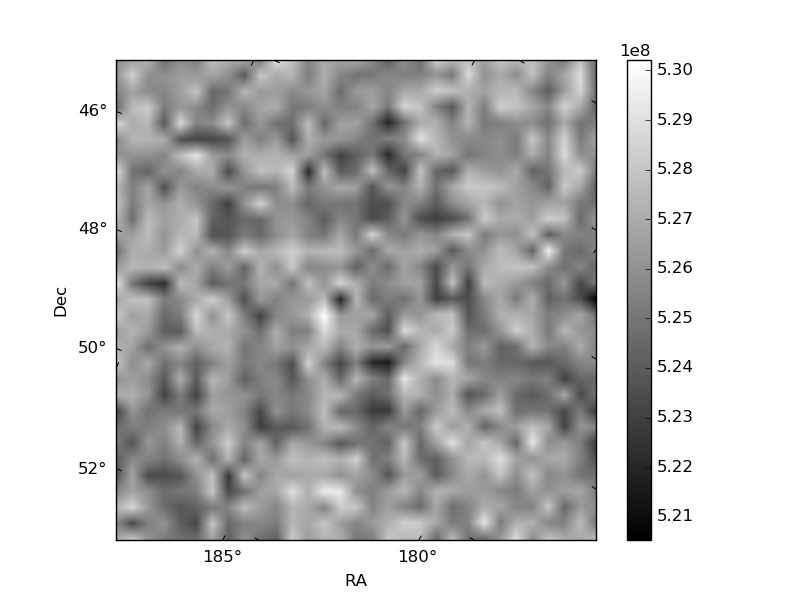
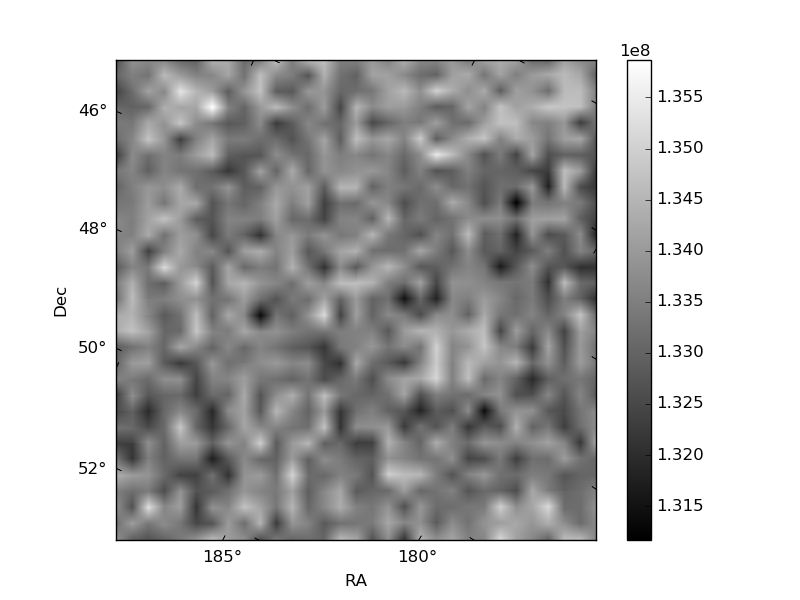
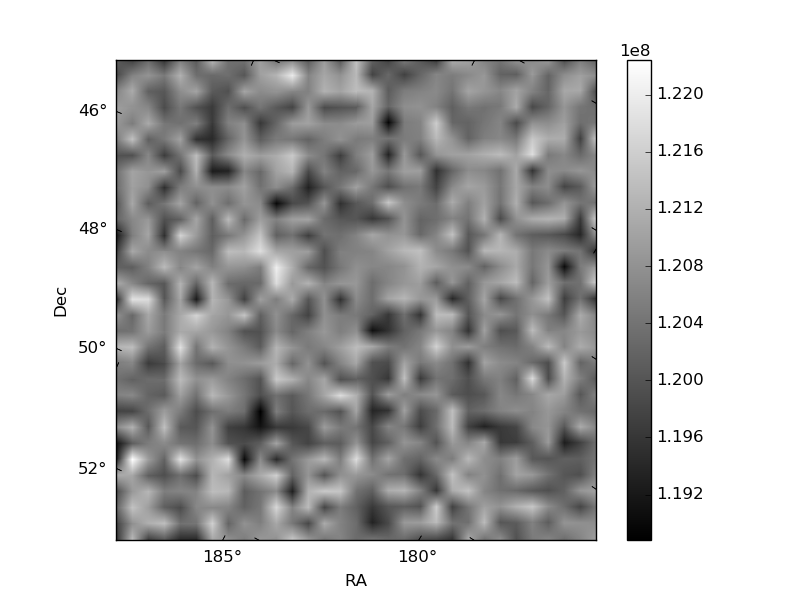
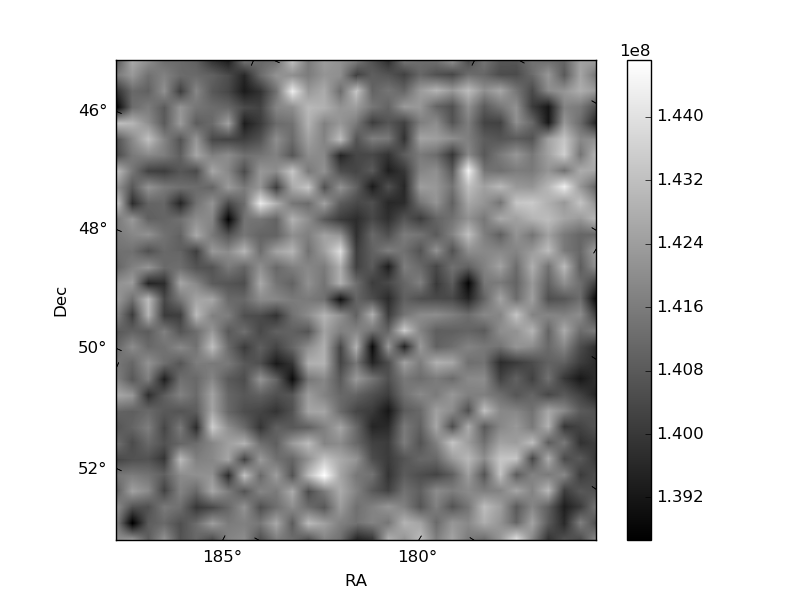
Histogram calculated using DETX and DETY for each event in the final _common_clean file
| Quadrant A | 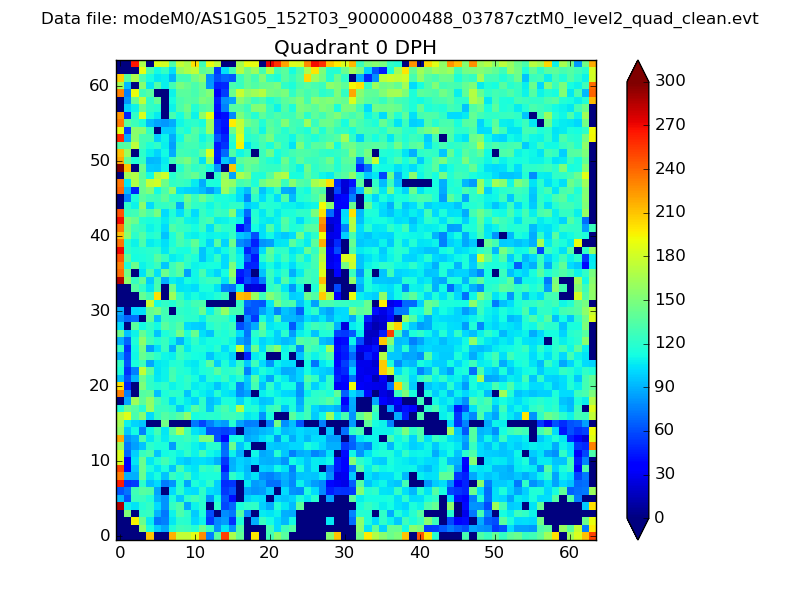 |
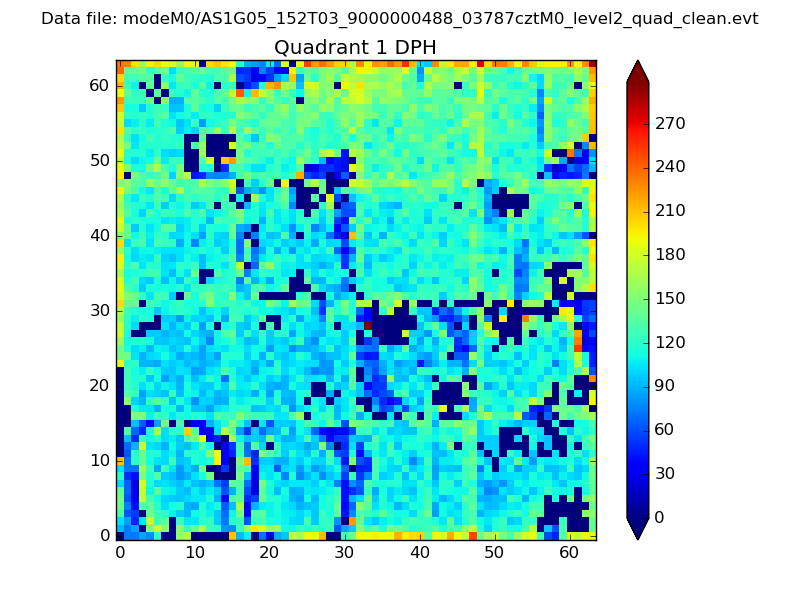 |
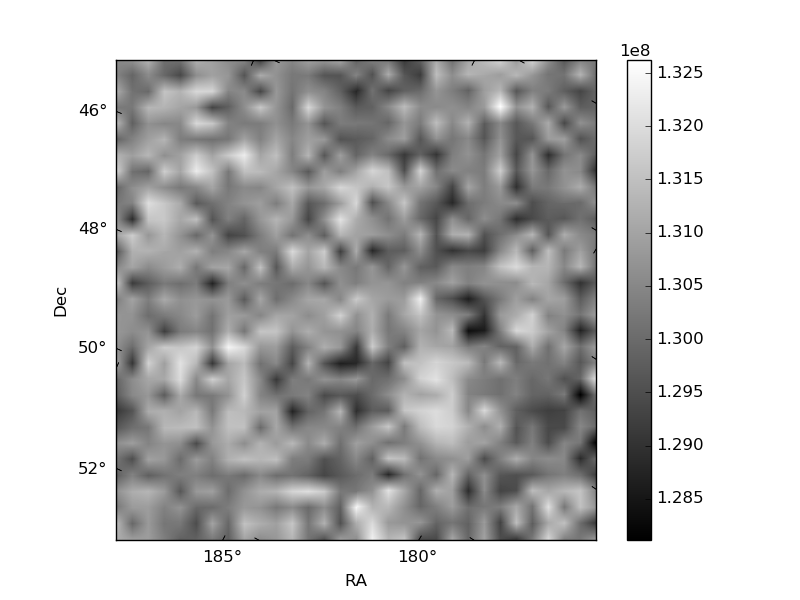
Quadrant B |
|---|---|---|---|
| Quadrant D | 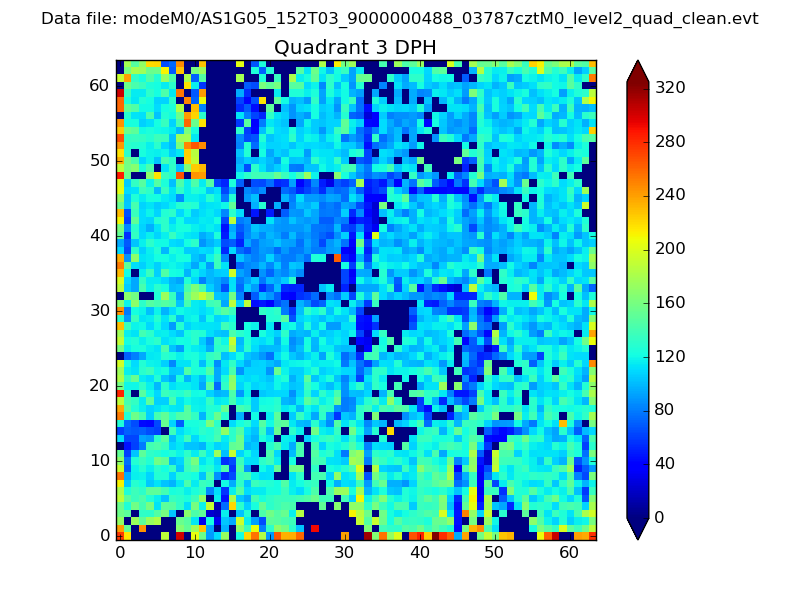 |
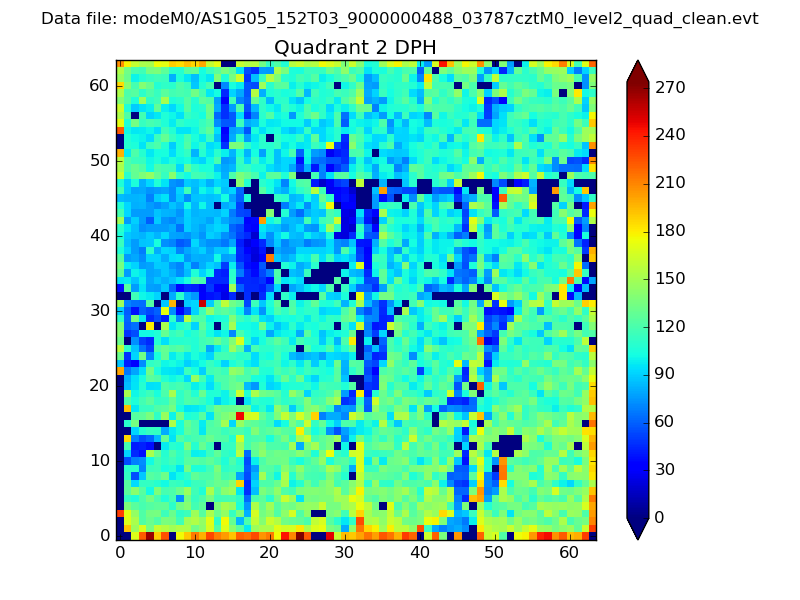 |
Quadrant C |
| Plot type | Count rate plots | Images |
|---|---|---|
| Comparison with Poisson distribution Blue bars denote a histogram of data divided into 1 sec bins. Red curve is a Poisson curve with rate = median count rate of data. |
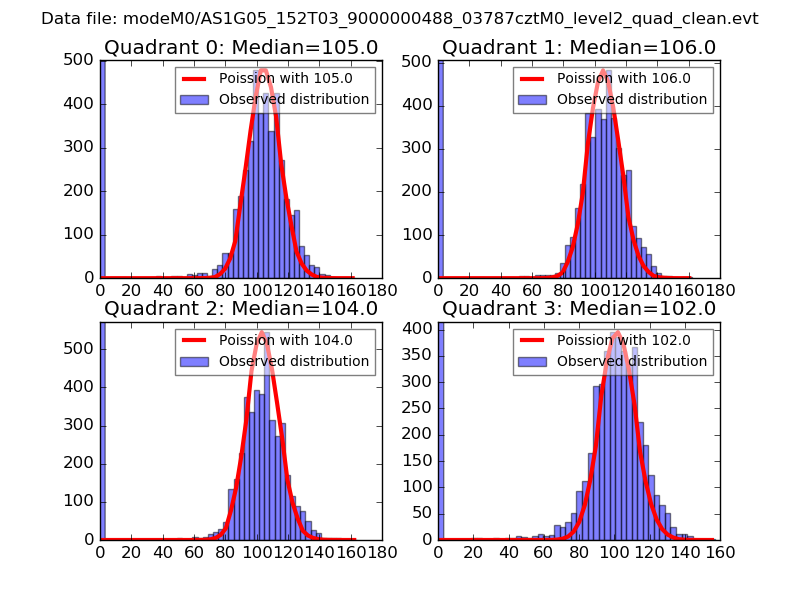 |
 |
| Quadrant-wise count rates Data is divided into 100 sec bins |
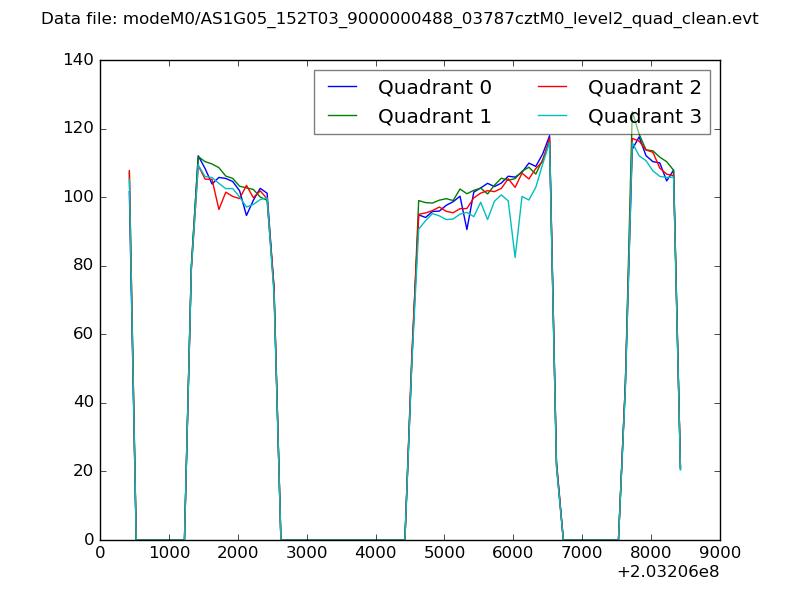 |
|
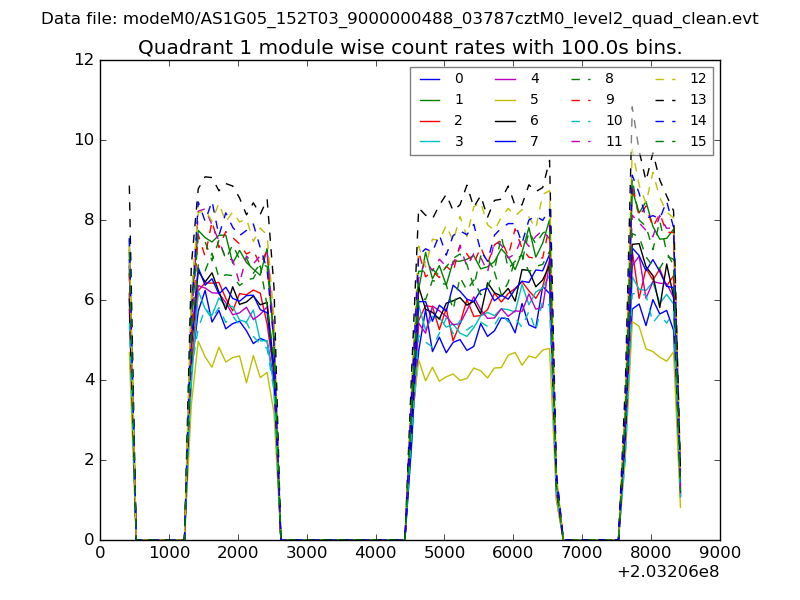
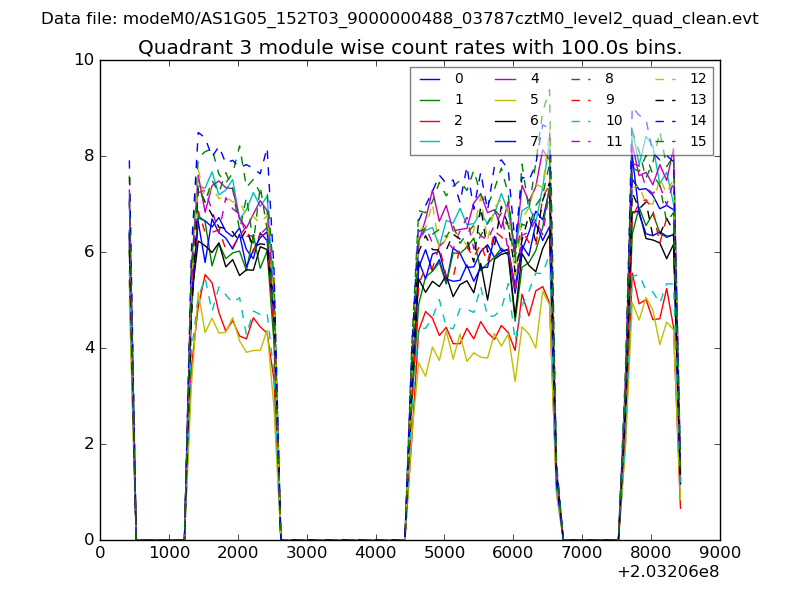
| Module-wise count rates for Quadrant A Data is divided into 100 sec bins |
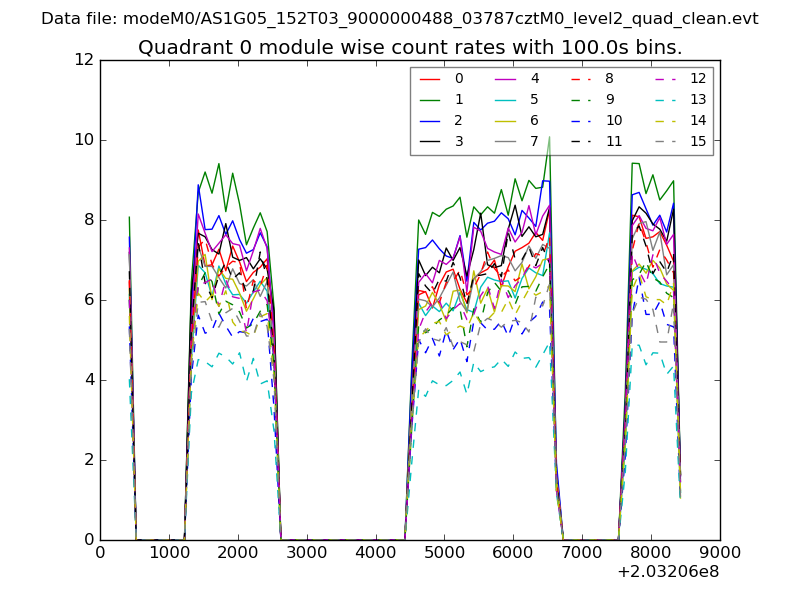 |
 |
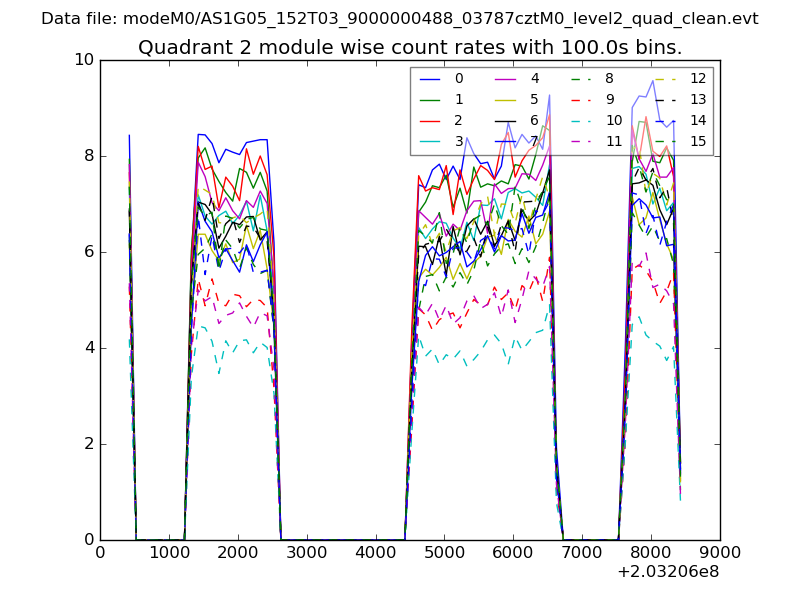
| Module-wise count rates for Quadrant B Data is divided into 100 sec bins |
 |
 |
| Module-wise count rates for Quadrant C Data is divided into 100 sec bins |
 |
 |
| Module-wise count rates for Quadrant D Data is divided into 100 sec bins |
 |
 |
| Parameter | Plot |
|---|---|
| CZT HV Monitor | 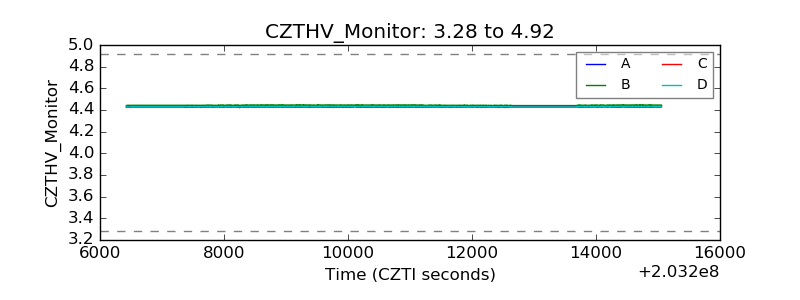 |
| D_VDD | 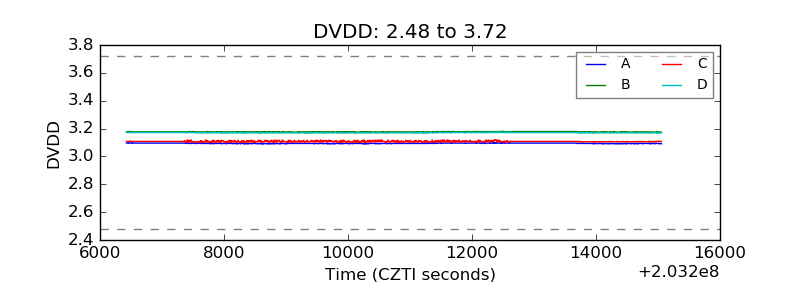 |
| Temperature 1 | 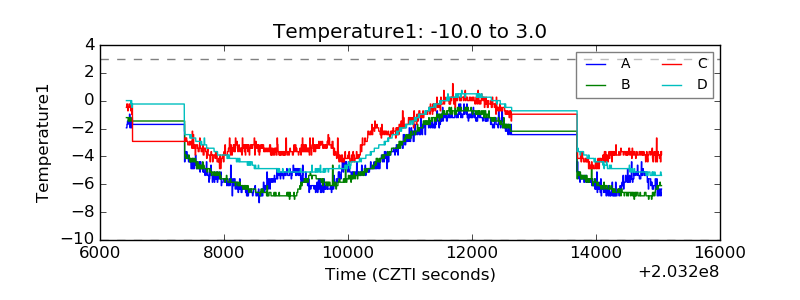 |
| Veto HV Monitor | 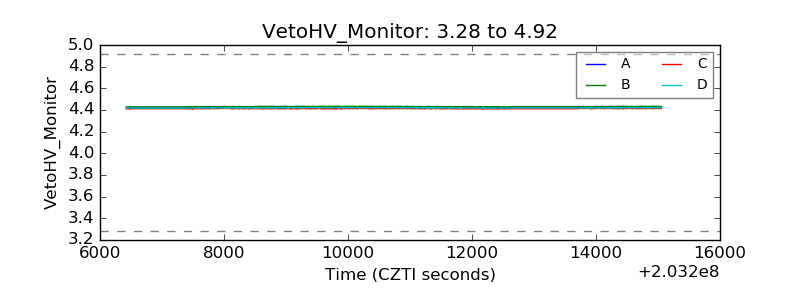 |
| Veto LLD | 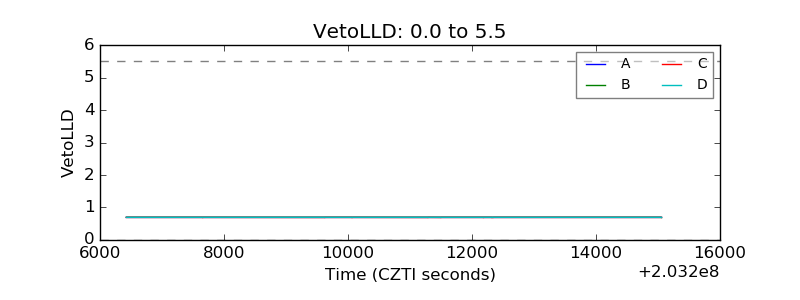 |
| Alpha Counter | 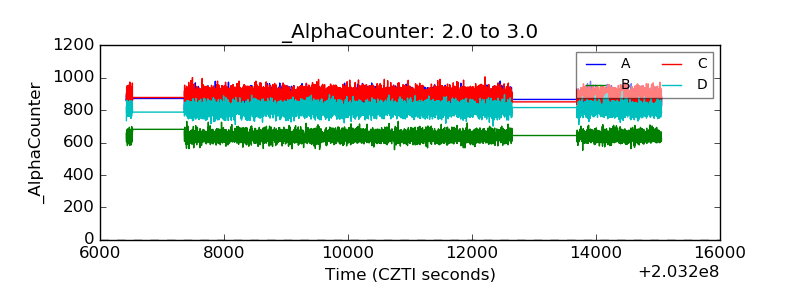 |
| _CPM_Rate | 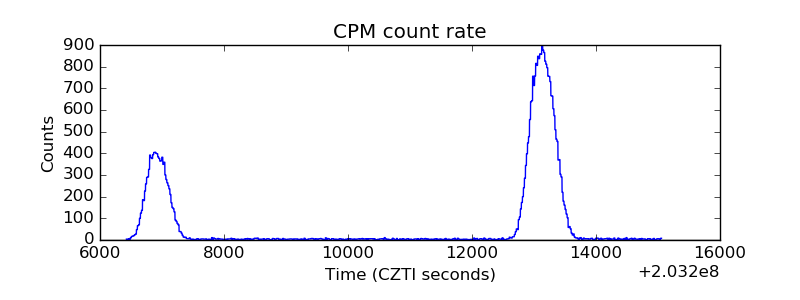 |
| CZT Counter | 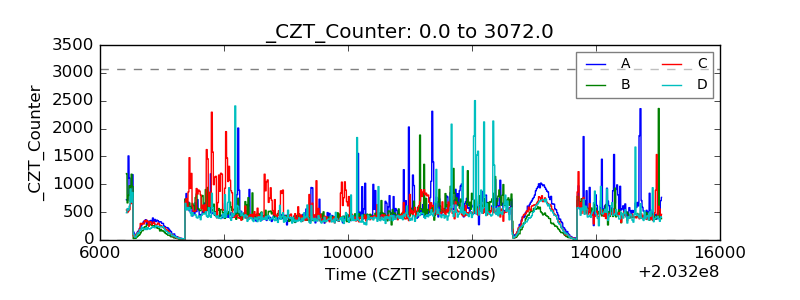 |
| +2.5 Volts monitor |  |
| +5 Volts monitor | 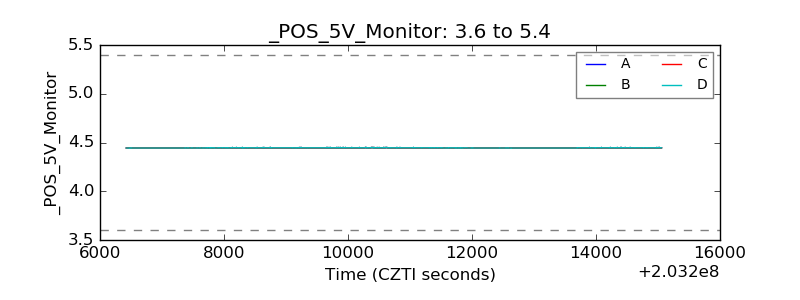 |
| Veto Counter | 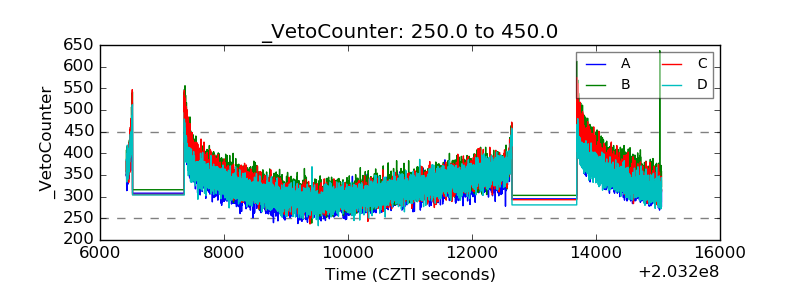 |