| Param | Original file | Final file |
|---|---|---|
| Filename | modeM0/AS1G05_152T03_9000000488_03789cztM0_level2.evt | modeM0/AS1G05_152T03_9000000488_03789cztM0_level2_quad_clean.evt |
| Size (bytes) | 531,135,360 | 71,616,960 |
| Size | 506.5 MB | 68.3 MB |
| Events in quadrant A | 4,957,650 | 414,838 |
| Events in quadrant B | 3,816,989 | 430,879 |
| Events in quadrant C | 3,288,875 | 424,181 |
| Events in quadrant D | 3,547,386 | 411,160 |
| Mode M9 | |||
|---|---|---|---|
| Quadrant | BADHDUFLAG | Total packets | Discarded packets |
| A | 0 | 21 | 0 |
| B | 0 | 21 | 0 |
| C | 0 | 21 | 0 |
| D | 0 | 21 | 0 |
| Mode SS | |||
|---|---|---|---|
| Quadrant | BADHDUFLAG | Total packets | Discarded packets |
| A | 0 | 144 | 0 |
| B | 0 | 144 | 0 |
| C | 0 | 144 | 0 |
| D | 0 | 144 | 0 |
| Mode M0 | |||
|---|---|---|---|
| Quadrant | BADHDUFLAG | Total packets | Discarded packets |
| A | 0 | 19184 | 3 |
| B | 0 | 16211 | 2 |
| C | 0 | 14557 | 2 |
| D | 0 | 15597 | 2 |
| Quadrant | Total seconds | Saturated seconds | Saturation percentage |
|---|---|---|---|
| A | 6994 | 411 | 5.876466% |
| B | 6994 | 77 | 1.100944% |
| C | 6994 | 40 | 0.571919% |
| D | 6994 | 77 | 1.100944% |
Noise dominated data is calculated using 1-second bins in cleaned event files. If a bin has >2000 counts, and if more than 50% of those come from <1% of pixels, then it is considered to be noise-dominated and hence unusable.
| Quadrant | # 1 sec bins | Bins with >0 counts | Bins with >2000 counts | High rate bins dominated by noise | Noise dominated (total time) | Noise dominated (detector-on time) | Marked lightcurve |
|---|---|---|---|---|---|---|---|
| A | 9164 | 6996 | 300 | 300 | 3.27% | 4.29% | 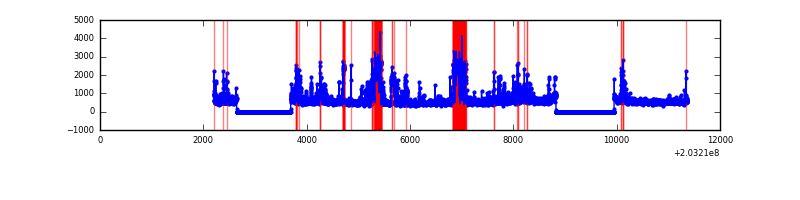 |
| B | 9164 | 6995 | 32 | 32 | 0.35% | 0.46% | 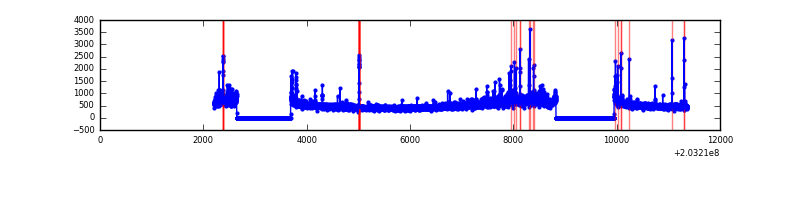 |
| C | 9164 | 6996 | 9 | 9 | 0.10% | 0.13% | 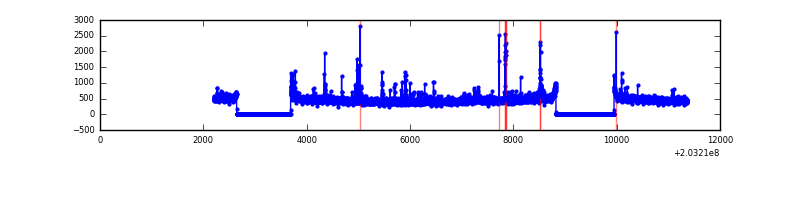 |
| D | 9164 | 6996 | 59 | 59 | 0.64% | 0.84% | 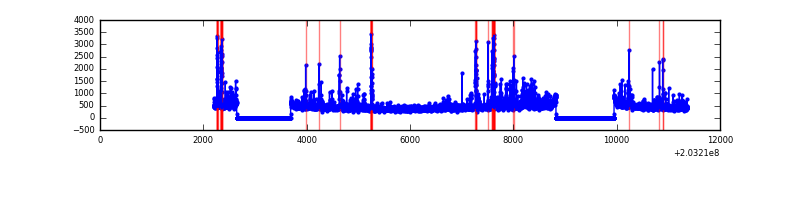 |
Top three noisy pixels from each quadrant. If the there are fewer than three noisy pixels in the level2.evt file, extra rows are filled as -1
| Pixel properties | Quadrant properties | ||||||
|---|---|---|---|---|---|---|---|
| Quadrant | DetID | PixID | Counts | Sigma | Mean | Median | Sigma |
| A | 13 | 251 | 1593745 | 9718.33 | 796 | 778 | 163.9 |
| A | 0 | 118 | 183155 | 1112.64 | 796 | 778 | 163.9 |
| A | 0 | 50 | 56832 | 341.97 | 796 | 778 | 163.9 |
| B | 15 | 204 | 358696 | 2245.02 | 831 | 809 | 159.4 |
| B | 0 | 173 | 53580 | 331.03 | 831 | 809 | 159.4 |
| B | 5 | 200 | 41169 | 253.18 | 831 | 809 | 159.4 |
| C | 2 | 53 | 85504 | 456.49 | 794 | 798 | 185.6 |
| C | 10 | 65 | 63841 | 339.74 | 794 | 798 | 185.6 |
| C | 1 | 16 | 30367 | 159.35 | 794 | 798 | 185.6 |
| D | 8 | 112 | 343239 | 1775.7 | 788 | 765 | 192.9 |
| D | 13 | 239 | 56233 | 287.6 | 788 | 765 | 192.9 |
| D | 2 | 14 | 43517 | 221.67 | 788 | 765 | 192.9 |
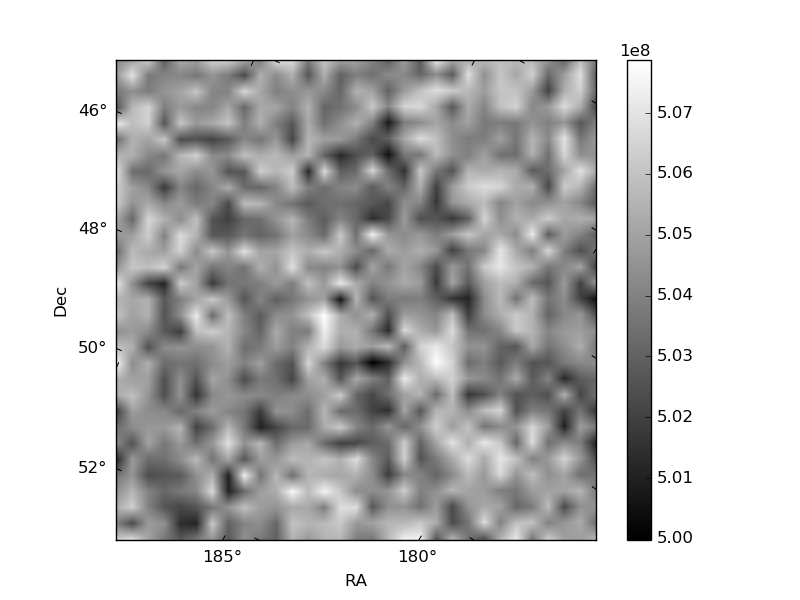
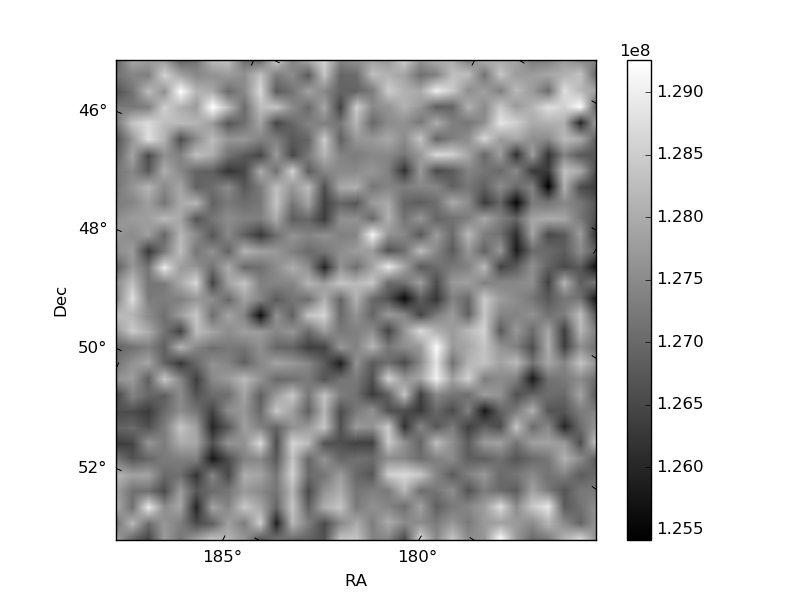
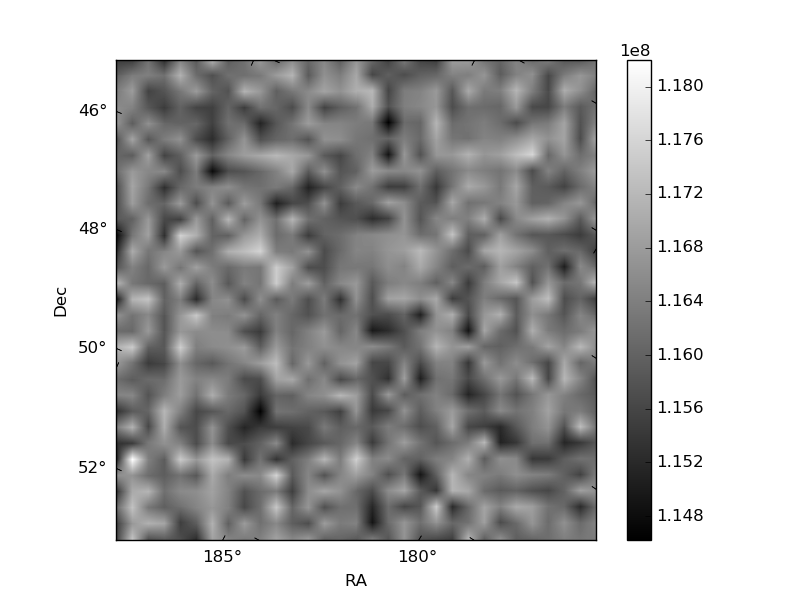
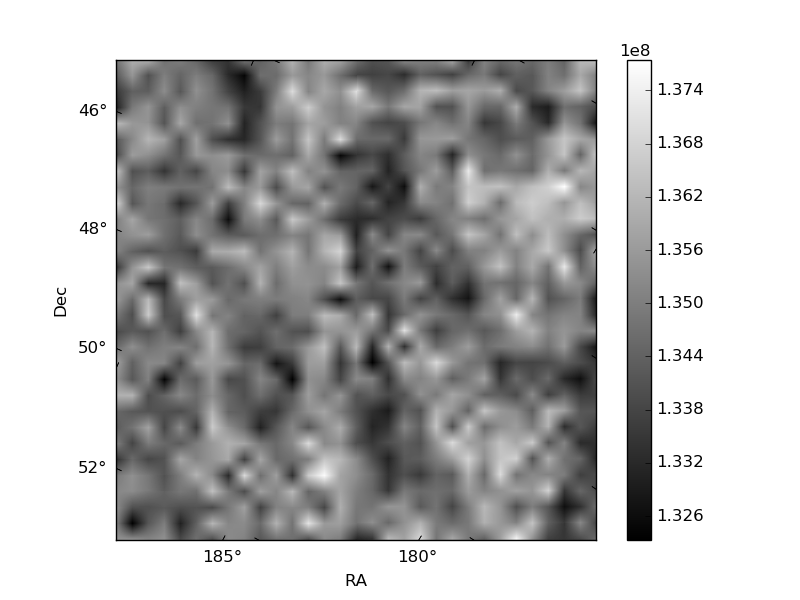
Histogram calculated using DETX and DETY for each event in the final _common_clean file
| Quadrant A | 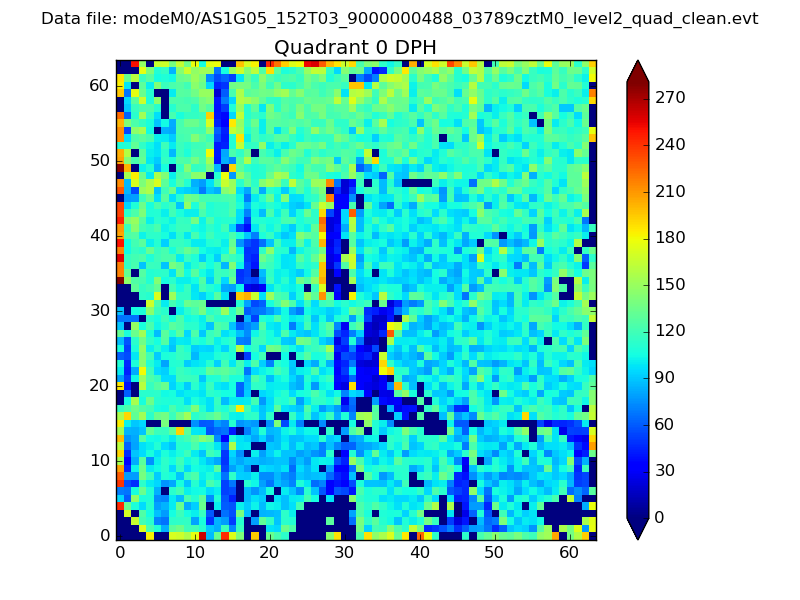 |
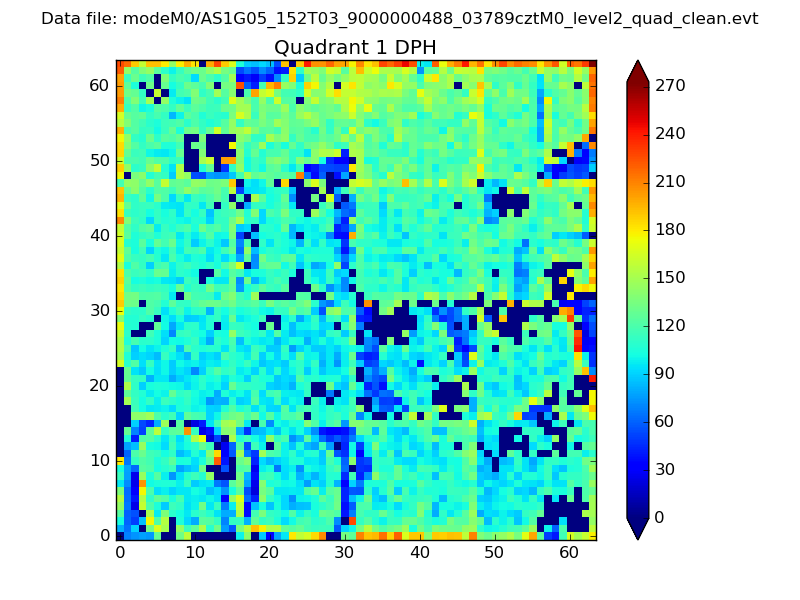 |
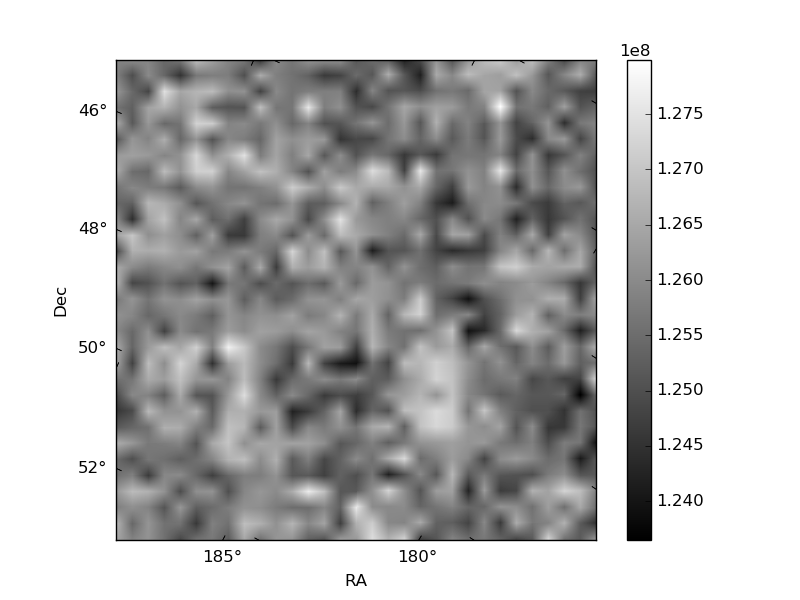
Quadrant B |
|---|---|---|---|
| Quadrant D | 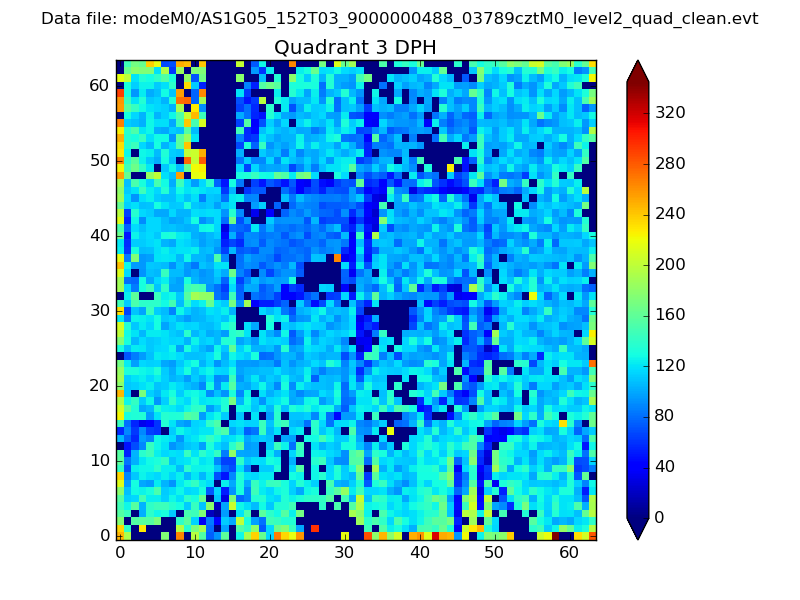 |
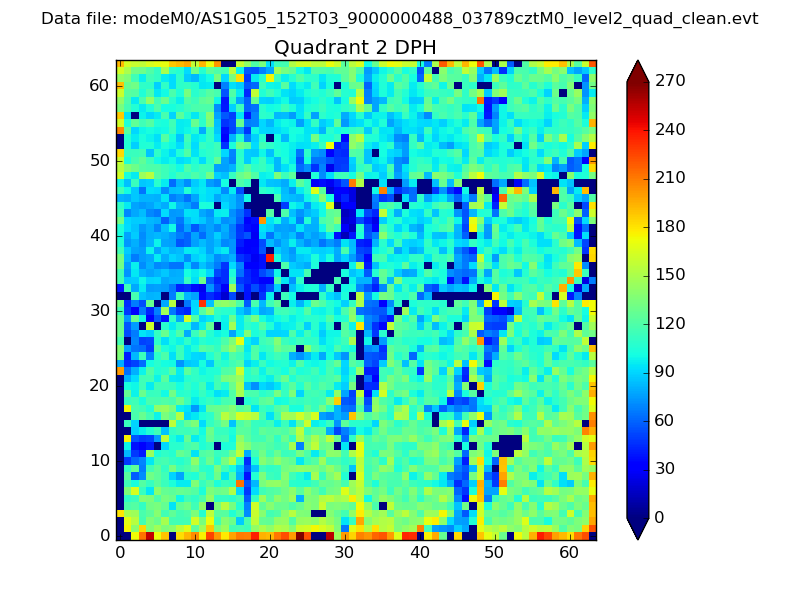 |
Quadrant C |
| Plot type | Count rate plots | Images |
|---|---|---|
| Comparison with Poisson distribution Blue bars denote a histogram of data divided into 1 sec bins. Red curve is a Poisson curve with rate = median count rate of data. |
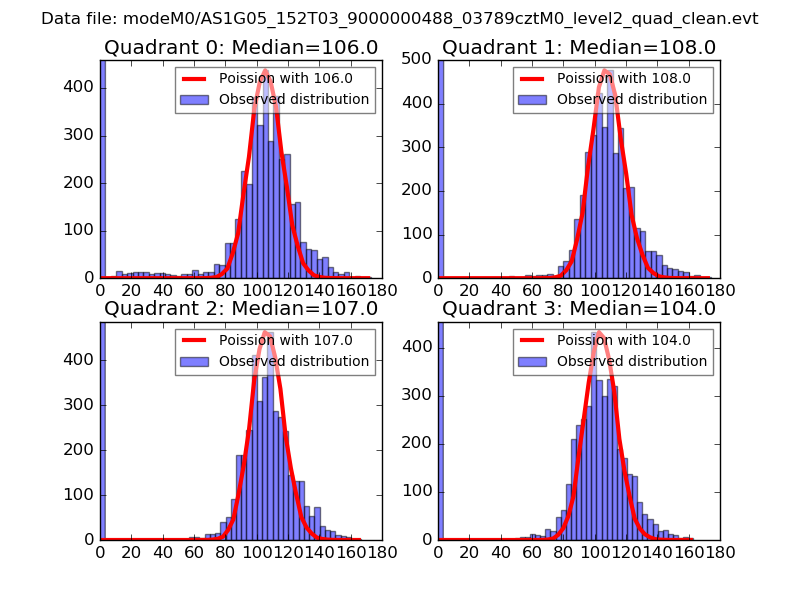 |
 |
| Quadrant-wise count rates Data is divided into 100 sec bins |
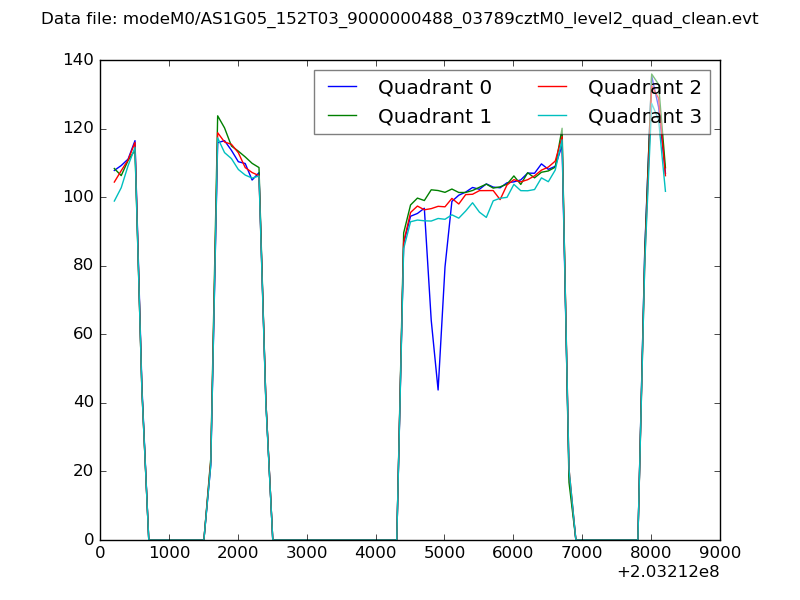 |
|
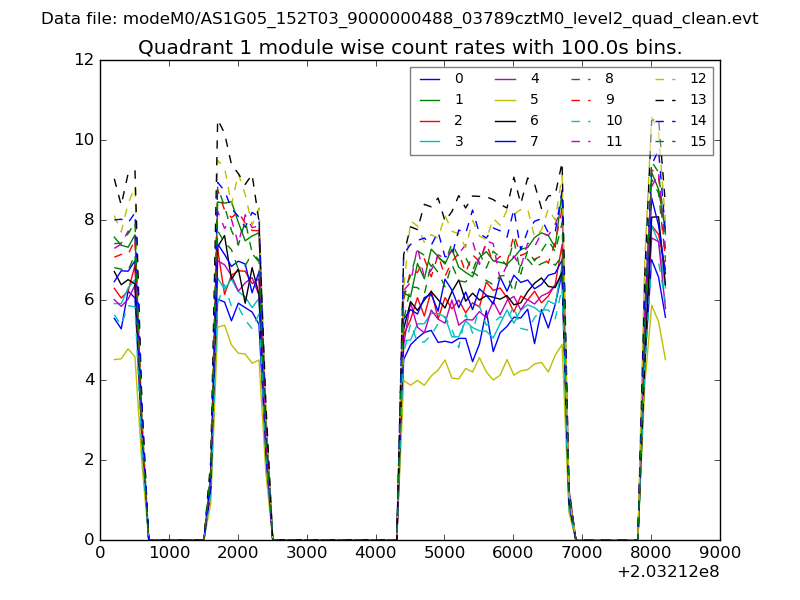
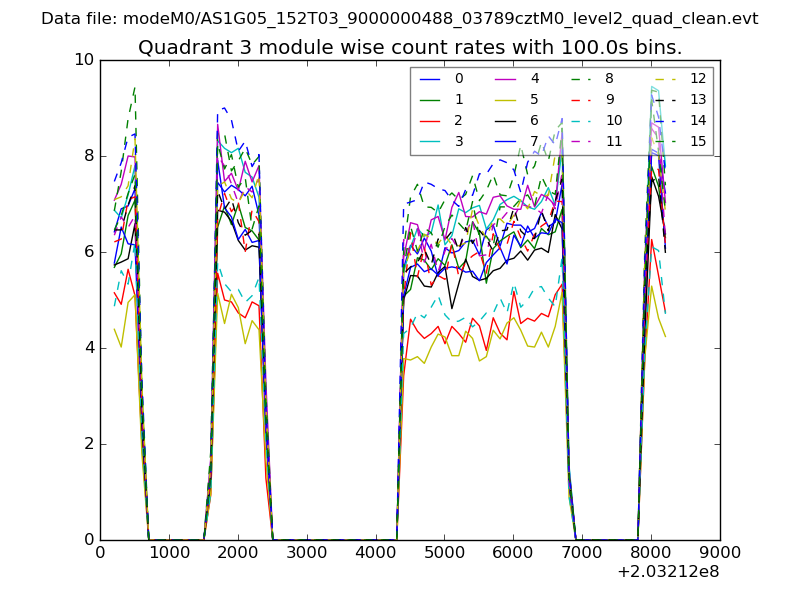
| Module-wise count rates for Quadrant A Data is divided into 100 sec bins |
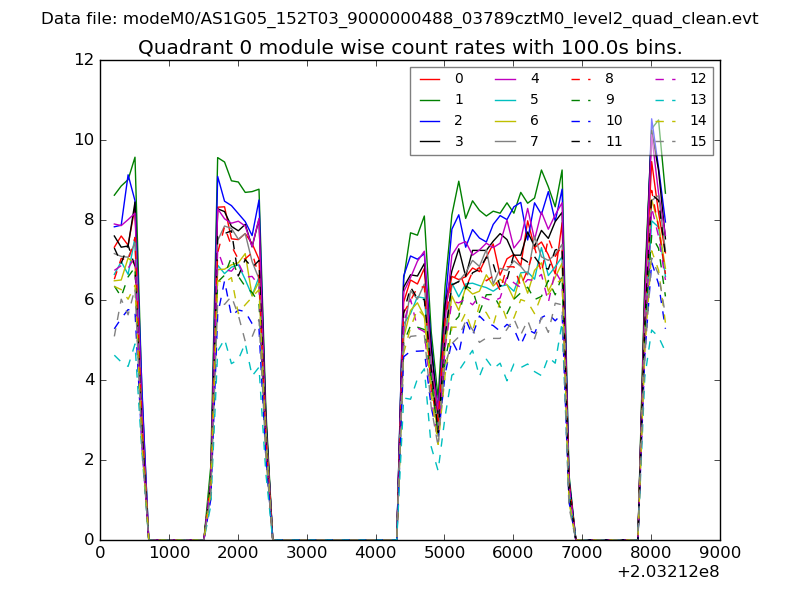 |
 |
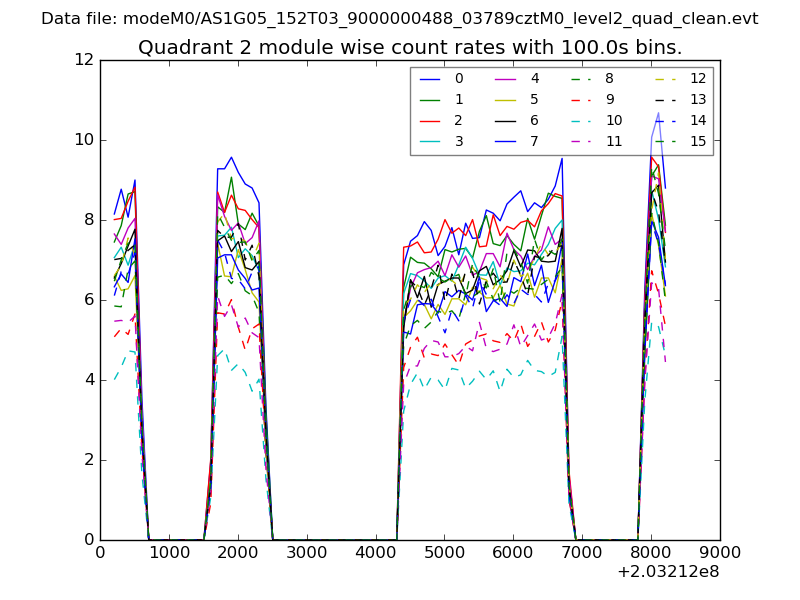
| Module-wise count rates for Quadrant B Data is divided into 100 sec bins |
 |
 |
| Module-wise count rates for Quadrant C Data is divided into 100 sec bins |
 |
 |
| Module-wise count rates for Quadrant D Data is divided into 100 sec bins |
 |
 |
| Parameter | Plot |
|---|---|
| CZT HV Monitor | 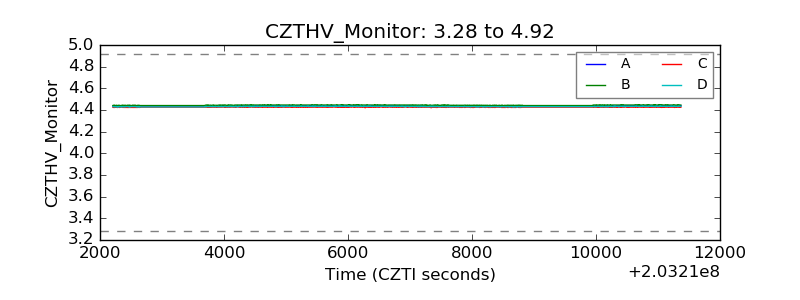 |
| D_VDD | 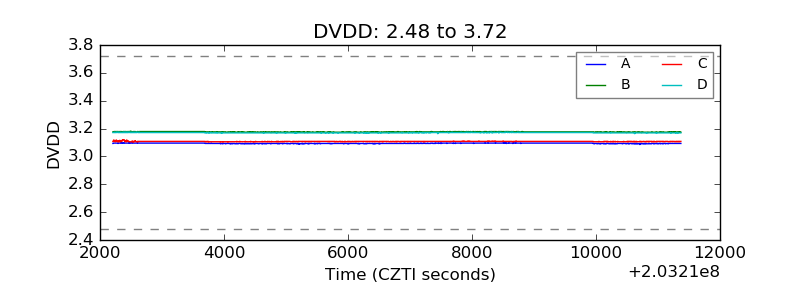 |
| Temperature 1 |  |
| Veto HV Monitor | 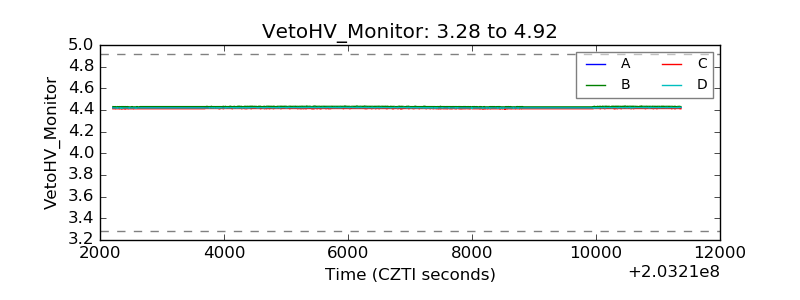 |
| Veto LLD |  |
| Alpha Counter | 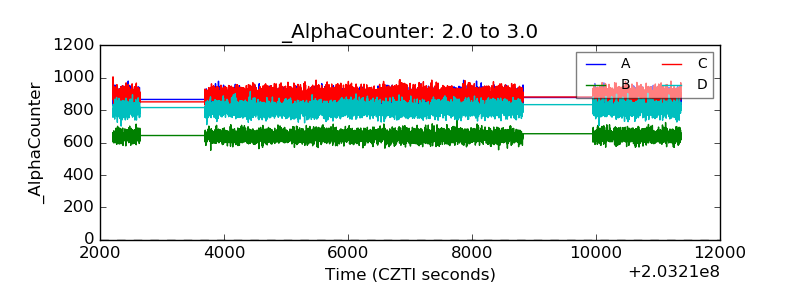 |
| _CPM_Rate | 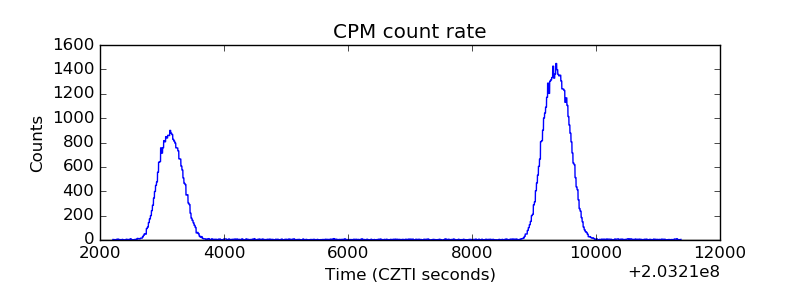 |
| CZT Counter | 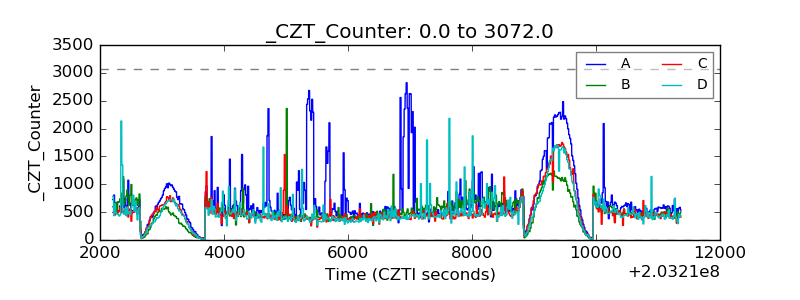 |
| +2.5 Volts monitor |  |
| +5 Volts monitor |  |
| Veto Counter | 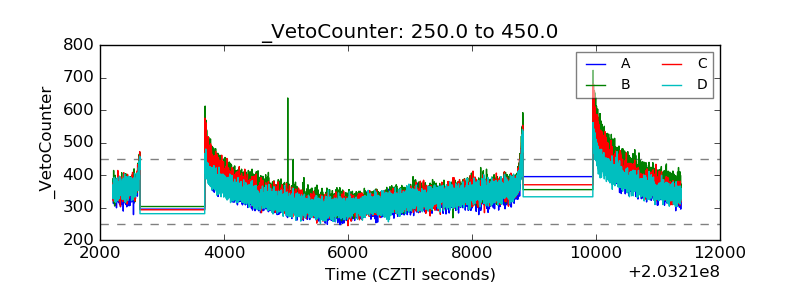 |