| Param | Original file | Final file |
|---|---|---|
| Filename | modeM0/AS1G05_152T03_9000000488_03790cztM0_level2.evt | modeM0/AS1G05_152T03_9000000488_03790cztM0_level2_quad_clean.evt |
| Size (bytes) | 452,289,600 | 58,124,160 |
| Size | 431.3 MB | 55.4 MB |
| Events in quadrant A | 3,764,794 | 331,752 |
| Events in quadrant B | 3,453,531 | 335,267 |
| Events in quadrant C | 2,987,610 | 329,098 |
| Events in quadrant D | 3,057,425 | 317,550 |
| Mode M9 | |||
|---|---|---|---|
| Quadrant | BADHDUFLAG | Total packets | Discarded packets |
| A | 0 | 19 | 0 |
| B | 0 | 19 | 0 |
| C | 0 | 19 | 0 |
| D | 0 | 20 | 0 |
| Mode SS | |||
|---|---|---|---|
| Quadrant | BADHDUFLAG | Total packets | Discarded packets |
| A | 0 | 130 | 0 |
| B | 0 | 130 | 0 |
| C | 0 | 130 | 0 |
| D | 0 | 130 | 0 |
| Mode M0 | |||
|---|---|---|---|
| Quadrant | BADHDUFLAG | Total packets | Discarded packets |
| A | 0 | 15111 | 3 |
| B | 0 | 14339 | 2 |
| C | 0 | 13210 | 2 |
| D | 0 | 13628 | 2 |
| Quadrant | Total seconds | Saturated seconds | Saturation percentage |
|---|---|---|---|
| A | 6391 | 93 | 1.455171% |
| B | 6391 | 74 | 1.157878% |
| C | 6391 | 37 | 0.578939% |
| D | 6391 | 53 | 0.829291% |
Noise dominated data is calculated using 1-second bins in cleaned event files. If a bin has >2000 counts, and if more than 50% of those come from <1% of pixels, then it is considered to be noise-dominated and hence unusable.
| Quadrant | # 1 sec bins | Bins with >0 counts | Bins with >2000 counts | High rate bins dominated by noise | Noise dominated (total time) | Noise dominated (detector-on time) | Marked lightcurve |
|---|---|---|---|---|---|---|---|
| A | 7616 | 6391 | 43 | 43 | 0.56% | 0.67% | 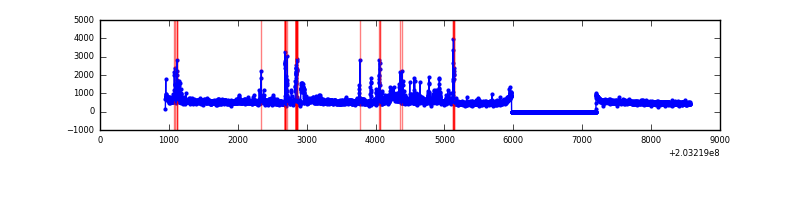 |
| B | 7616 | 6391 | 19 | 19 | 0.25% | 0.30% | 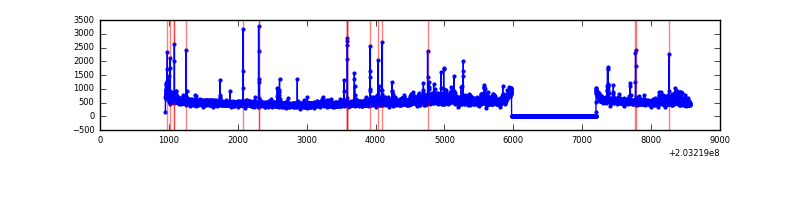 |
| C | 7616 | 6392 | 10 | 10 | 0.13% | 0.16% | 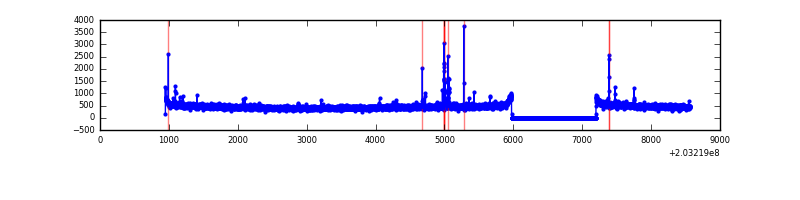 |
| D | 7616 | 6391 | 29 | 29 | 0.38% | 0.45% | 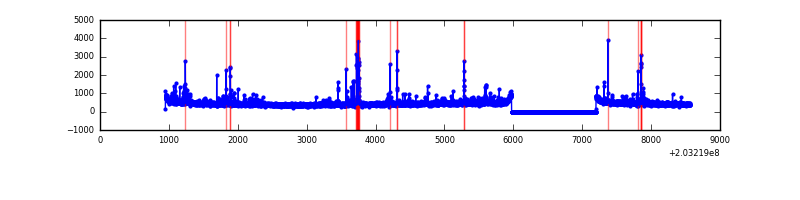 |
Top three noisy pixels from each quadrant. If the there are fewer than three noisy pixels in the level2.evt file, extra rows are filled as -1
| Pixel properties | Quadrant properties | ||||||
|---|---|---|---|---|---|---|---|
| Quadrant | DetID | PixID | Counts | Sigma | Mean | Median | Sigma |
| A | 13 | 251 | 429755 | 2738.44 | 768 | 752 | 156.7 |
| A | 0 | 118 | 169631 | 1078.0 | 768 | 752 | 156.7 |
| A | 15 | 174 | 106595 | 675.62 | 768 | 752 | 156.7 |
| B | 15 | 204 | 236052 | 1579.61 | 784 | 765 | 149.0 |
| B | 0 | 173 | 44203 | 291.62 | 784 | 765 | 149.0 |
| B | 5 | 200 | 39273 | 258.53 | 784 | 765 | 149.0 |
| C | 1 | 16 | 58073 | 331.52 | 744 | 748 | 172.9 |
| C | 12 | 4 | 11399 | 61.6 | 744 | 748 | 172.9 |
| C | 10 | 65 | 6555 | 33.58 | 744 | 748 | 172.9 |
| D | 13 | 223 | 66702 | 372.82 | 738 | 717 | 177.0 |
| D | 8 | 112 | 43184 | 239.94 | 738 | 717 | 177.0 |
| D | 13 | 239 | 35022 | 193.83 | 738 | 717 | 177.0 |
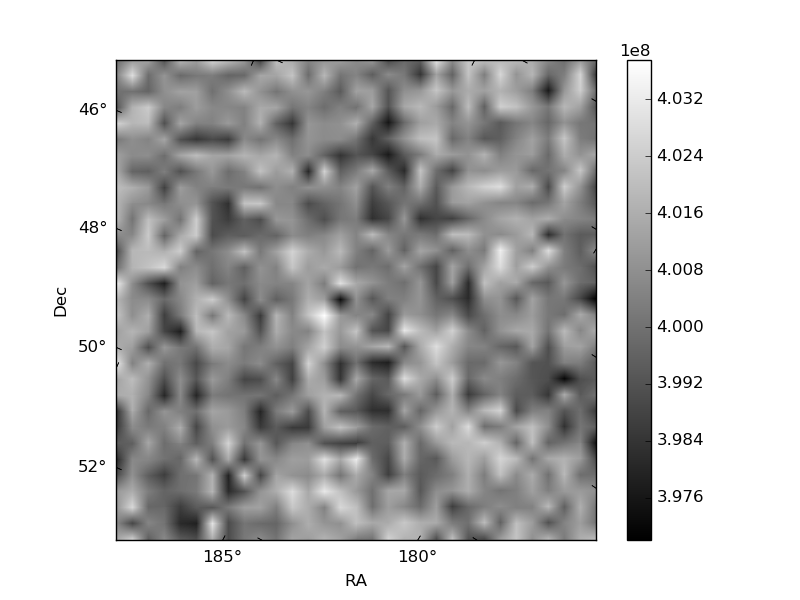
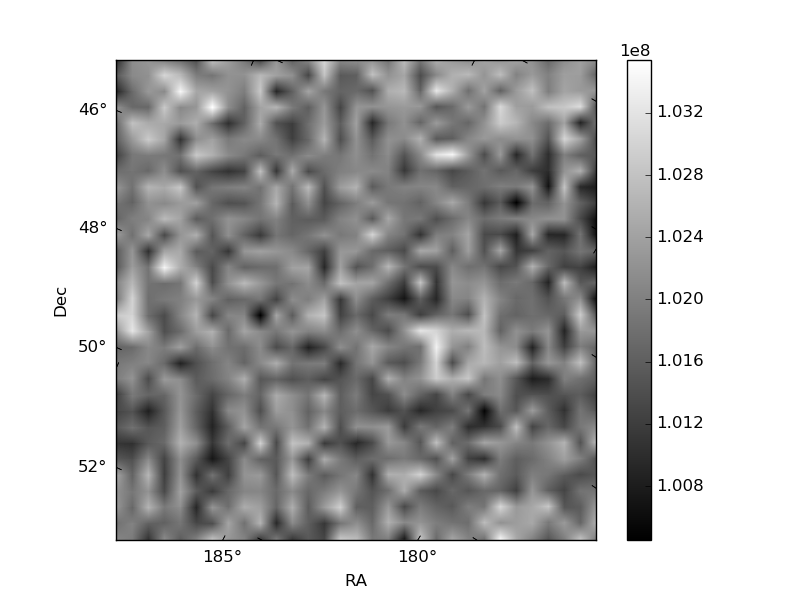
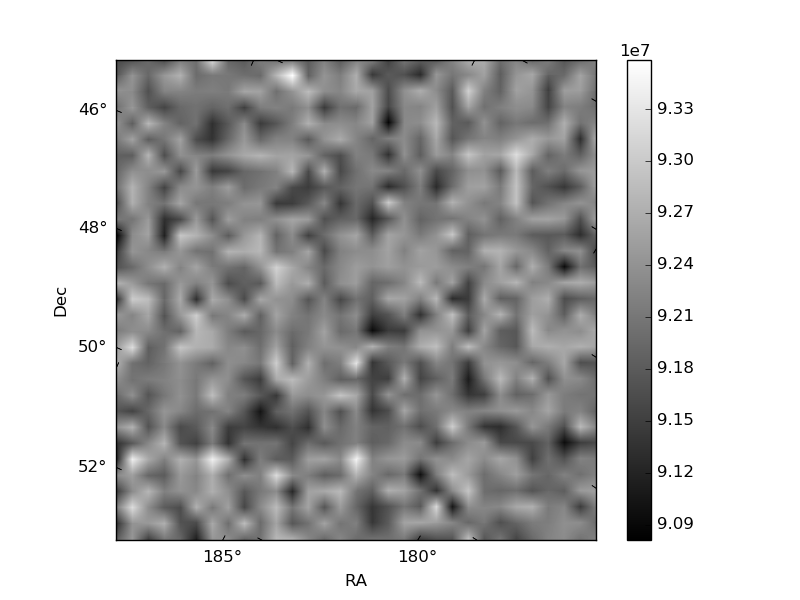
Histogram calculated using DETX and DETY for each event in the final _common_clean file
| Quadrant A | 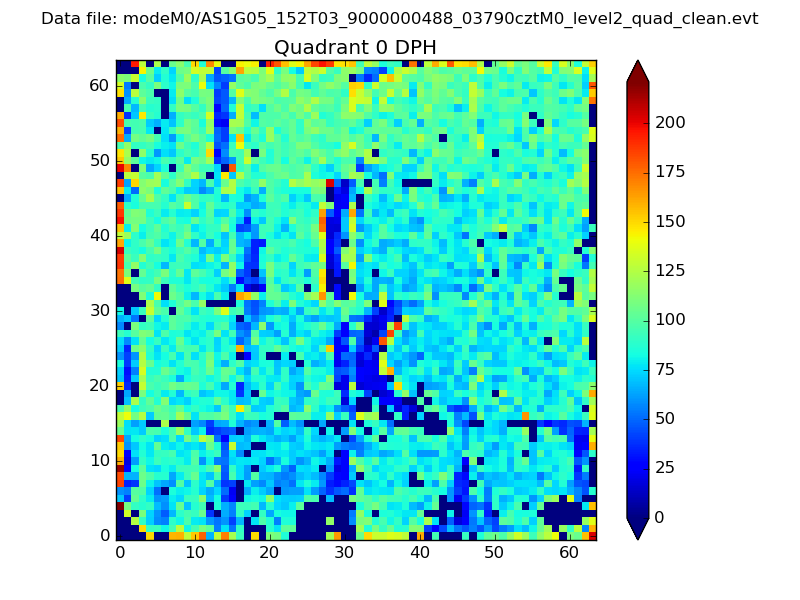 |
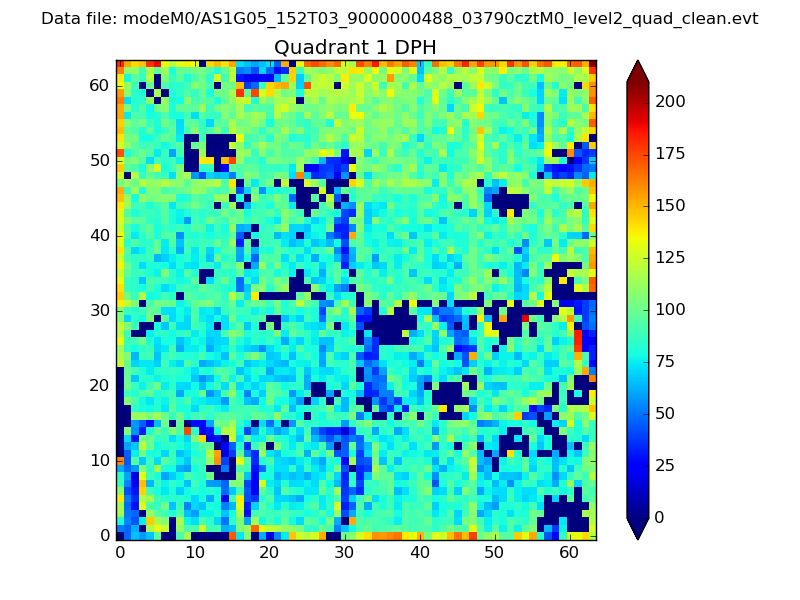 |
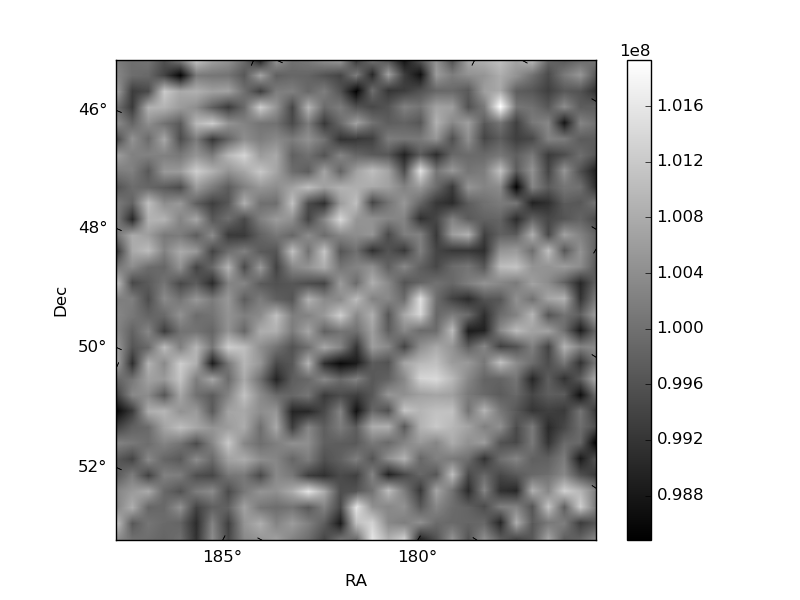
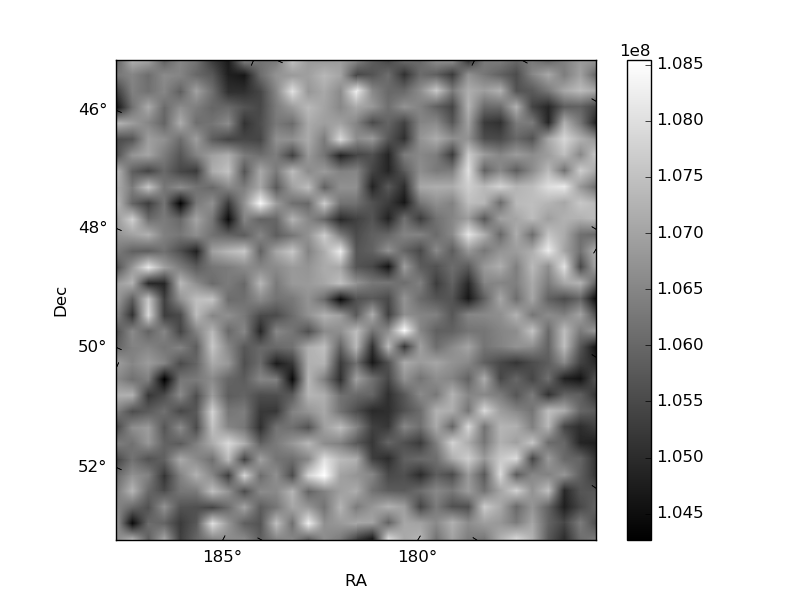
Quadrant B |
|---|---|---|---|
| Quadrant D | 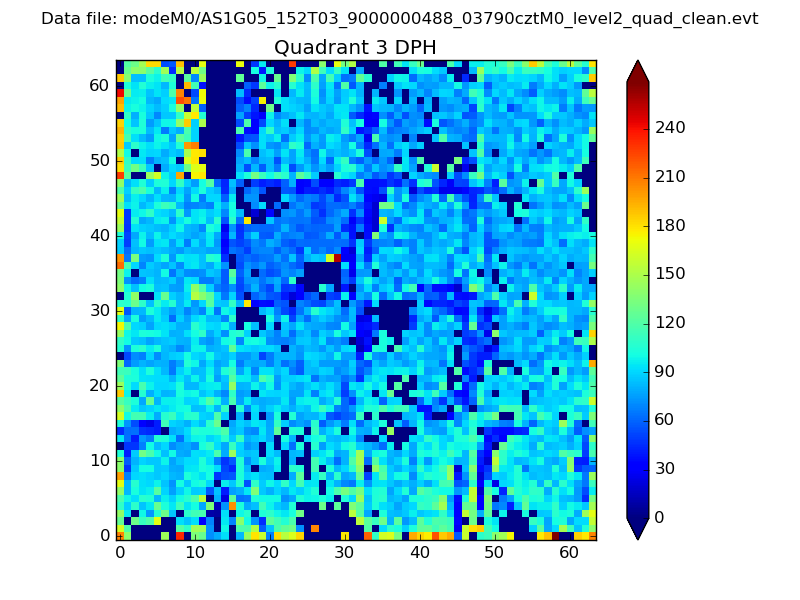 |
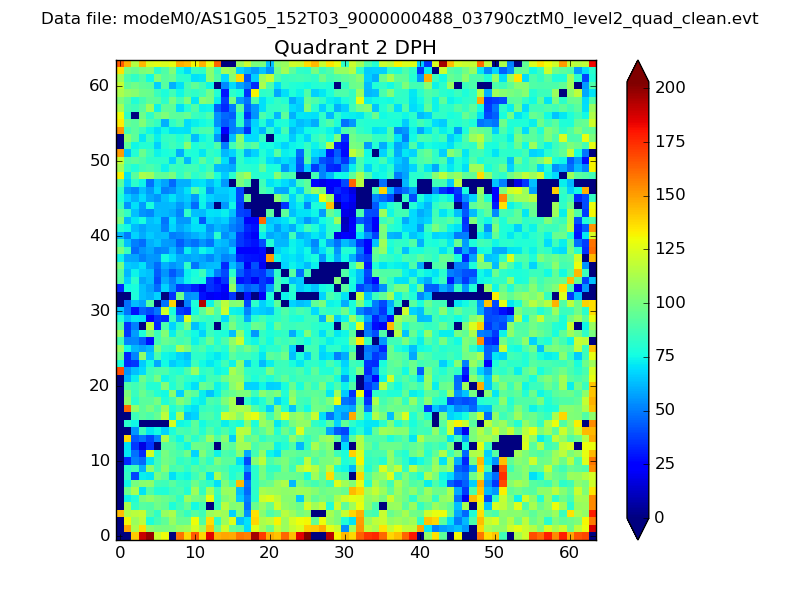 |
Quadrant C |
| Plot type | Count rate plots | Images |
|---|---|---|
| Comparison with Poisson distribution Blue bars denote a histogram of data divided into 1 sec bins. Red curve is a Poisson curve with rate = median count rate of data. |
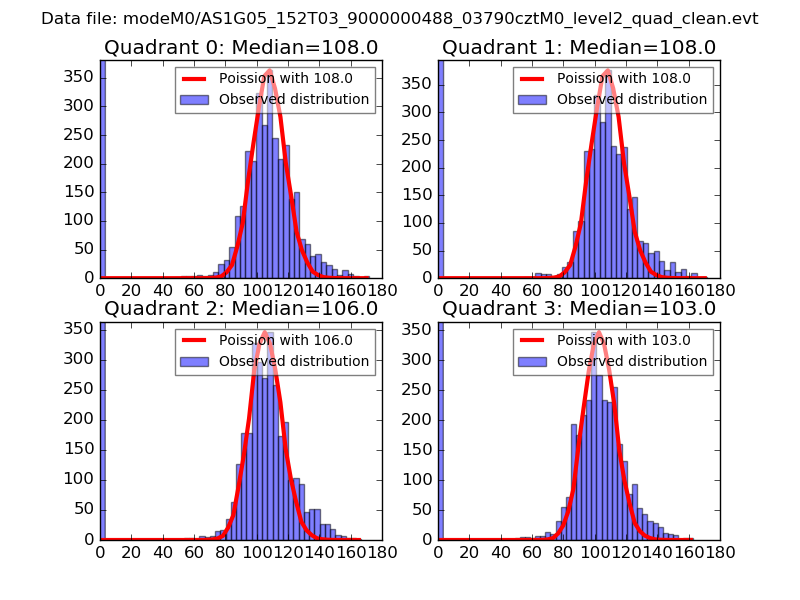 |
 |
| Quadrant-wise count rates Data is divided into 100 sec bins |
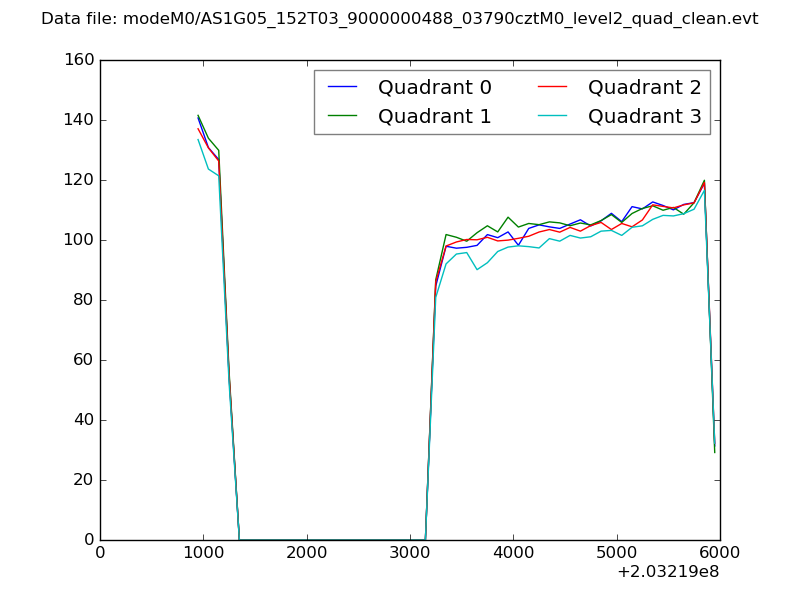 |
|
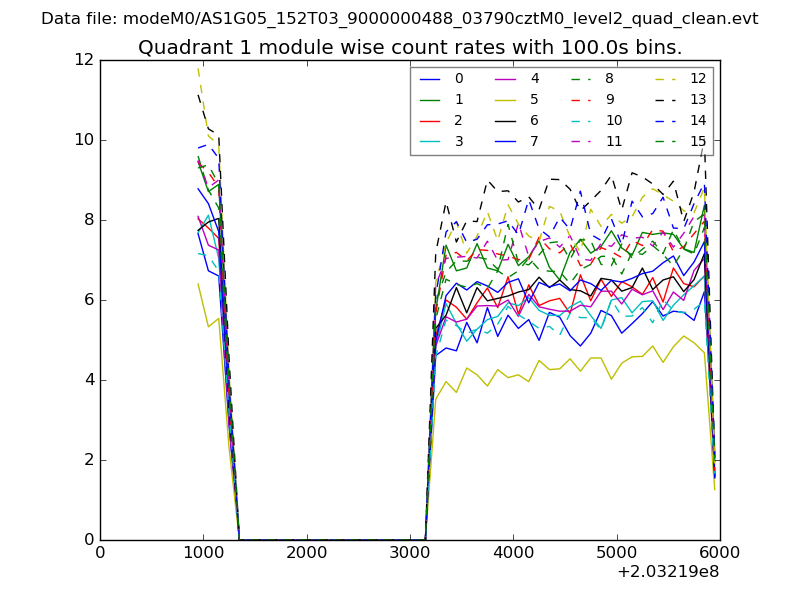
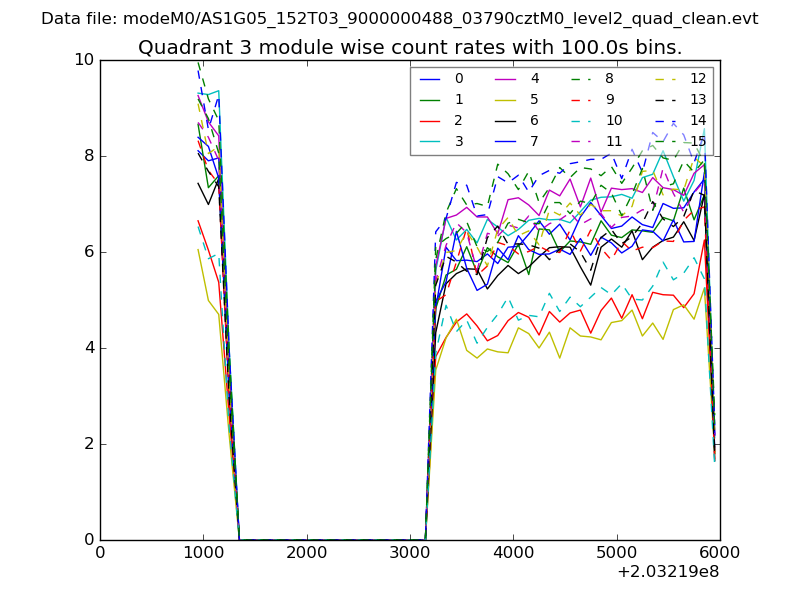
| Module-wise count rates for Quadrant A Data is divided into 100 sec bins |
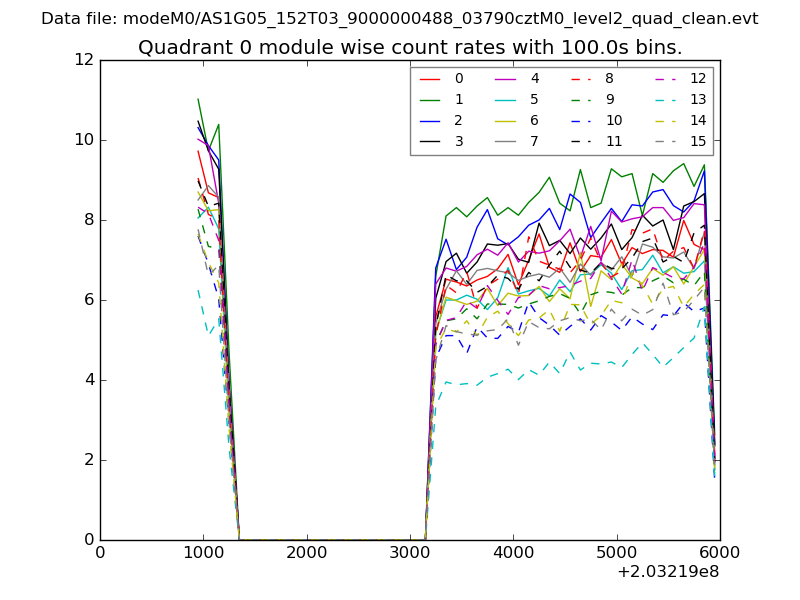 |
 |
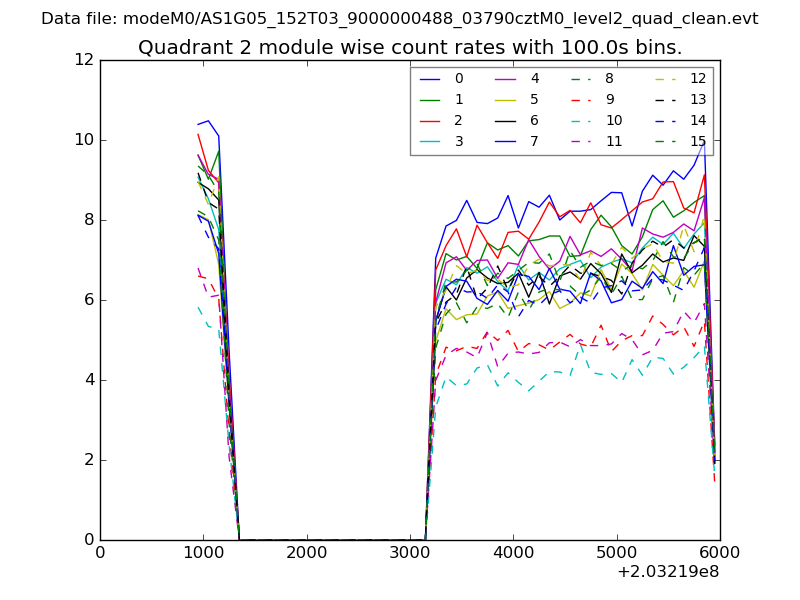
| Module-wise count rates for Quadrant B Data is divided into 100 sec bins |
 |
 |
| Module-wise count rates for Quadrant C Data is divided into 100 sec bins |
 |
 |
| Module-wise count rates for Quadrant D Data is divided into 100 sec bins |
 |
 |
| Parameter | Plot |
|---|---|
| CZT HV Monitor | 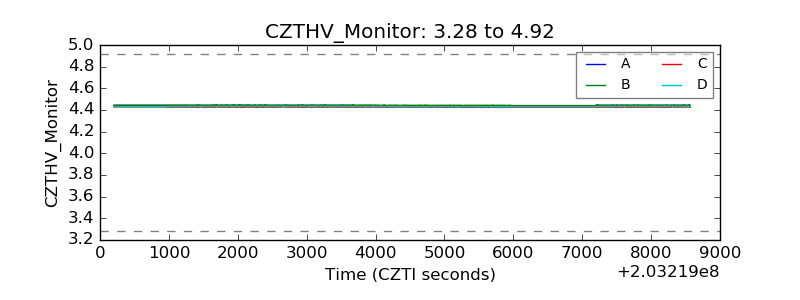 |
| D_VDD | 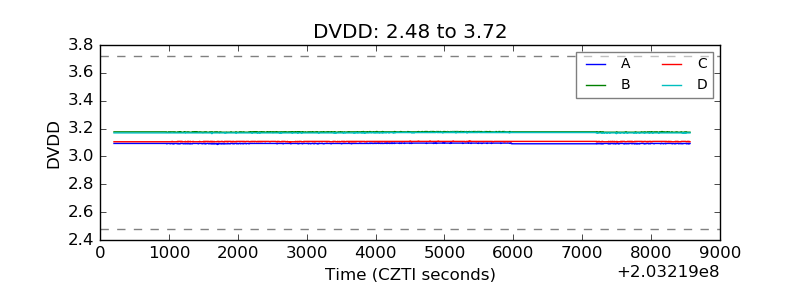 |
| Temperature 1 | 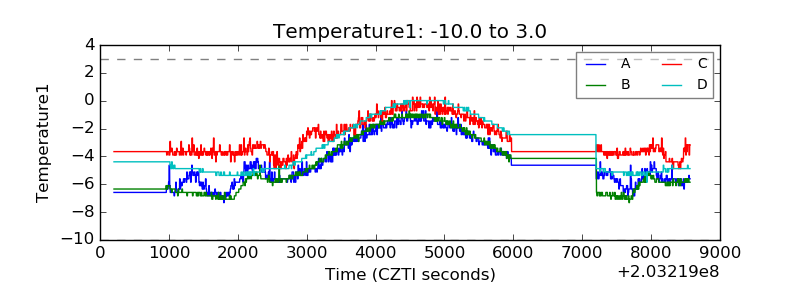 |
| Veto HV Monitor | 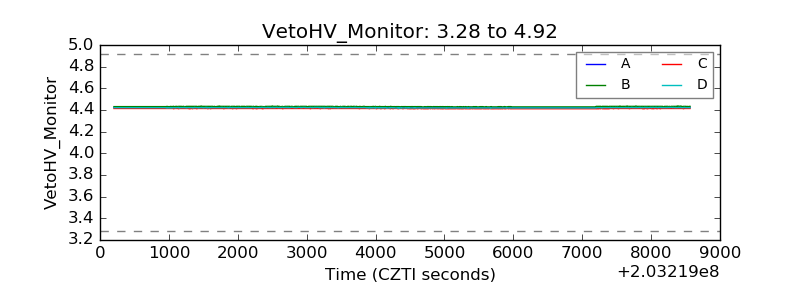 |
| Veto LLD | 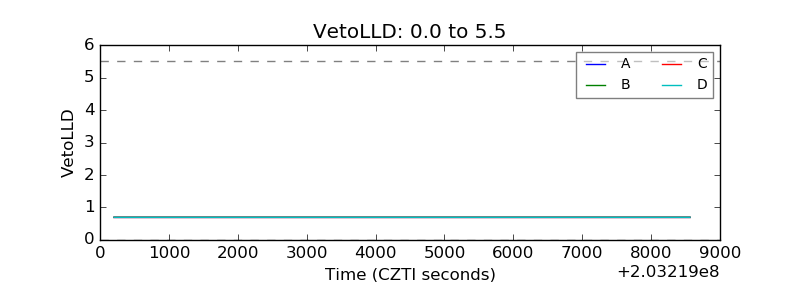 |
| Alpha Counter | 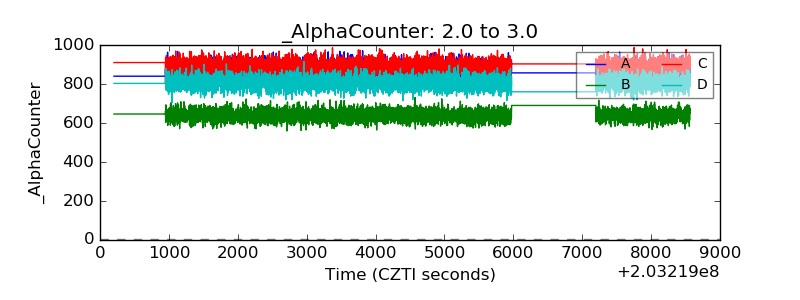 |
| _CPM_Rate | 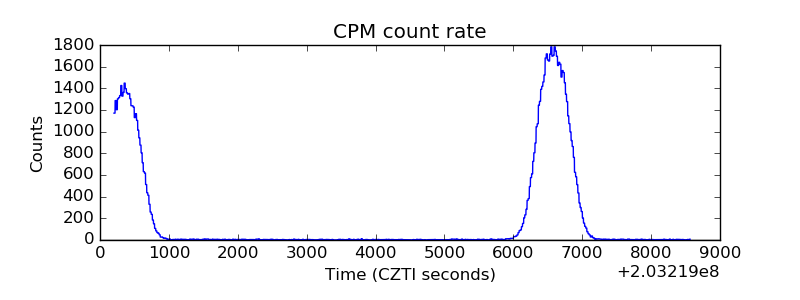 |
| CZT Counter | 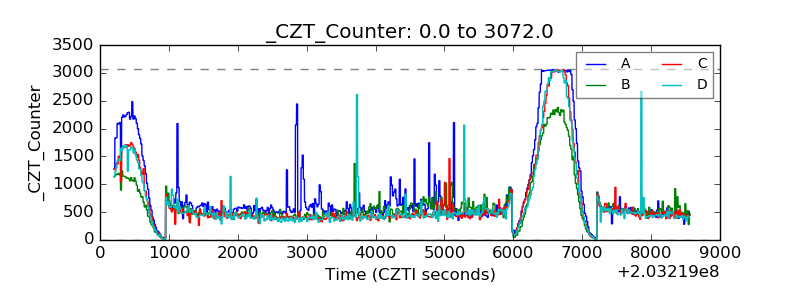 |
| +2.5 Volts monitor |  |
| +5 Volts monitor |  |
| Veto Counter | 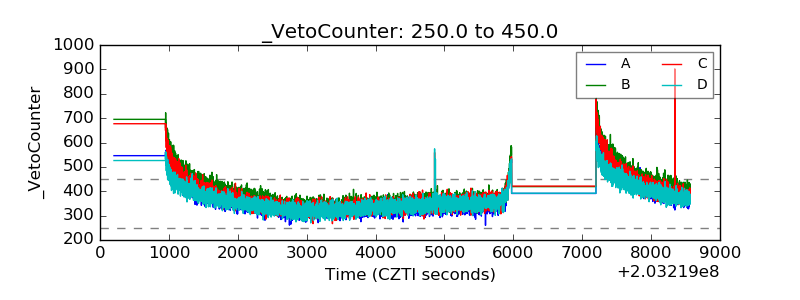 |