| Param | Original file | Final file |
|---|---|---|
| Filename | modeM0/AS1G05_152T03_9000000488_03792cztM0_level2.evt | modeM0/AS1G05_152T03_9000000488_03792cztM0_level2_quad_clean.evt |
| Size (bytes) | 514,794,240 | 68,247,360 |
| Size | 490.9 MB | 65.1 MB |
| Events in quadrant A | 3,481,255 | 414,893 |
| Events in quadrant B | 3,724,263 | 416,890 |
| Events in quadrant C | 4,522,123 | 399,336 |
| Events in quadrant D | 3,431,952 | 392,057 |
| Mode M9 | |||
|---|---|---|---|
| Quadrant | BADHDUFLAG | Total packets | Discarded packets |
| A | 0 | 21 | 0 |
| B | 0 | 21 | 0 |
| C | 0 | 21 | 0 |
| D | 0 | 22 | 0 |
| Mode SS | |||
|---|---|---|---|
| Quadrant | BADHDUFLAG | Total packets | Discarded packets |
| A | 0 | 128 | 0 |
| B | 0 | 128 | 0 |
| C | 0 | 128 | 0 |
| D | 0 | 128 | 0 |
| Mode M0 | |||
|---|---|---|---|
| Quadrant | BADHDUFLAG | Total packets | Discarded packets |
| A | 0 | 14233 | 3 |
| B | 0 | 14925 | 2 |
| C | 0 | 17555 | 2 |
| D | 0 | 14401 | 2 |
| Quadrant | Total seconds | Saturated seconds | Saturation percentage |
|---|---|---|---|
| A | 6355 | 156 | 2.454760% |
| B | 6355 | 138 | 2.171518% |
| C | 6355 | 335 | 5.271440% |
| D | 6355 | 128 | 2.014162% |
Noise dominated data is calculated using 1-second bins in cleaned event files. If a bin has >2000 counts, and if more than 50% of those come from <1% of pixels, then it is considered to be noise-dominated and hence unusable.
| Quadrant | # 1 sec bins | Bins with >0 counts | Bins with >2000 counts | High rate bins dominated by noise | Noise dominated (total time) | Noise dominated (detector-on time) | Marked lightcurve |
|---|---|---|---|---|---|---|---|
| A | 7635 | 6355 | 37 | 37 | 0.48% | 0.58% | 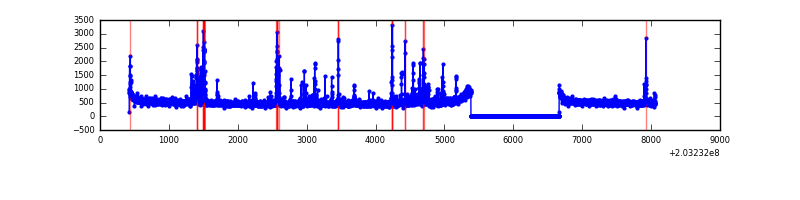 |
| B | 7635 | 6355 | 11 | 11 | 0.14% | 0.17% | 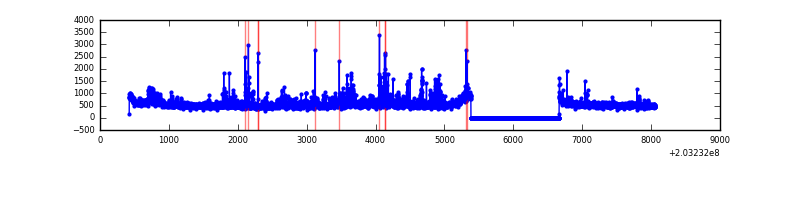 |
| C | 7635 | 6355 | 243 | 243 | 3.18% | 3.82% | 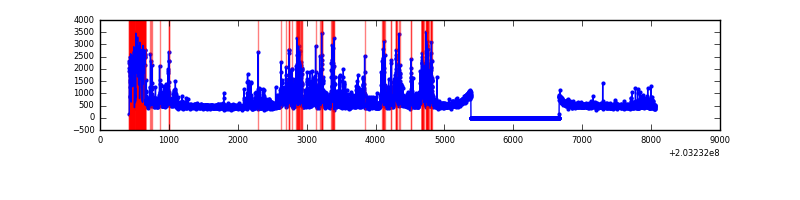 |
| D | 7635 | 6355 | 37 | 37 | 0.48% | 0.58% | 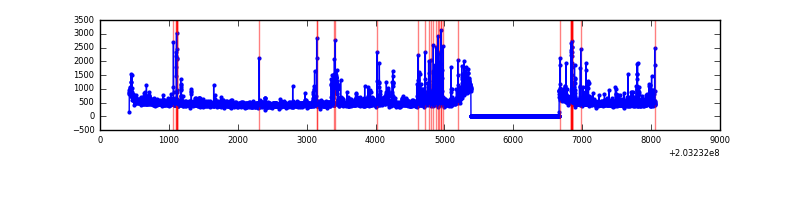 |
Top three noisy pixels from each quadrant. If the there are fewer than three noisy pixels in the level2.evt file, extra rows are filled as -1
| Pixel properties | Quadrant properties | ||||||
|---|---|---|---|---|---|---|---|
| Quadrant | DetID | PixID | Counts | Sigma | Mean | Median | Sigma |
| A | 0 | 118 | 155677 | 946.87 | 805 | 789 | 163.6 |
| A | 0 | 50 | 107019 | 649.41 | 805 | 789 | 163.6 |
| A | 15 | 174 | 48586 | 292.19 | 805 | 789 | 163.6 |
| B | 15 | 204 | 237327 | 1526.97 | 813 | 796 | 154.9 |
| B | 14 | 167 | 117463 | 753.17 | 813 | 796 | 154.9 |
| B | 0 | 173 | 114006 | 730.85 | 813 | 796 | 154.9 |
| C | 2 | 53 | 1516273 | 8680.33 | 758 | 763 | 174.6 |
| C | 1 | 16 | 30115 | 168.12 | 758 | 763 | 174.6 |
| C | 13 | 61 | 6428 | 32.45 | 758 | 763 | 174.6 |
| D | 8 | 112 | 212114 | 1148.19 | 773 | 751 | 184.1 |
| D | 12 | 79 | 103304 | 557.1 | 773 | 751 | 184.1 |
| D | 1 | 84 | 56910 | 305.07 | 773 | 751 | 184.1 |
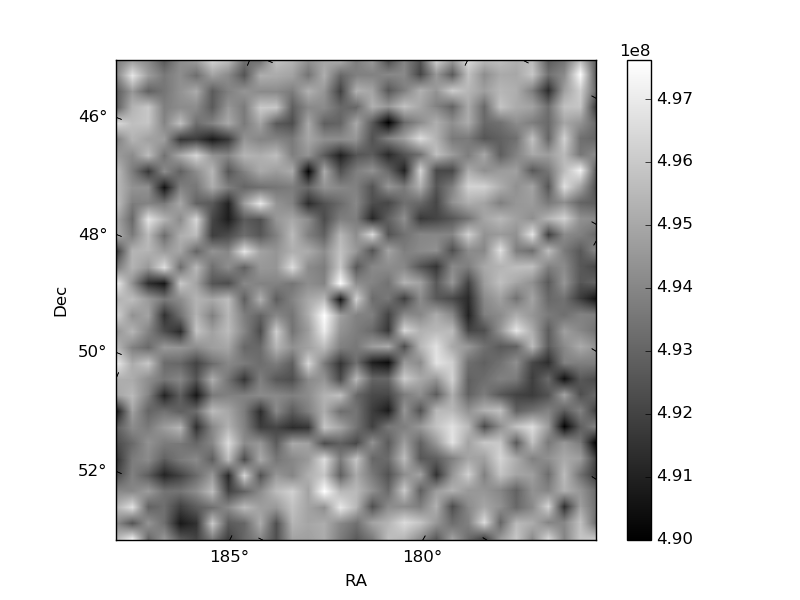
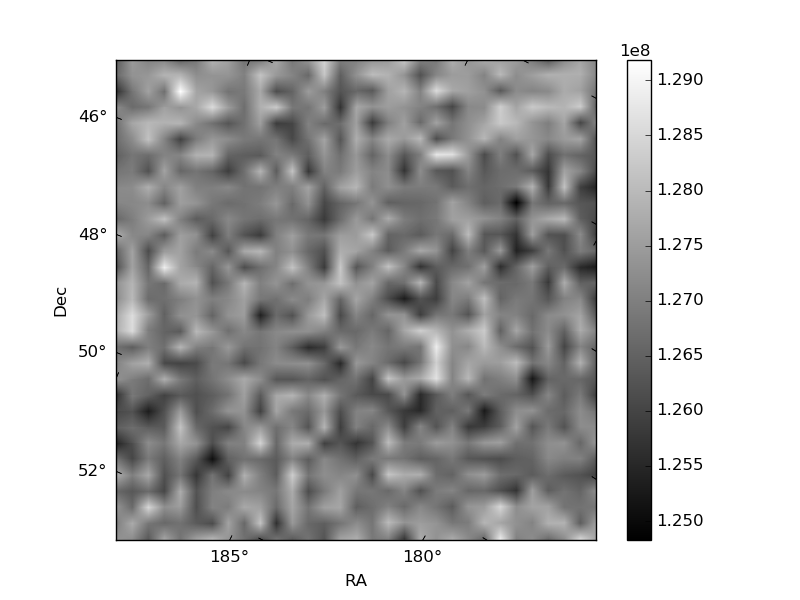
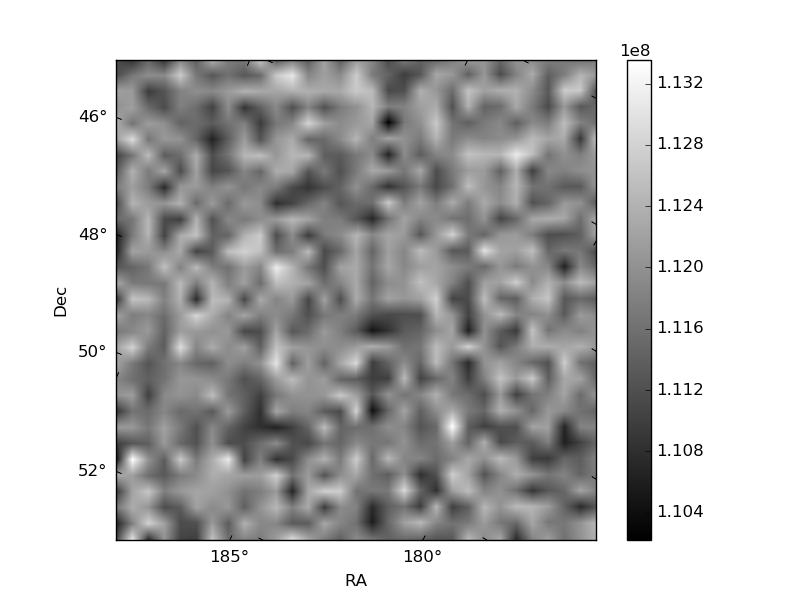
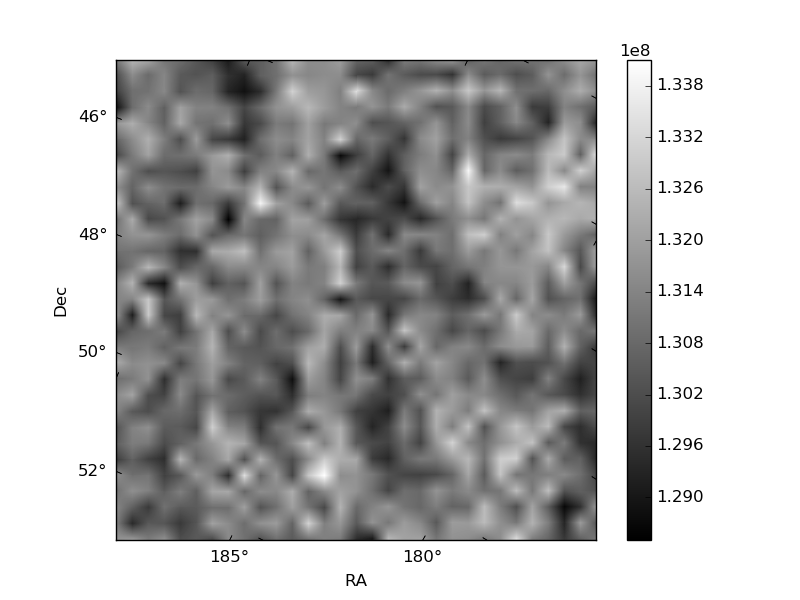
Histogram calculated using DETX and DETY for each event in the final _common_clean file
| Quadrant A | 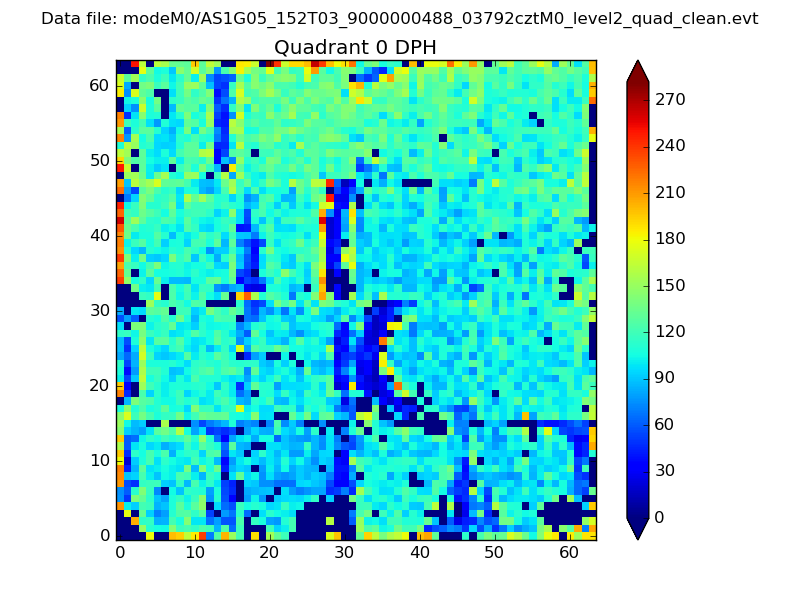 |
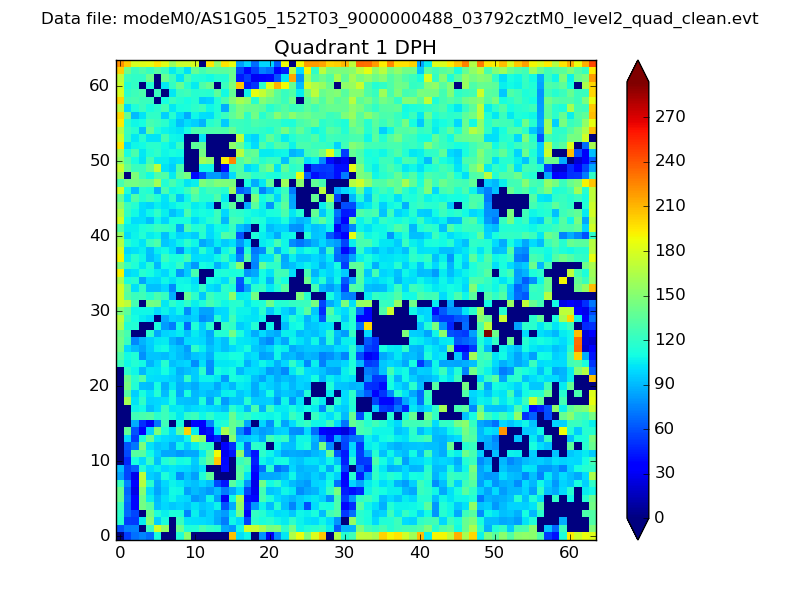 |
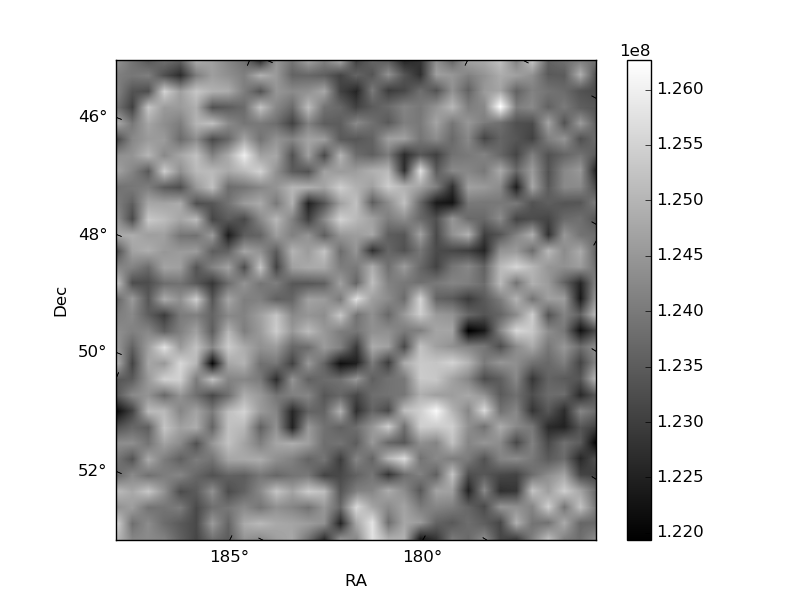
Quadrant B |
|---|---|---|---|
| Quadrant D | 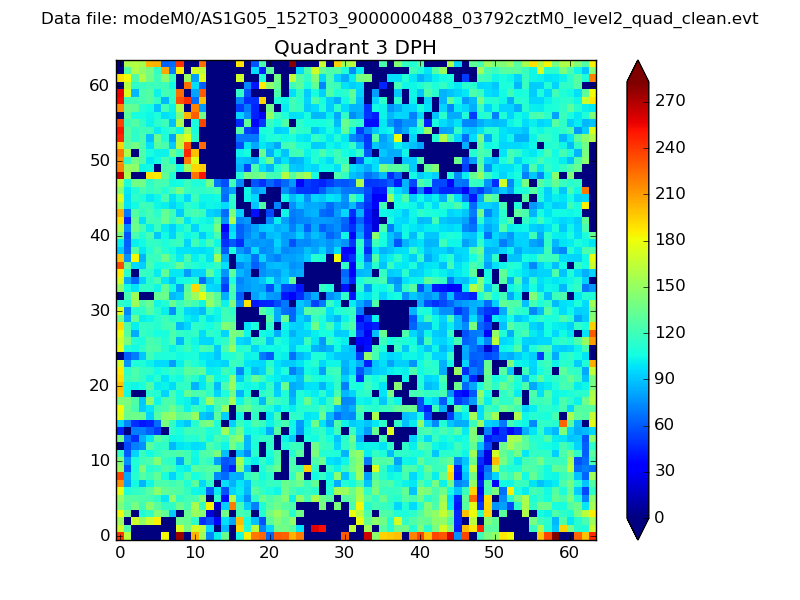 |
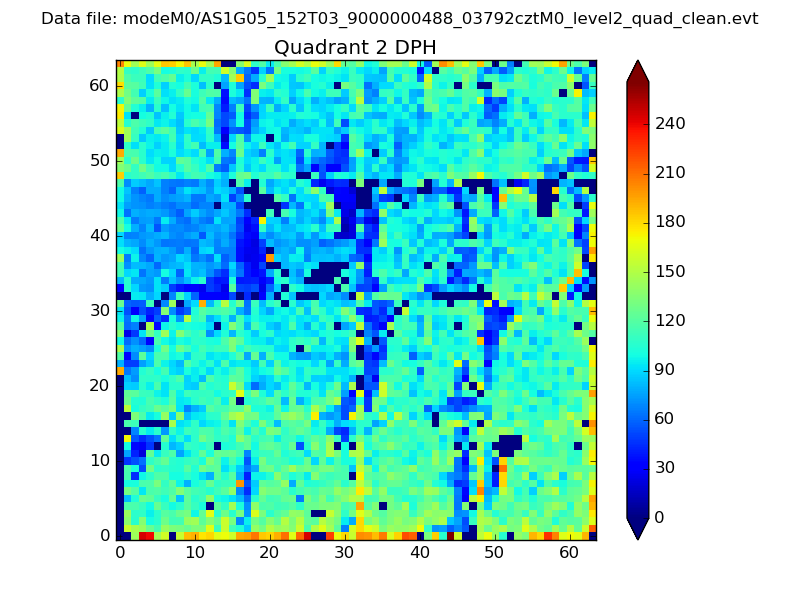 |
Quadrant C |
| Plot type | Count rate plots | Images |
|---|---|---|
| Comparison with Poisson distribution Blue bars denote a histogram of data divided into 1 sec bins. Red curve is a Poisson curve with rate = median count rate of data. |
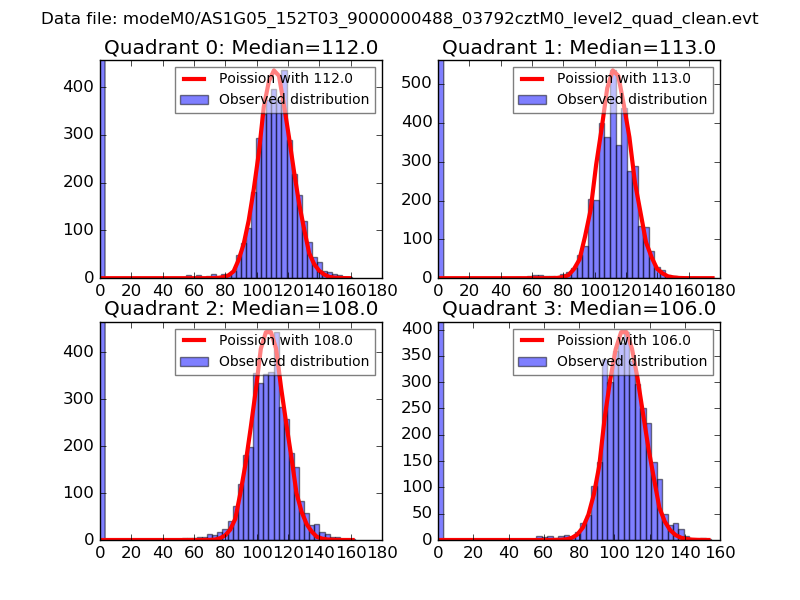 |
 |
| Quadrant-wise count rates Data is divided into 100 sec bins |
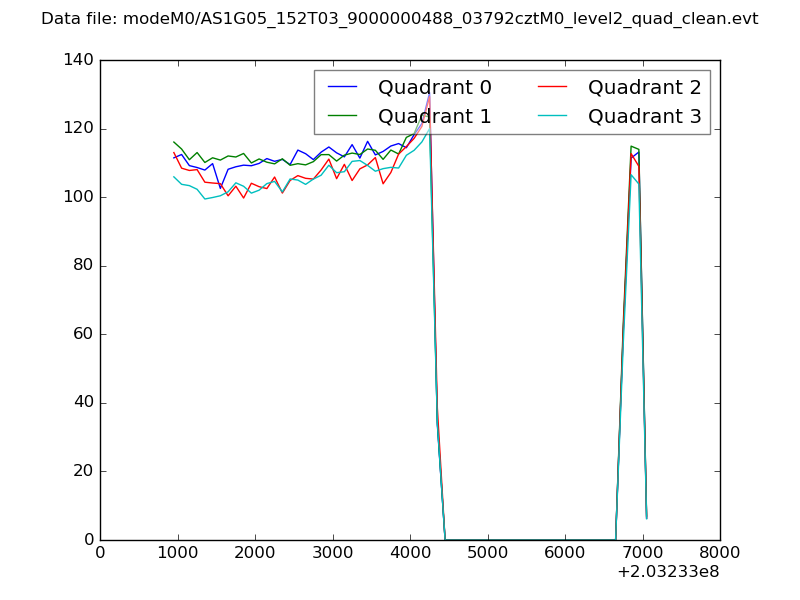 |
|
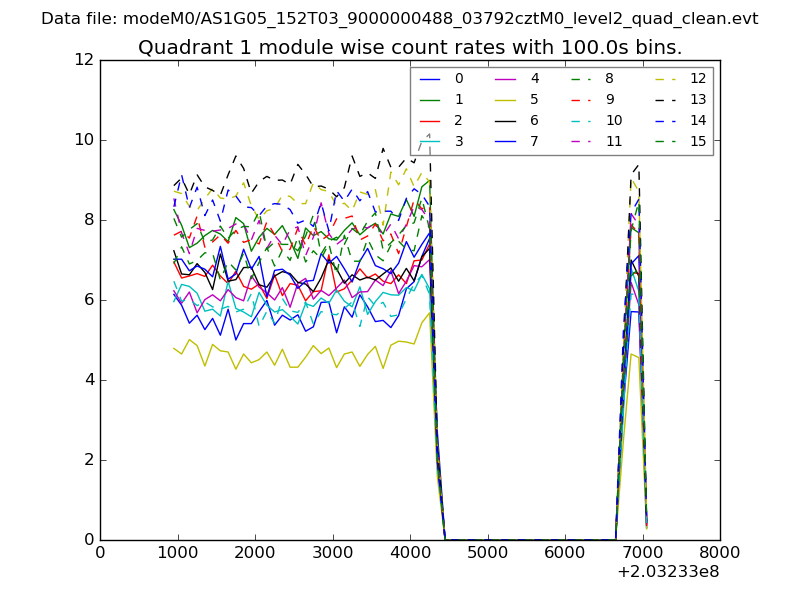
| Module-wise count rates for Quadrant A Data is divided into 100 sec bins |
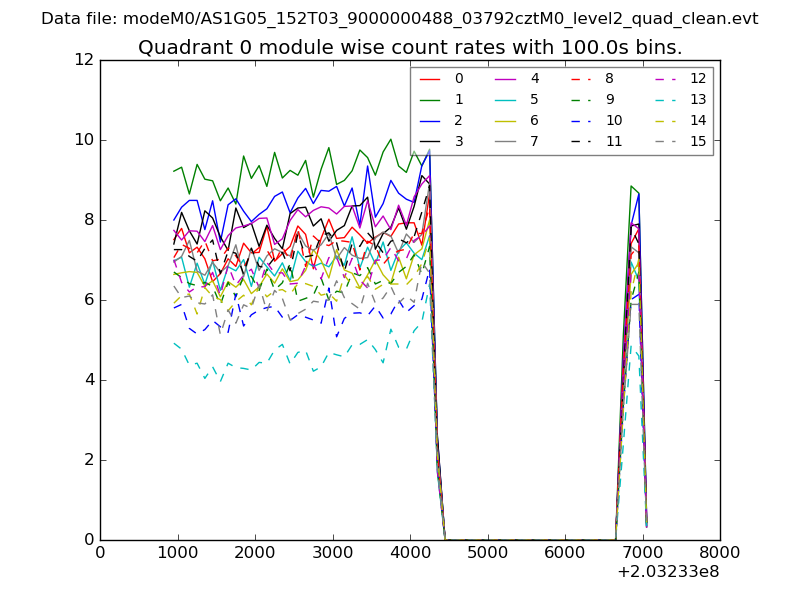 |
 |
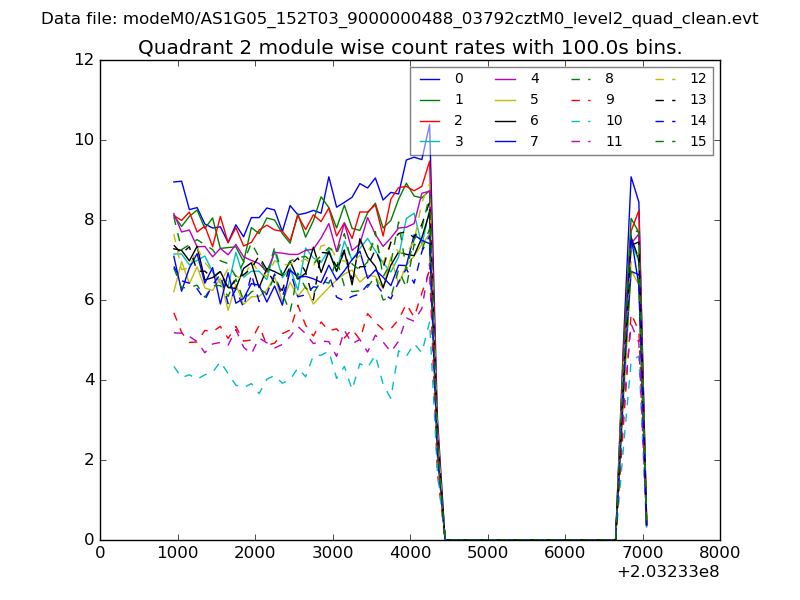
| Module-wise count rates for Quadrant B Data is divided into 100 sec bins |
 |
 |
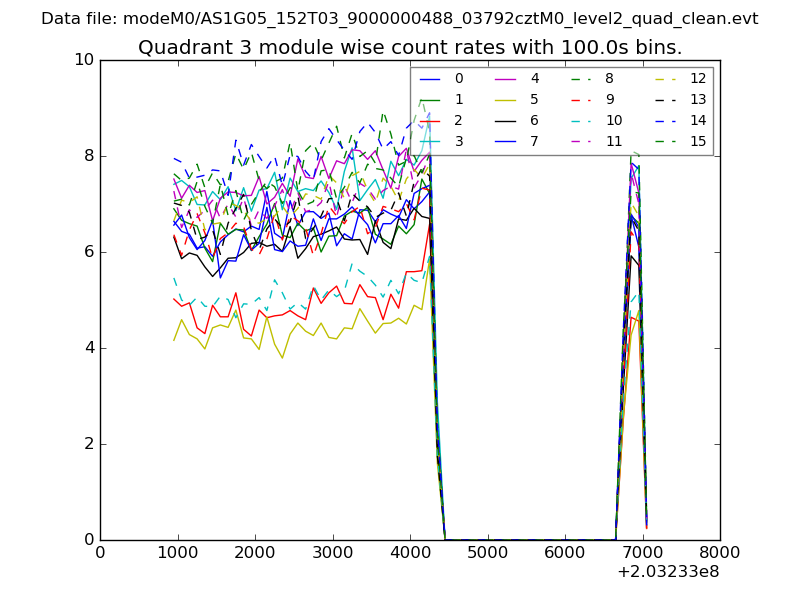
| Module-wise count rates for Quadrant C Data is divided into 100 sec bins |
 |
 |
| Module-wise count rates for Quadrant D Data is divided into 100 sec bins |
 |
 |
| Parameter | Plot |
|---|---|
| CZT HV Monitor | 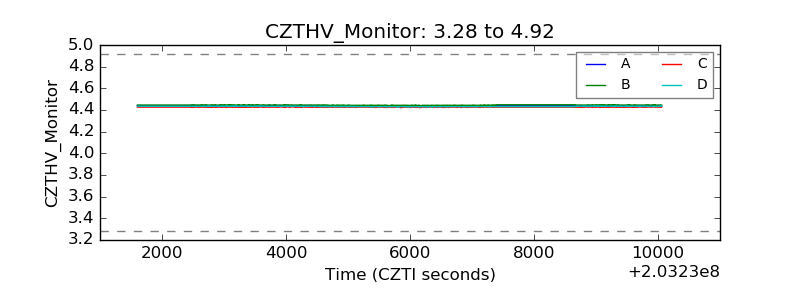 |
| D_VDD | 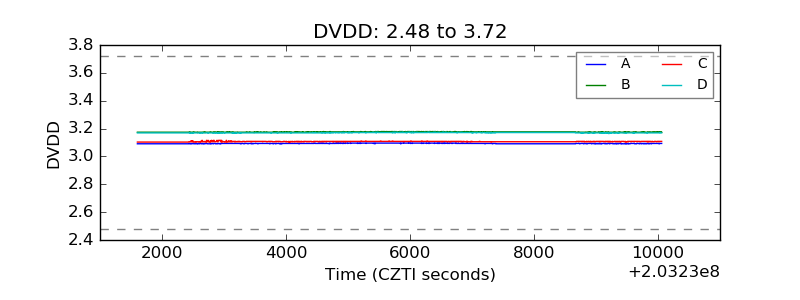 |
| Temperature 1 | 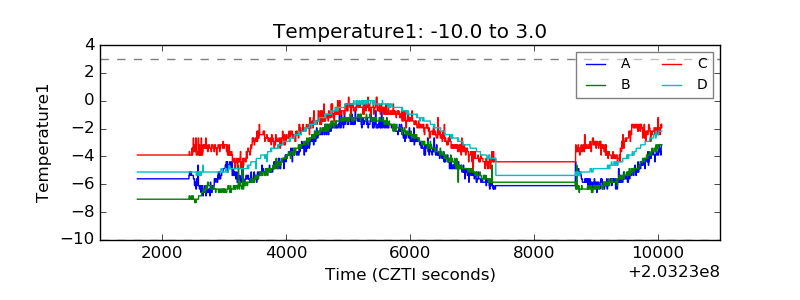 |
| Veto HV Monitor | 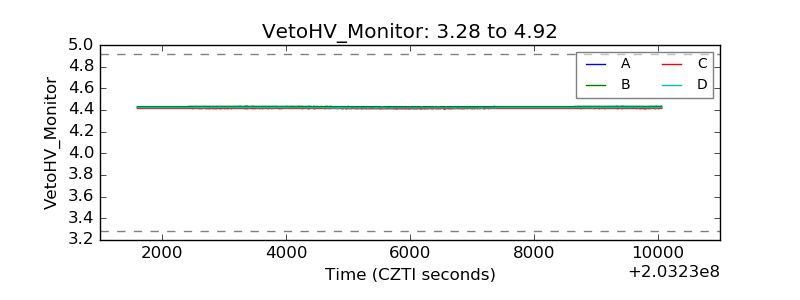 |
| Veto LLD | 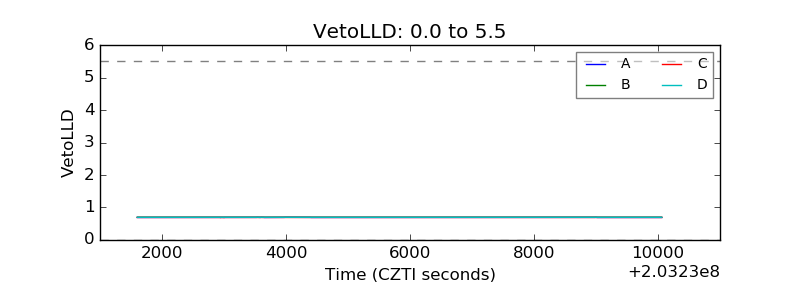 |
| Alpha Counter | 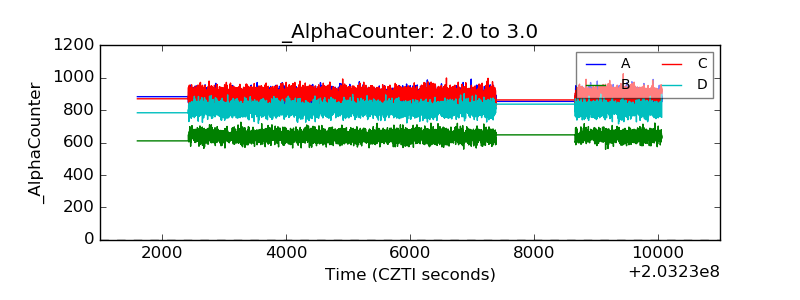 |
| _CPM_Rate | 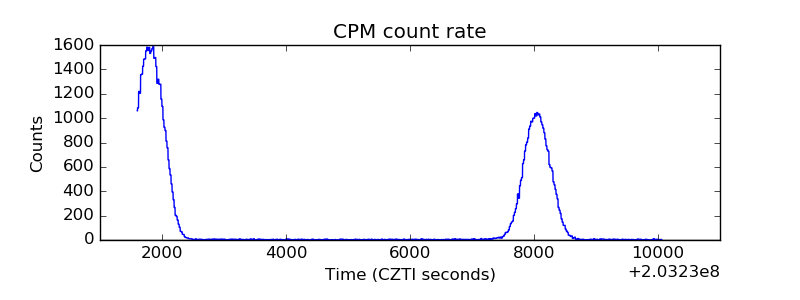 |
| CZT Counter | 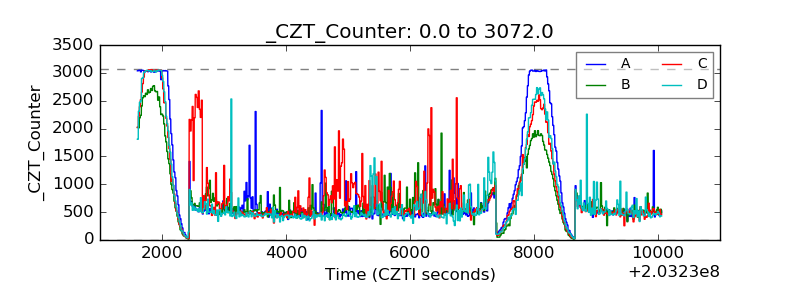 |
| +2.5 Volts monitor |  |
| +5 Volts monitor |  |
| Veto Counter | 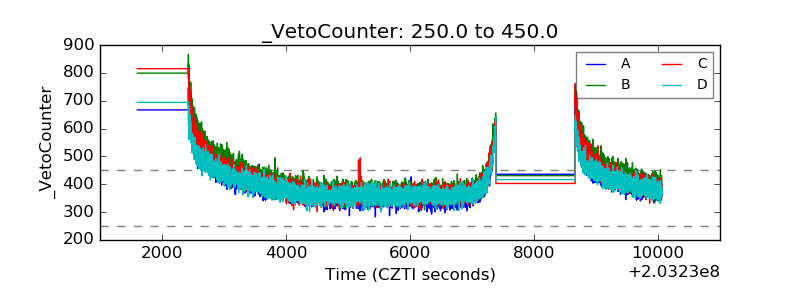 |