| Param | Original file | Final file |
|---|---|---|
| Filename | modeM0/AS1G05_152T03_9000000488_03793cztM0_level2.evt | modeM0/AS1G05_152T03_9000000488_03793cztM0_level2_quad_clean.evt |
| Size (bytes) | 524,093,760 | 80,003,520 |
| Size | 499.8 MB | 76.3 MB |
| Events in quadrant A | 3,501,623 | 507,578 |
| Events in quadrant B | 3,805,493 | 508,432 |
| Events in quadrant C | 4,134,344 | 482,328 |
| Events in quadrant D | 3,990,483 | 471,512 |
| Mode M9 | |||
|---|---|---|---|
| Quadrant | BADHDUFLAG | Total packets | Discarded packets |
| A | 0 | 16 | 0 |
| B | 0 | 16 | 0 |
| C | 0 | 16 | 0 |
| D | 0 | 17 | 0 |
| Mode SS | |||
|---|---|---|---|
| Quadrant | BADHDUFLAG | Total packets | Discarded packets |
| A | 0 | 132 | 0 |
| B | 0 | 132 | 0 |
| C | 0 | 132 | 0 |
| D | 0 | 132 | 0 |
| Mode M0 | |||
|---|---|---|---|
| Quadrant | BADHDUFLAG | Total packets | Discarded packets |
| A | 0 | 14401 | 3 |
| B | 0 | 15219 | 2 |
| C | 0 | 16530 | 2 |
| D | 0 | 16169 | 2 |
| Quadrant | Total seconds | Saturated seconds | Saturation percentage |
|---|---|---|---|
| A | 6487 | 182 | 2.805611% |
| B | 6487 | 200 | 3.083089% |
| C | 6487 | 401 | 6.181594% |
| D | 6487 | 275 | 4.239248% |
Noise dominated data is calculated using 1-second bins in cleaned event files. If a bin has >2000 counts, and if more than 50% of those come from <1% of pixels, then it is considered to be noise-dominated and hence unusable.
| Quadrant | # 1 sec bins | Bins with >0 counts | Bins with >2000 counts | High rate bins dominated by noise | Noise dominated (total time) | Noise dominated (detector-on time) | Marked lightcurve |
|---|---|---|---|---|---|---|---|
| A | 7672 | 6487 | 24 | 24 | 0.31% | 0.37% | 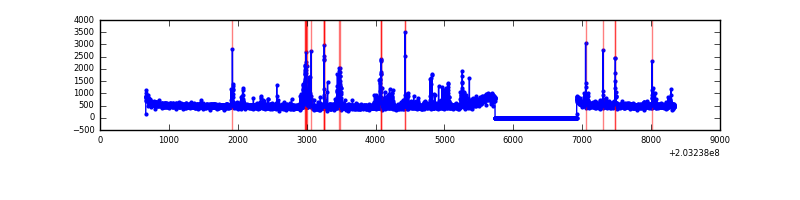 |
| B | 7672 | 6487 | 37 | 37 | 0.48% | 0.57% | 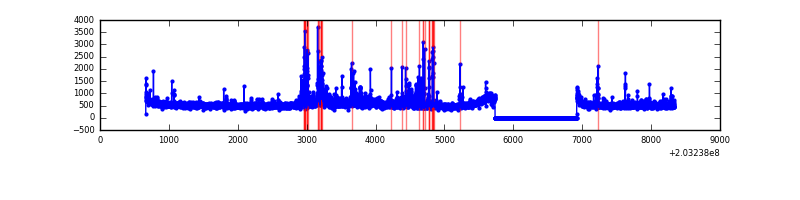 |
| C | 7672 | 6487 | 285 | 285 | 3.71% | 4.39% | 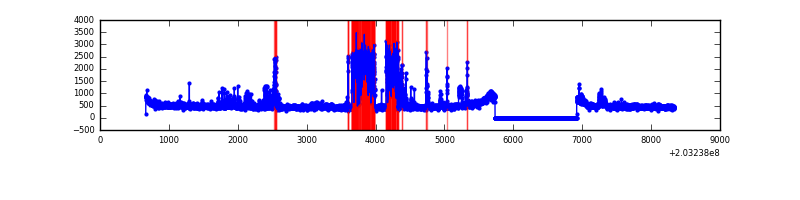 |
| D | 7672 | 6487 | 166 | 166 | 2.16% | 2.56% | 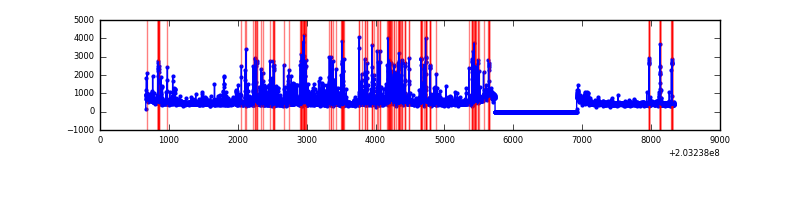 |
Top three noisy pixels from each quadrant. If the there are fewer than three noisy pixels in the level2.evt file, extra rows are filled as -1
| Pixel properties | Quadrant properties | ||||||
|---|---|---|---|---|---|---|---|
| Quadrant | DetID | PixID | Counts | Sigma | Mean | Median | Sigma |
| A | 0 | 118 | 160824 | 977.66 | 809 | 790 | 163.7 |
| A | 13 | 251 | 86737 | 525.06 | 809 | 790 | 163.7 |
| A | 13 | 164 | 63936 | 385.77 | 809 | 790 | 163.7 |
| B | 15 | 204 | 279034 | 1781.52 | 814 | 796 | 156.2 |
| B | 14 | 167 | 190085 | 1211.99 | 814 | 796 | 156.2 |
| B | 0 | 173 | 68401 | 432.87 | 814 | 796 | 156.2 |
| C | 2 | 53 | 1081080 | 6128.07 | 764 | 765 | 176.3 |
| C | 1 | 16 | 56688 | 317.22 | 764 | 765 | 176.3 |
| C | 12 | 4 | 9554 | 49.86 | 764 | 765 | 176.3 |
| D | 8 | 112 | 742074 | 4029.99 | 770 | 746 | 184.0 |
| D | 1 | 84 | 114180 | 616.65 | 770 | 746 | 184.0 |
| D | 13 | 223 | 49082 | 262.76 | 770 | 746 | 184.0 |
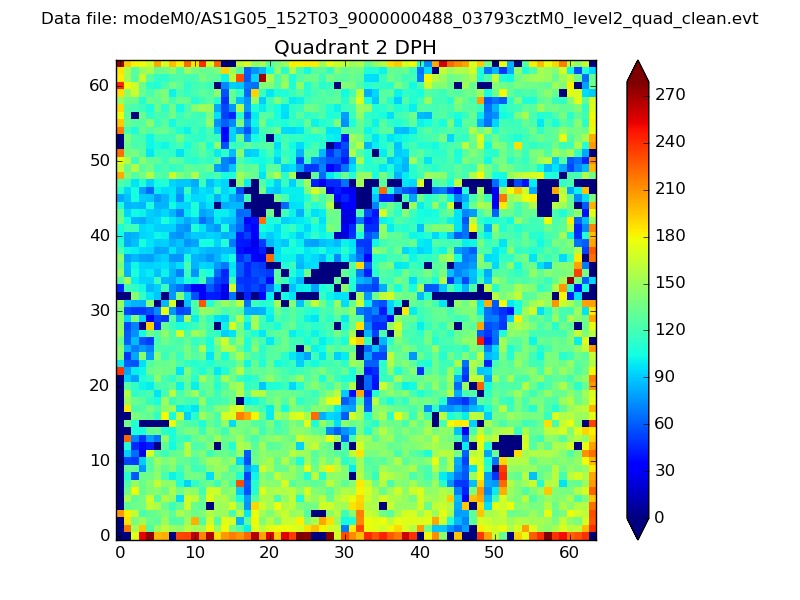
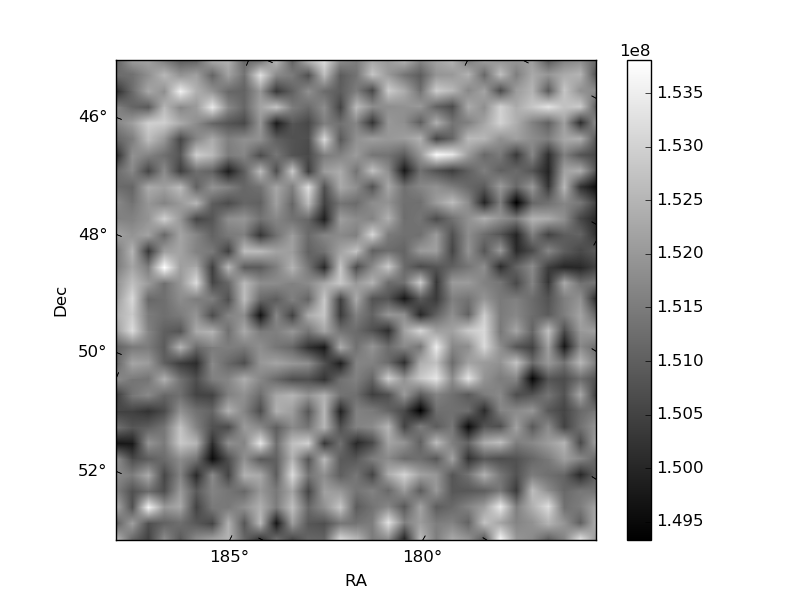
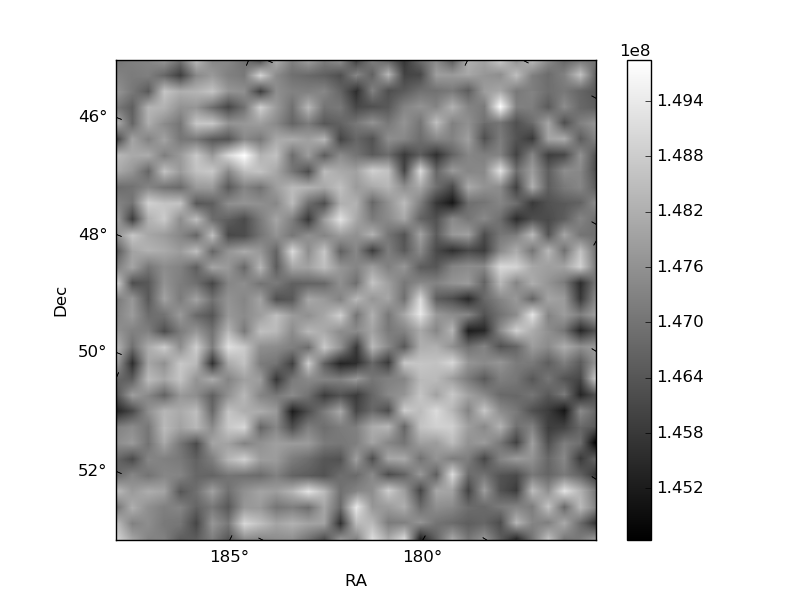
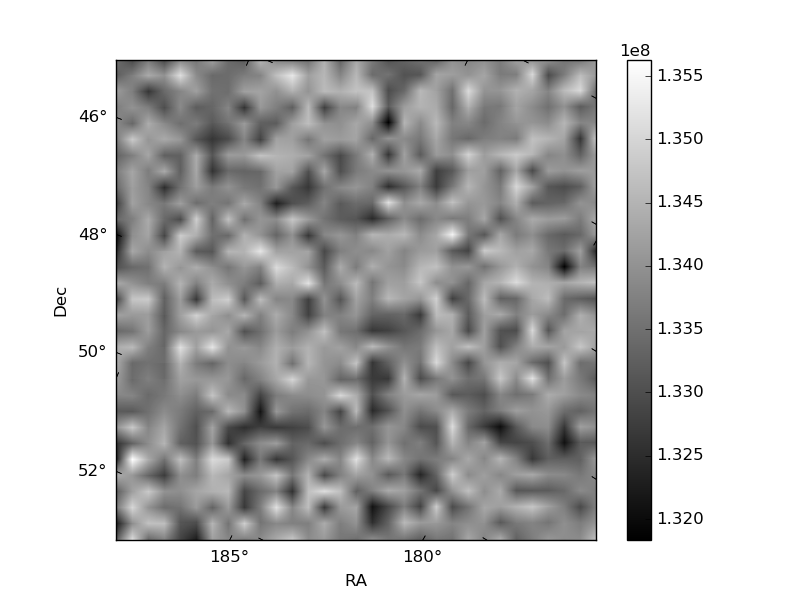
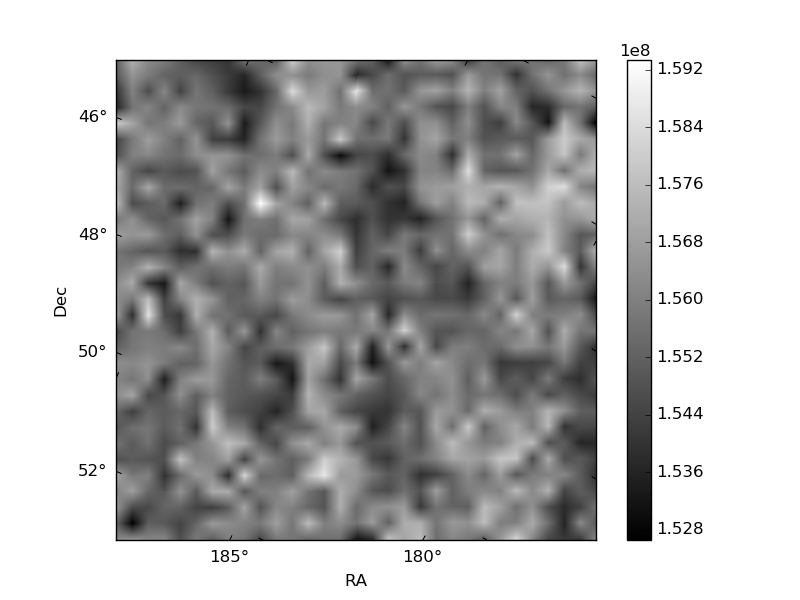
Histogram calculated using DETX and DETY for each event in the final _common_clean file
| Quadrant A | 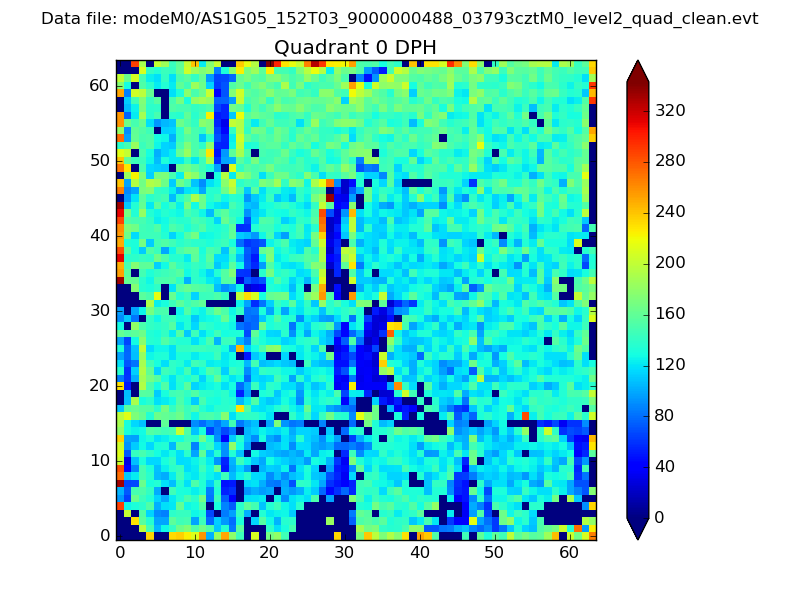 |
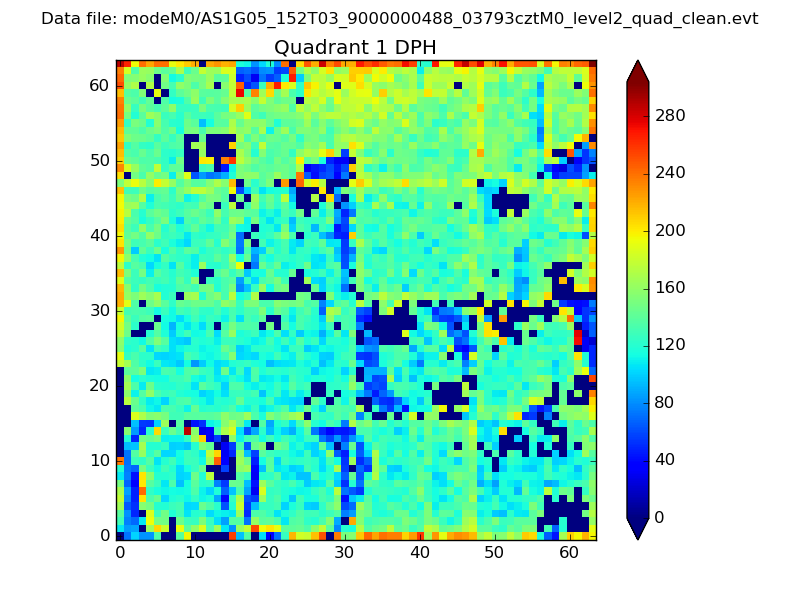 |
Quadrant B |
|---|---|---|---|
| Quadrant D | 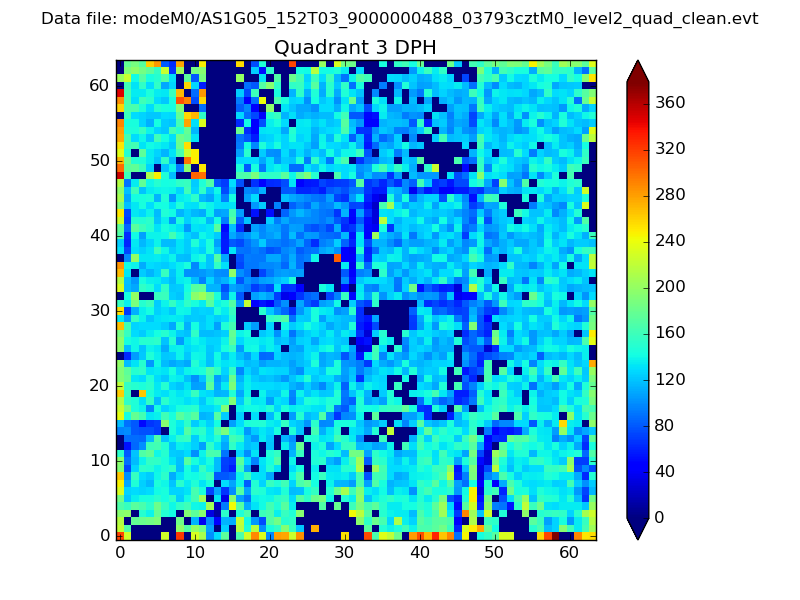 |
 |
Quadrant C |
| Plot type | Count rate plots | Images |
|---|---|---|
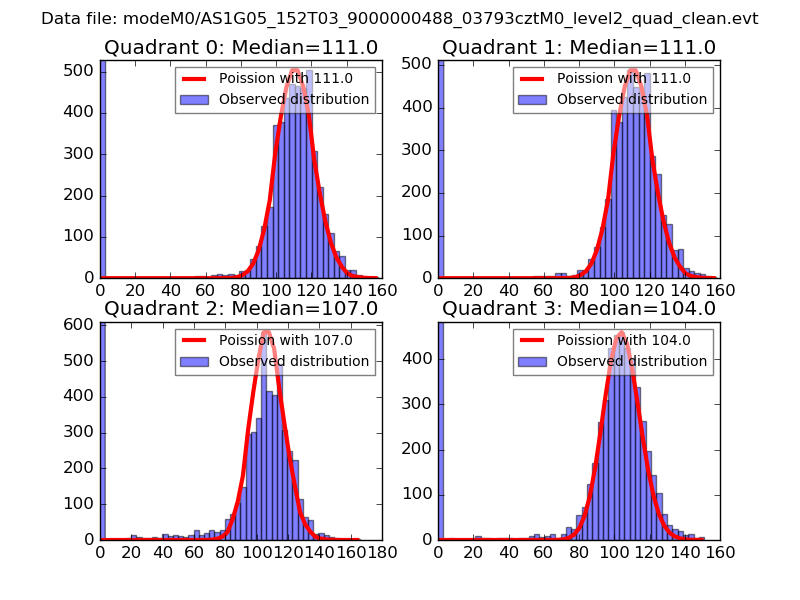
| Comparison with Poisson distribution Blue bars denote a histogram of data divided into 1 sec bins. Red curve is a Poisson curve with rate = median count rate of data. |
 |
 |
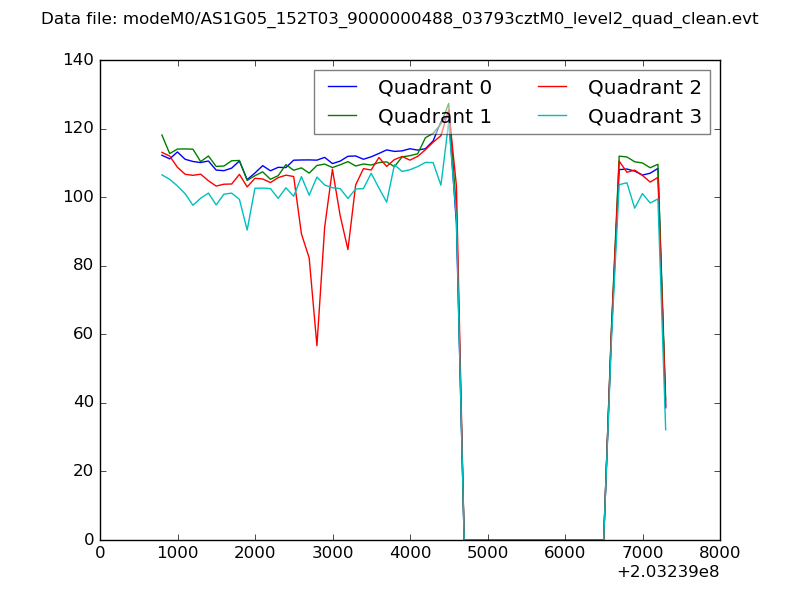
| Quadrant-wise count rates Data is divided into 100 sec bins |
 |
|
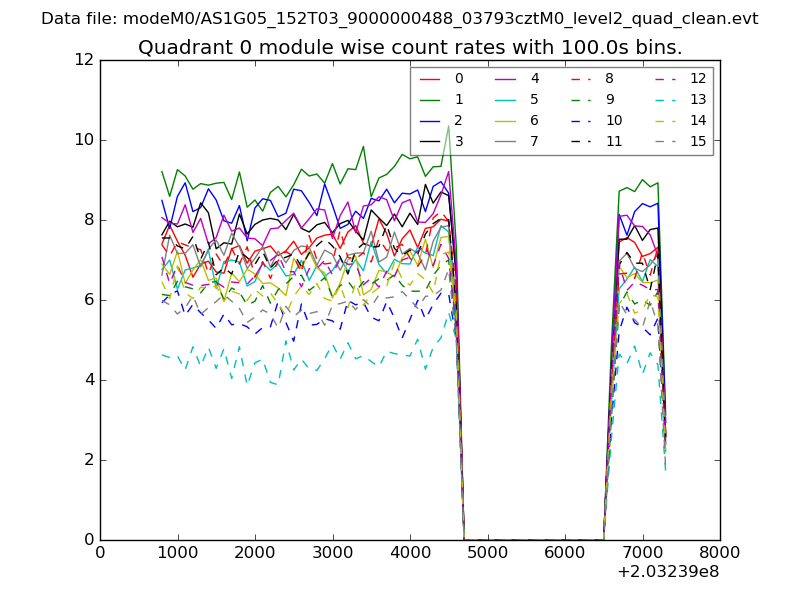
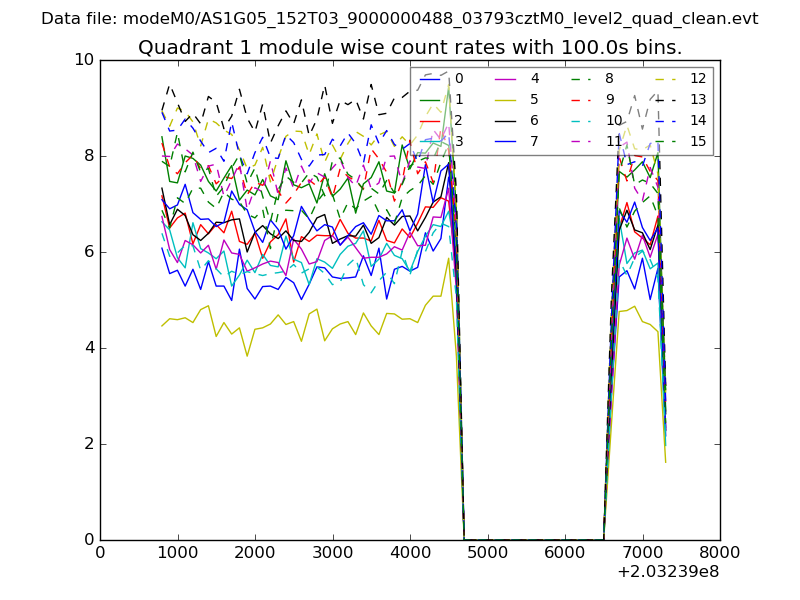
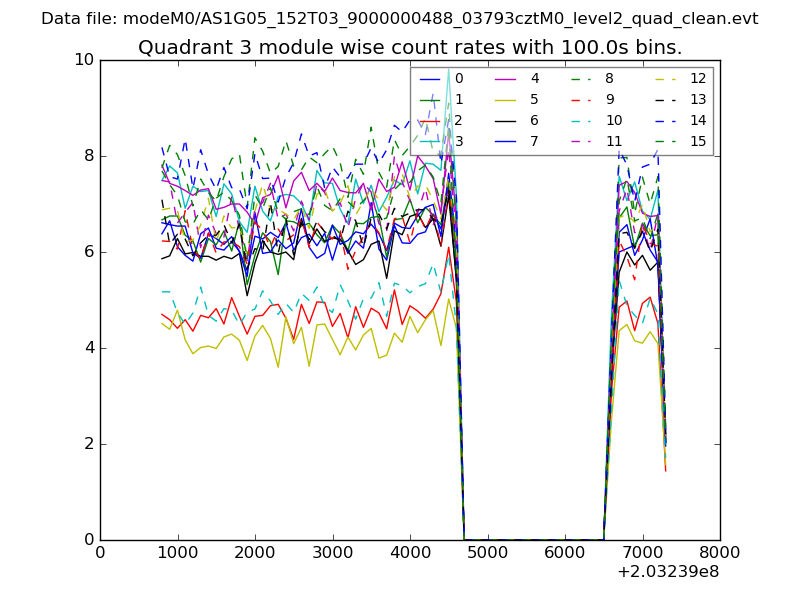
| Module-wise count rates for Quadrant A Data is divided into 100 sec bins |
 |
 |
| Module-wise count rates for Quadrant B Data is divided into 100 sec bins |
 |
 |
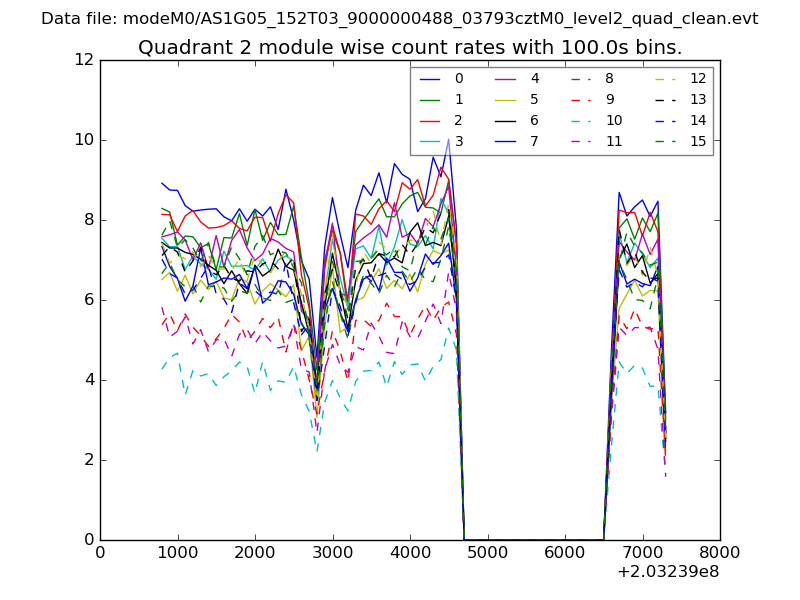
| Module-wise count rates for Quadrant C Data is divided into 100 sec bins |
 |
 |
| Module-wise count rates for Quadrant D Data is divided into 100 sec bins |
 |
 |
| Parameter | Plot |
|---|---|
| CZT HV Monitor | 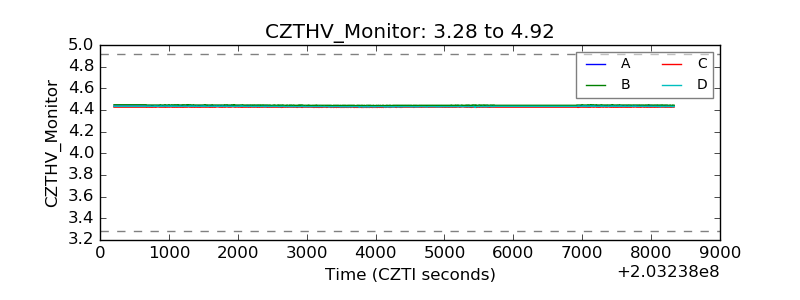 |
| D_VDD | 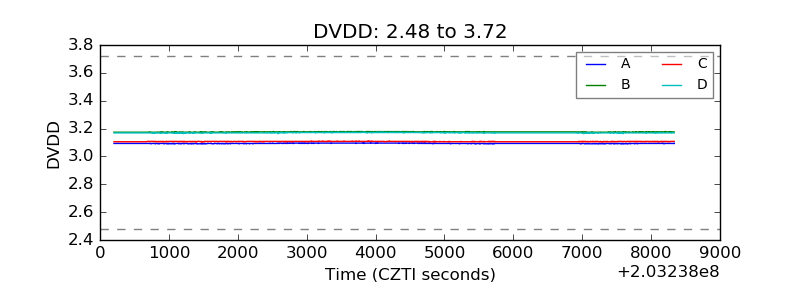 |
| Temperature 1 | 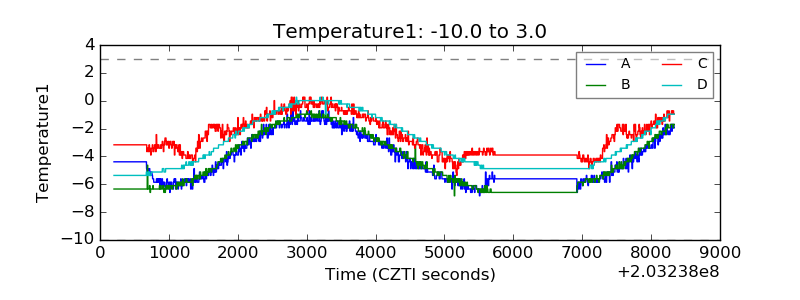 |
| Veto HV Monitor | 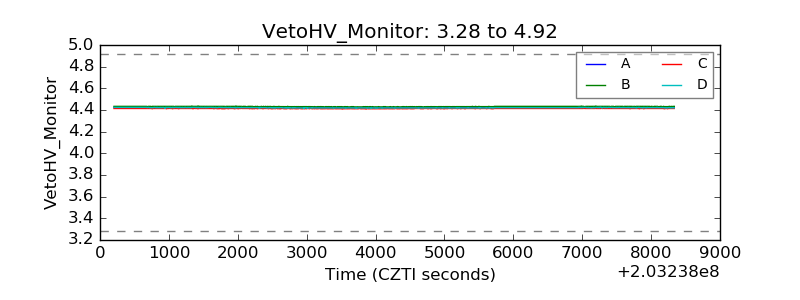 |
| Veto LLD | 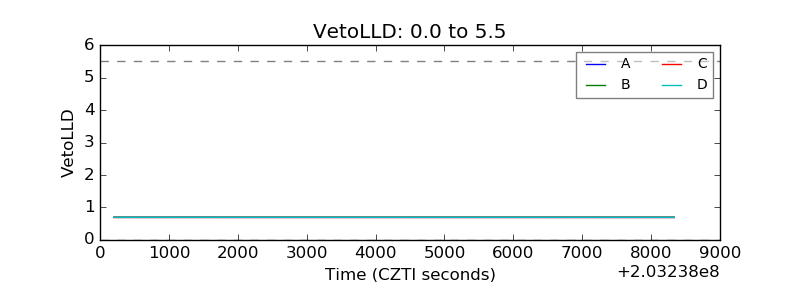 |
| Alpha Counter | 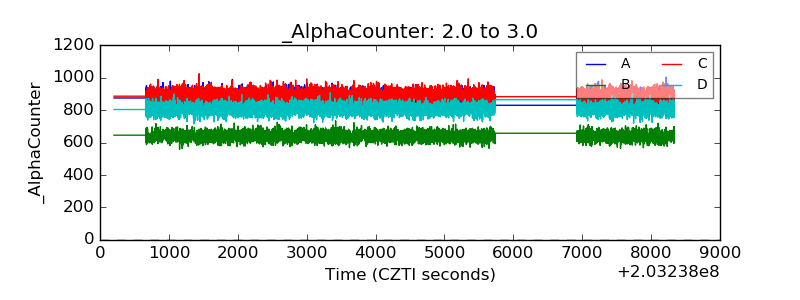 |
| _CPM_Rate | 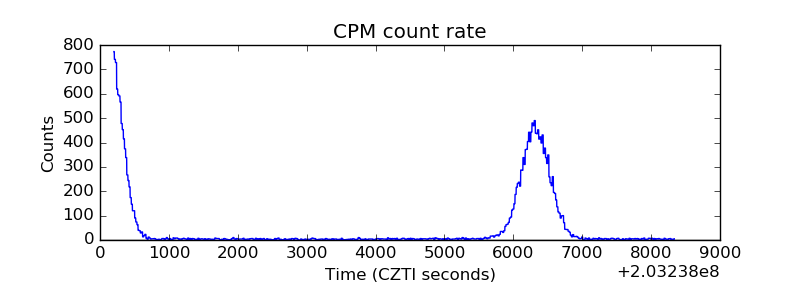 |
| CZT Counter | 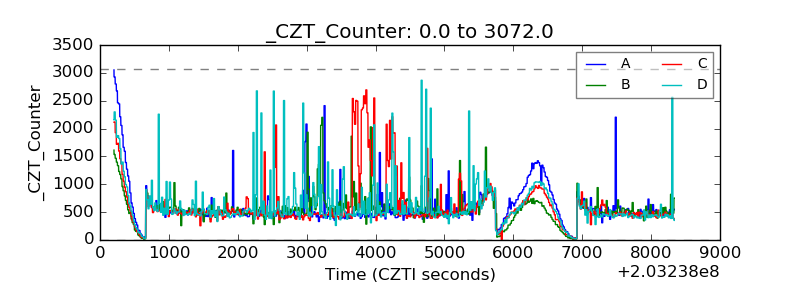 |
| +2.5 Volts monitor |  |
| +5 Volts monitor |  |
| Veto Counter | 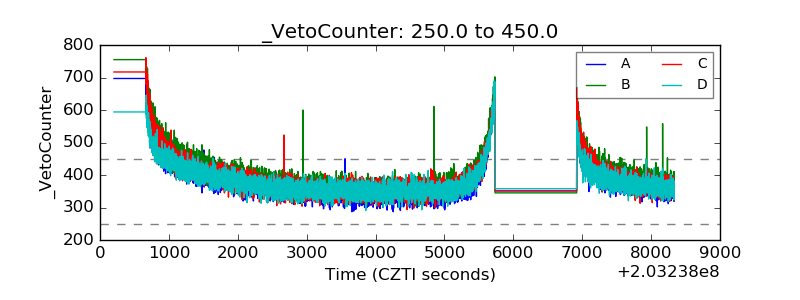 |