| Param | Original file | Final file |
|---|---|---|
| Filename | modeM0/AS1G05_152T03_9000000488_03794cztM0_level2.evt | modeM0/AS1G05_152T03_9000000488_03794cztM0_level2_quad_clean.evt |
| Size (bytes) | 527,232,960 | 82,696,320 |
| Size | 502.8 MB | 78.9 MB |
| Events in quadrant A | 4,382,165 | 524,506 |
| Events in quadrant B | 4,629,751 | 512,380 |
| Events in quadrant C | 2,921,698 | 522,666 |
| Events in quadrant D | 3,602,870 | 501,442 |
| Mode M9 | |||
|---|---|---|---|
| Quadrant | BADHDUFLAG | Total packets | Discarded packets |
| A | 0 | 10 | 0 |
| B | 0 | 10 | 0 |
| C | 0 | 10 | 0 |
| D | 0 | 10 | 0 |
| Mode SS | |||
|---|---|---|---|
| Quadrant | BADHDUFLAG | Total packets | Discarded packets |
| A | 0 | 128 | 0 |
| B | 0 | 128 | 0 |
| C | 0 | 128 | 0 |
| D | 0 | 128 | 0 |
| Mode M0 | |||
|---|---|---|---|
| Quadrant | BADHDUFLAG | Total packets | Discarded packets |
| A | 0 | 17032 | 2 |
| B | 0 | 17848 | 1 |
| C | 0 | 13157 | 1 |
| D | 0 | 14971 | 1 |
| Quadrant | Total seconds | Saturated seconds | Saturation percentage |
|---|---|---|---|
| A | 6351 | 412 | 6.487167% |
| B | 6351 | 510 | 8.030231% |
| C | 6351 | 92 | 1.448591% |
| D | 6351 | 216 | 3.401039% |
Noise dominated data is calculated using 1-second bins in cleaned event files. If a bin has >2000 counts, and if more than 50% of those come from <1% of pixels, then it is considered to be noise-dominated and hence unusable.
| Quadrant | # 1 sec bins | Bins with >0 counts | Bins with >2000 counts | High rate bins dominated by noise | Noise dominated (total time) | Noise dominated (detector-on time) | Marked lightcurve |
|---|---|---|---|---|---|---|---|
| A | 7306 | 6351 | 176 | 176 | 2.41% | 2.77% | 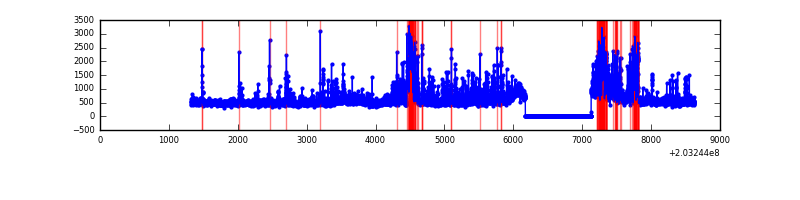 |
| B | 7305 | 6350 | 318 | 318 | 4.35% | 5.01% | 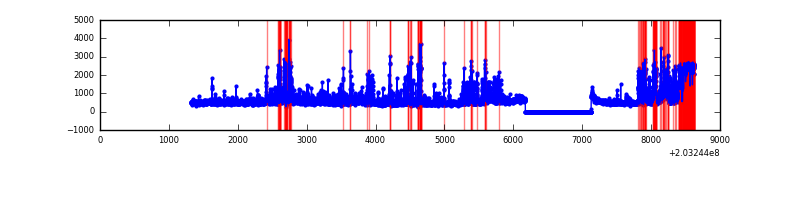 |
| C | 7306 | 6352 | 1 | 1 | 0.01% | 0.02% | 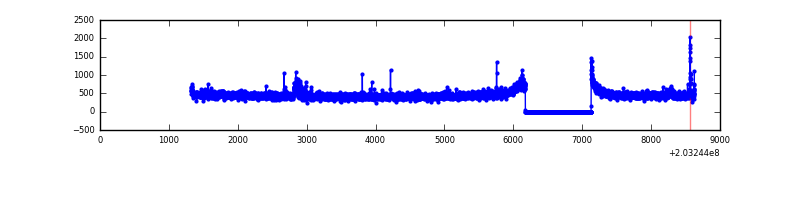 |
| D | 7306 | 6351 | 118 | 118 | 1.62% | 1.86% | 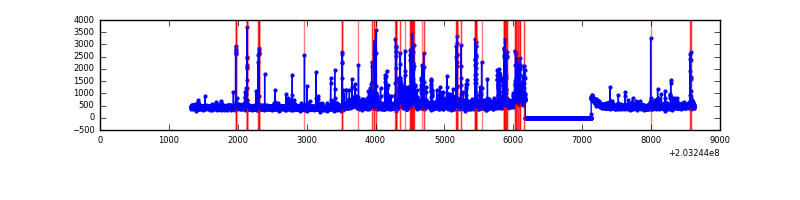 |
Top three noisy pixels from each quadrant. If the there are fewer than three noisy pixels in the level2.evt file, extra rows are filled as -1
| Pixel properties | Quadrant properties | ||||||
|---|---|---|---|---|---|---|---|
| Quadrant | DetID | PixID | Counts | Sigma | Mean | Median | Sigma |
| A | 13 | 251 | 912860 | 6010.28 | 738 | 718 | 151.8 |
| A | 0 | 50 | 456731 | 3004.76 | 738 | 718 | 151.8 |
| A | 0 | 118 | 119664 | 783.76 | 738 | 718 | 151.8 |
| B | 0 | 173 | 970179 | 6827.31 | 738 | 722 | 142.0 |
| B | 14 | 167 | 411639 | 2893.84 | 738 | 722 | 142.0 |
| B | 15 | 204 | 185775 | 1303.22 | 738 | 722 | 142.0 |
| C | 2 | 53 | 46082 | 269.27 | 725 | 729 | 168.4 |
| C | 12 | 4 | 18074 | 102.98 | 725 | 729 | 168.4 |
| C | 9 | 144 | 9112 | 49.77 | 725 | 729 | 168.4 |
| D | 8 | 112 | 440197 | 2509.96 | 720 | 695 | 175.1 |
| D | 1 | 84 | 195671 | 1113.49 | 720 | 695 | 175.1 |
| D | 13 | 223 | 76674 | 433.91 | 720 | 695 | 175.1 |
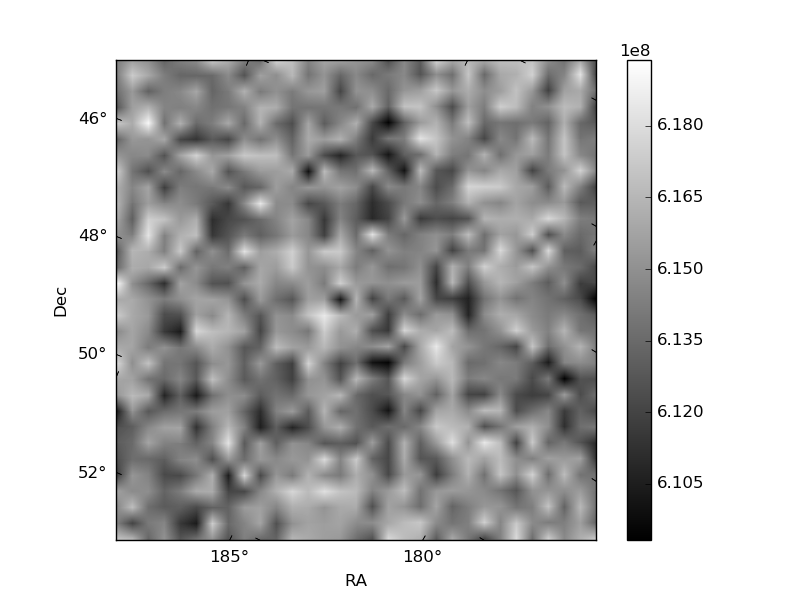
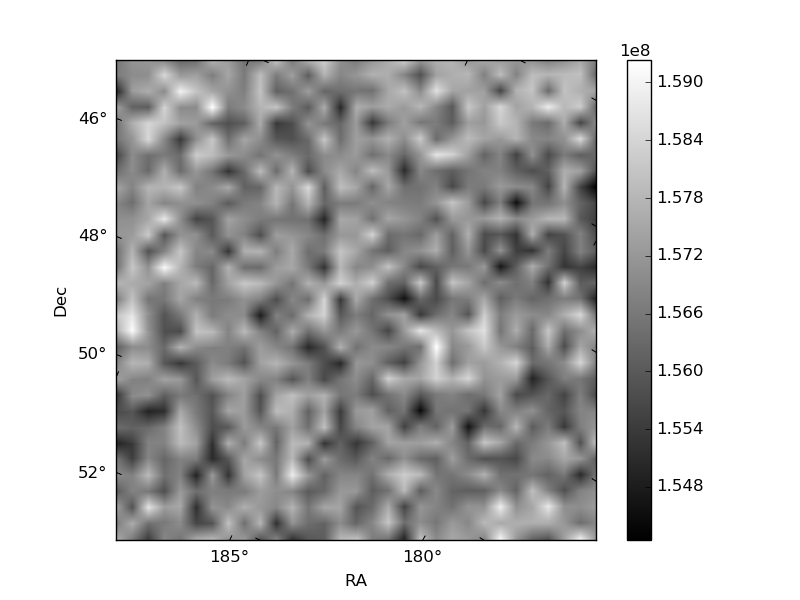
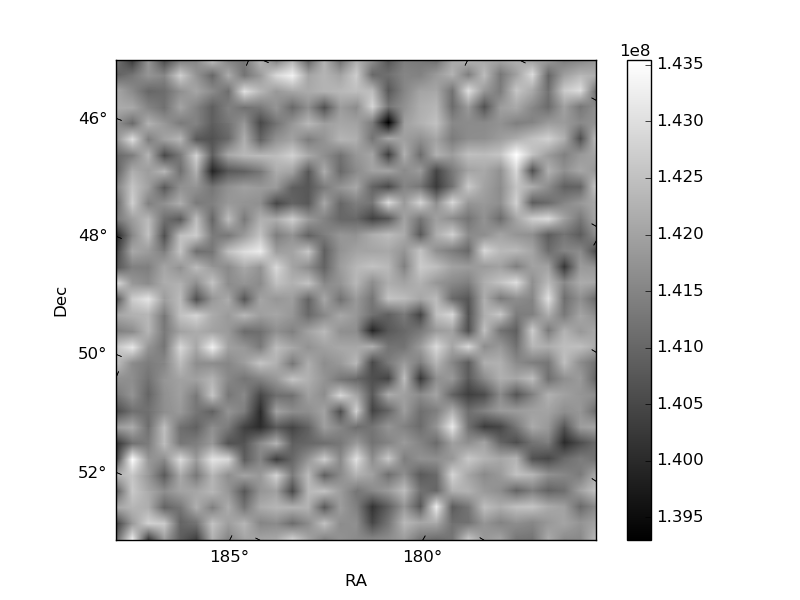
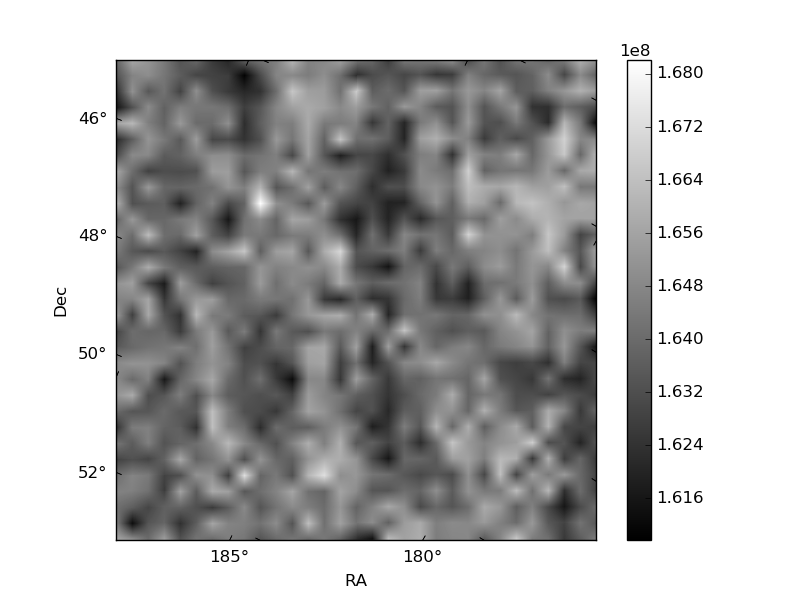
Histogram calculated using DETX and DETY for each event in the final _common_clean file
| Quadrant A | 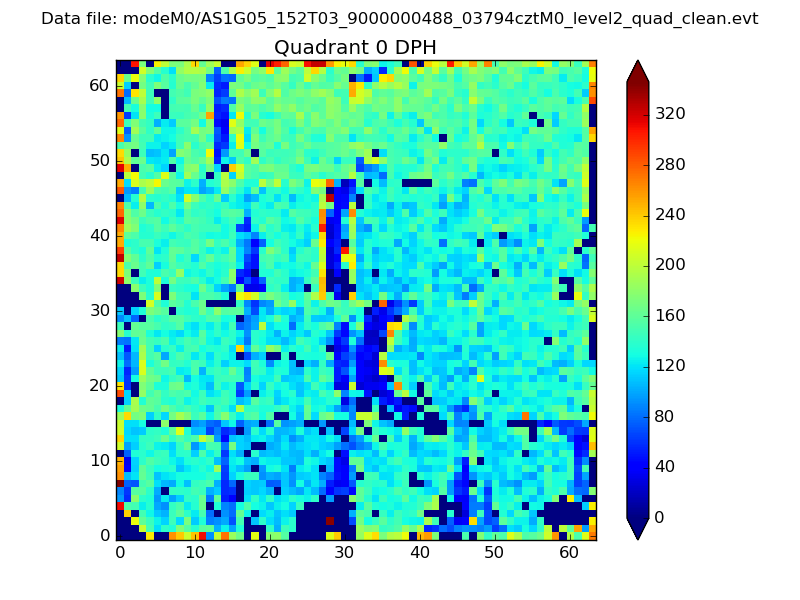 |
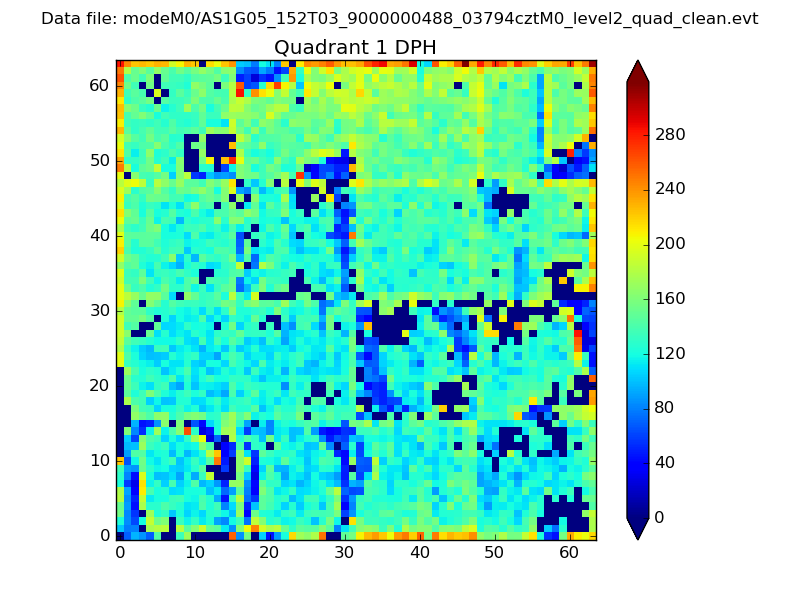 |
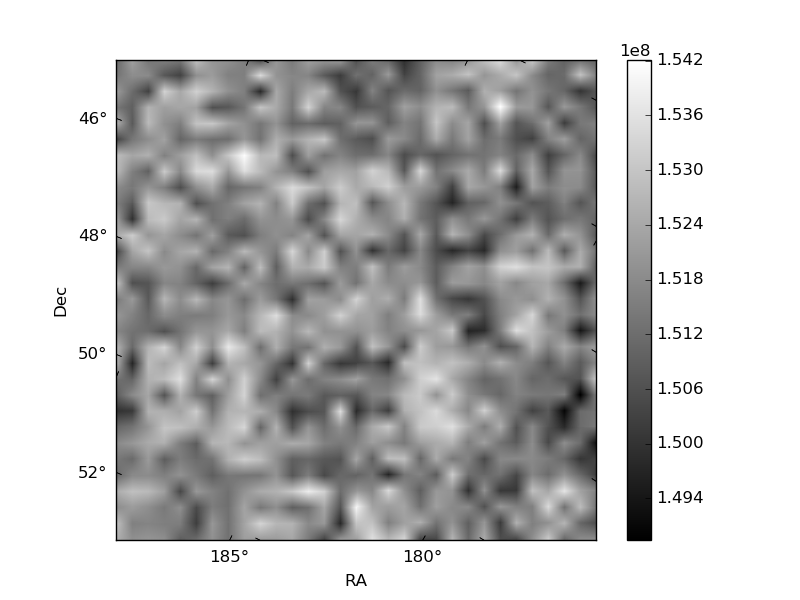
Quadrant B |
|---|---|---|---|
| Quadrant D | 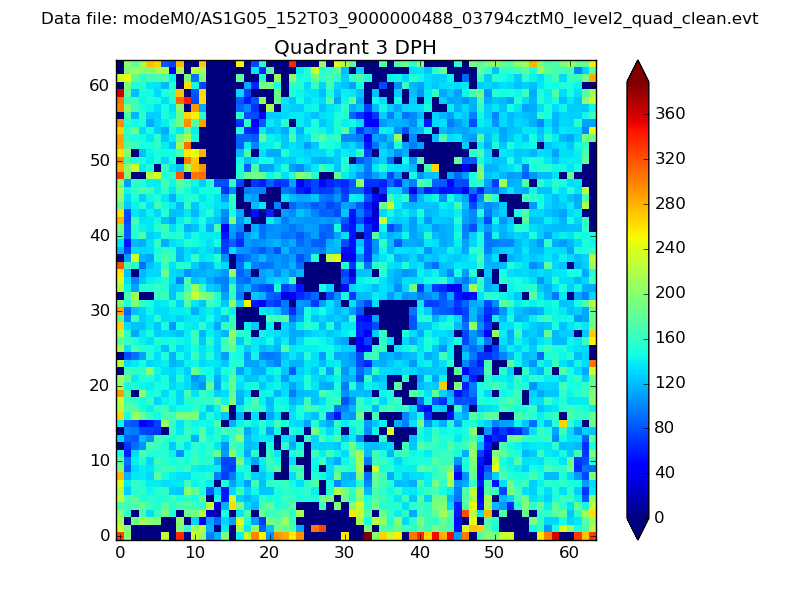 |
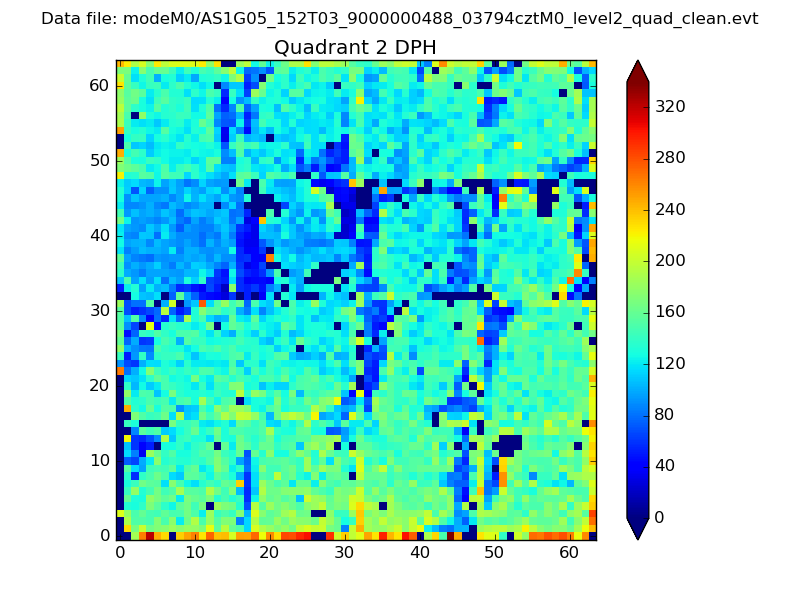 |
Quadrant C |
| Plot type | Count rate plots | Images |
|---|---|---|
| Comparison with Poisson distribution Blue bars denote a histogram of data divided into 1 sec bins. Red curve is a Poisson curve with rate = median count rate of data. |
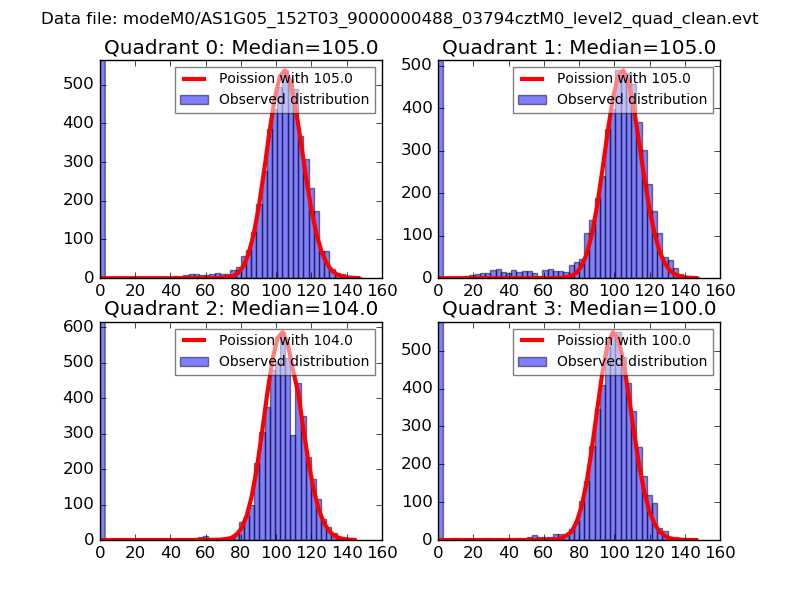 |
 |
| Quadrant-wise count rates Data is divided into 100 sec bins |
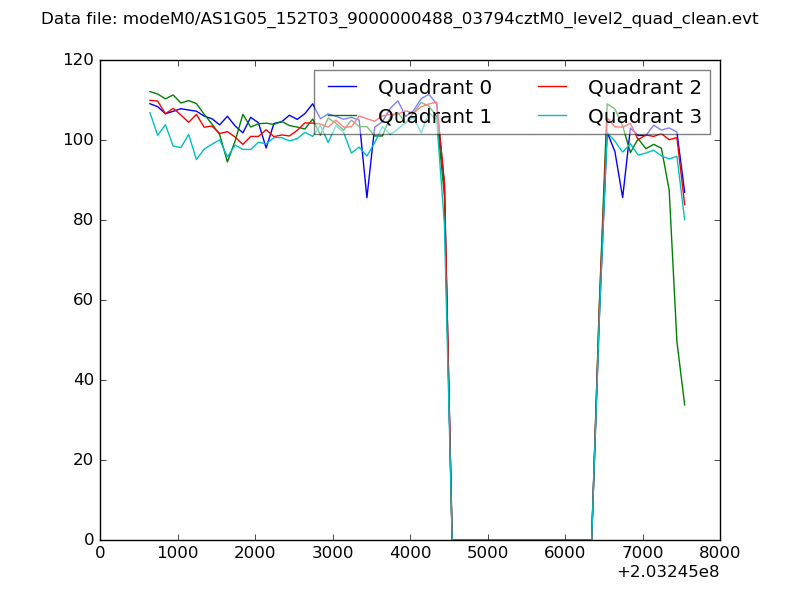 |
|
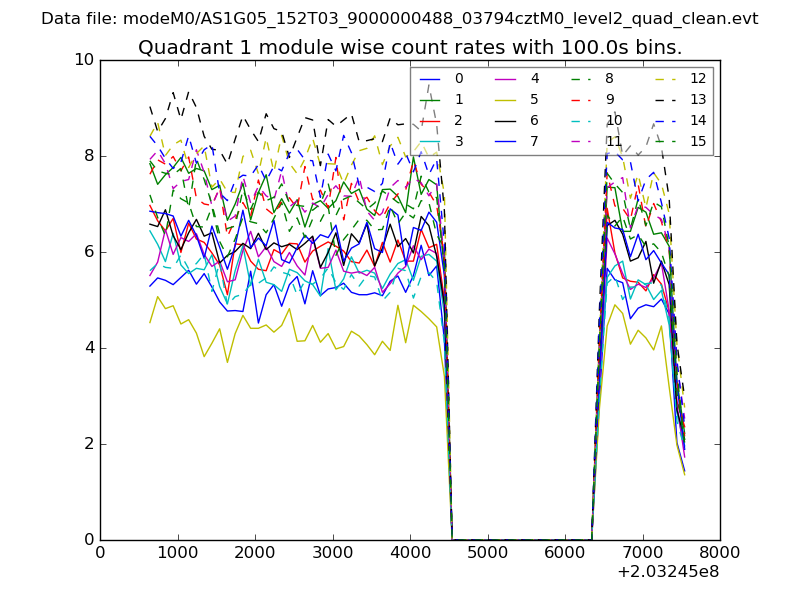
| Module-wise count rates for Quadrant A Data is divided into 100 sec bins |
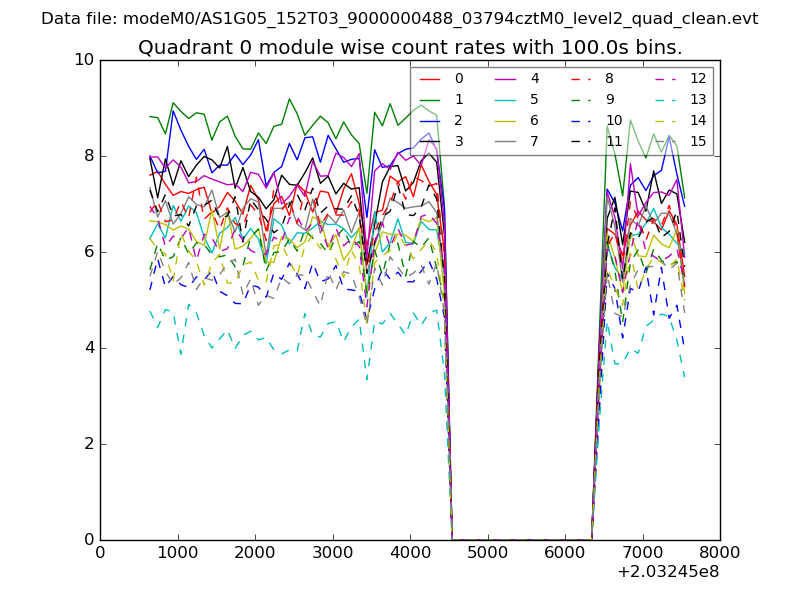 |
 |
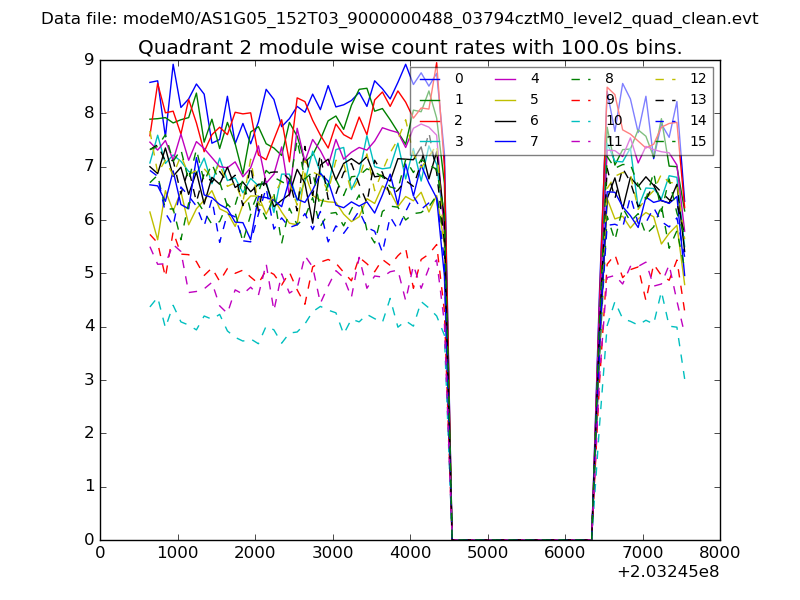
| Module-wise count rates for Quadrant B Data is divided into 100 sec bins |
 |
 |
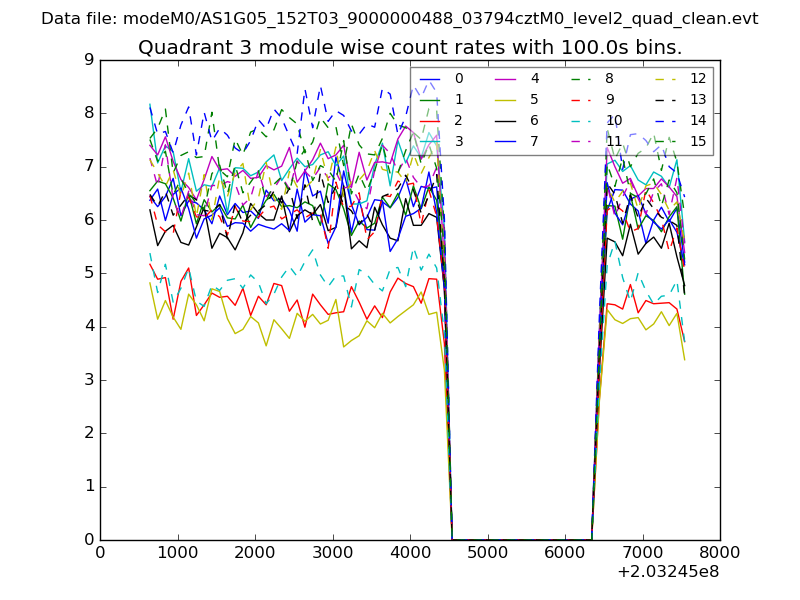
| Module-wise count rates for Quadrant C Data is divided into 100 sec bins |
 |
 |
| Module-wise count rates for Quadrant D Data is divided into 100 sec bins |
 |
 |
| Parameter | Plot |
|---|---|
| CZT HV Monitor | 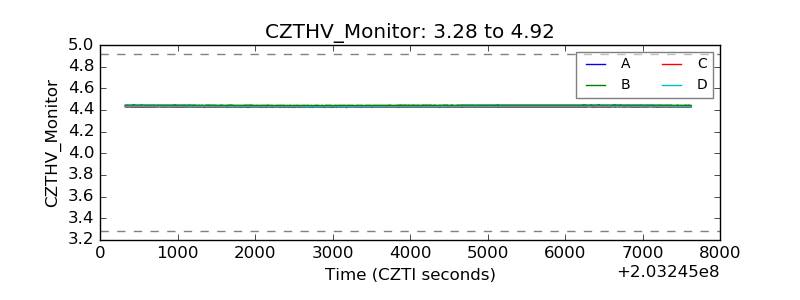 |
| D_VDD | 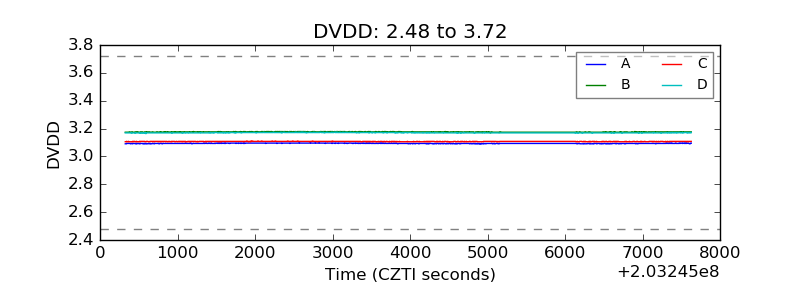 |
| Temperature 1 |  |
| Veto HV Monitor | 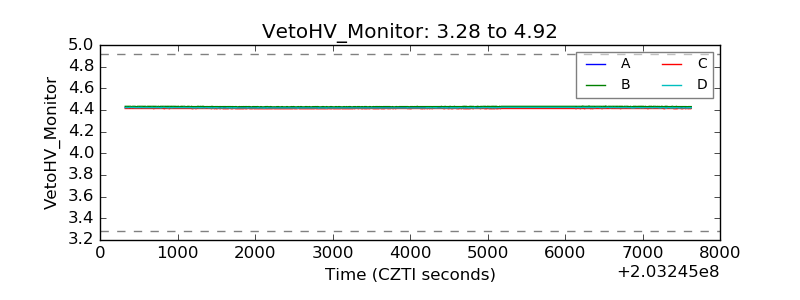 |
| Veto LLD |  |
| Alpha Counter | 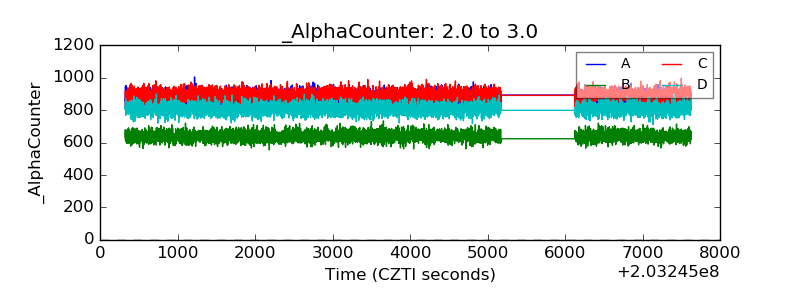 |
| _CPM_Rate | 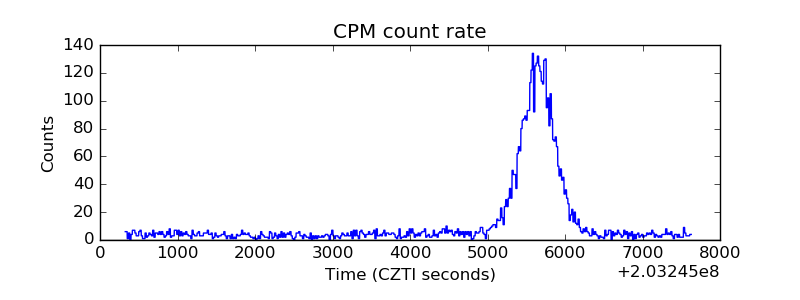 |
| CZT Counter | 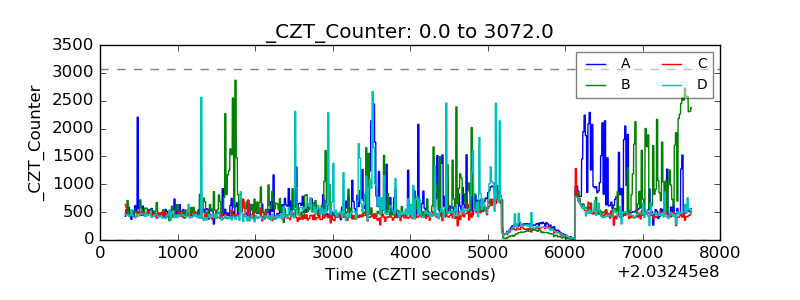 |
| +2.5 Volts monitor |  |
| +5 Volts monitor |  |
| Veto Counter | 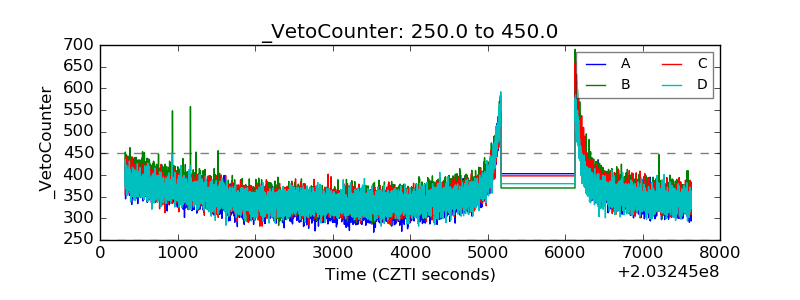 |