| Param | Original file | Final file |
|---|---|---|
| Filename | modeM0/AS1G05_152T03_9000000488_03795cztM0_level2.evt | modeM0/AS1G05_152T03_9000000488_03795cztM0_level2_quad_clean.evt |
| Size (bytes) | 639,230,400 | 89,717,760 |
| Size | 609.6 MB | 85.6 MB |
| Events in quadrant A | 5,636,245 | 560,085 |
| Events in quadrant B | 5,592,575 | 543,321 |
| Events in quadrant C | 3,899,007 | 557,062 |
| Events in quadrant D | 3,737,367 | 548,314 |
| Mode M9 | |||
|---|---|---|---|
| Quadrant | BADHDUFLAG | Total packets | Discarded packets |
| A | 0 | 5 | 0 |
| B | 0 | 5 | 0 |
| C | 0 | 5 | 0 |
| D | 0 | 5 | 0 |
| Mode SS | |||
|---|---|---|---|
| Quadrant | BADHDUFLAG | Total packets | Discarded packets |
| A | 0 | 148 | 0 |
| B | 0 | 148 | 0 |
| C | 0 | 148 | 0 |
| D | 0 | 148 | 0 |
| Mode M0 | |||
|---|---|---|---|
| Quadrant | BADHDUFLAG | Total packets | Discarded packets |
| A | 0 | 21605 | 2 |
| B | 0 | 21356 | 1 |
| C | 0 | 16607 | 1 |
| D | 0 | 16064 | 1 |
| Quadrant | Total seconds | Saturated seconds | Saturation percentage |
|---|---|---|---|
| A | 7292 | 511 | 7.007680% |
| B | 7292 | 701 | 9.613275% |
| C | 7292 | 216 | 2.962150% |
| D | 7292 | 133 | 1.823917% |
Noise dominated data is calculated using 1-second bins in cleaned event files. If a bin has >2000 counts, and if more than 50% of those come from <1% of pixels, then it is considered to be noise-dominated and hence unusable.
| Quadrant | # 1 sec bins | Bins with >0 counts | Bins with >2000 counts | High rate bins dominated by noise | Noise dominated (total time) | Noise dominated (detector-on time) | Marked lightcurve |
|---|---|---|---|---|---|---|---|
| A | 7852 | 7292 | 267 | 267 | 3.40% | 3.66% | 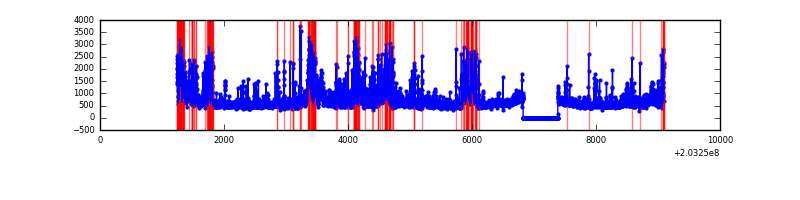 |
| B | 7852 | 7292 | 523 | 523 | 6.66% | 7.17% | 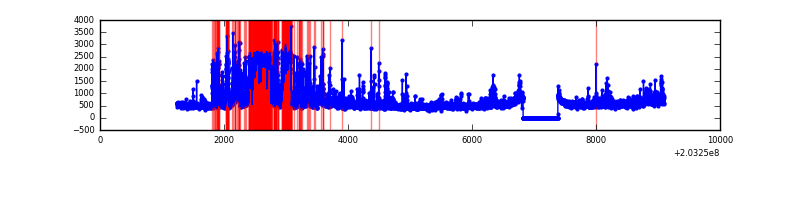 |
| C | 7852 | 7292 | 134 | 134 | 1.71% | 1.84% | 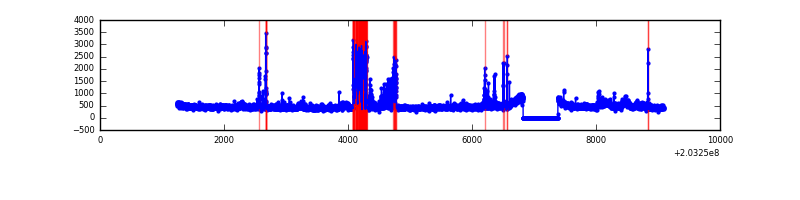 |
| D | 7852 | 7292 | 36 | 36 | 0.46% | 0.49% | 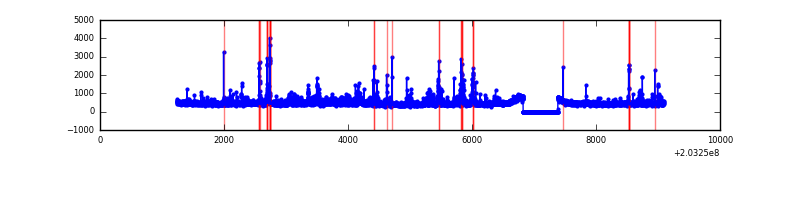 |
Top three noisy pixels from each quadrant. If the there are fewer than three noisy pixels in the level2.evt file, extra rows are filled as -1
| Pixel properties | Quadrant properties | ||||||
|---|---|---|---|---|---|---|---|
| Quadrant | DetID | PixID | Counts | Sigma | Mean | Median | Sigma |
| A | 13 | 251 | 1364072 | 7817.96 | 833 | 810 | 174.4 |
| A | 0 | 50 | 632830 | 3624.47 | 833 | 810 | 174.4 |
| A | 0 | 118 | 185026 | 1056.43 | 833 | 810 | 174.4 |
| B | 0 | 173 | 1041636 | 6447.94 | 827 | 805 | 161.4 |
| B | 14 | 167 | 567567 | 3511.08 | 827 | 805 | 161.4 |
| B | 15 | 204 | 481059 | 2975.17 | 827 | 805 | 161.4 |
| C | 2 | 53 | 608012 | 3183.62 | 816 | 818 | 190.7 |
| C | 12 | 4 | 44450 | 228.77 | 816 | 818 | 190.7 |
| C | 10 | 65 | 28533 | 145.31 | 816 | 818 | 190.7 |
| D | 1 | 84 | 194728 | 972.05 | 823 | 798 | 199.5 |
| D | 13 | 239 | 91430 | 454.28 | 823 | 798 | 199.5 |
| D | 8 | 112 | 90007 | 447.15 | 823 | 798 | 199.5 |
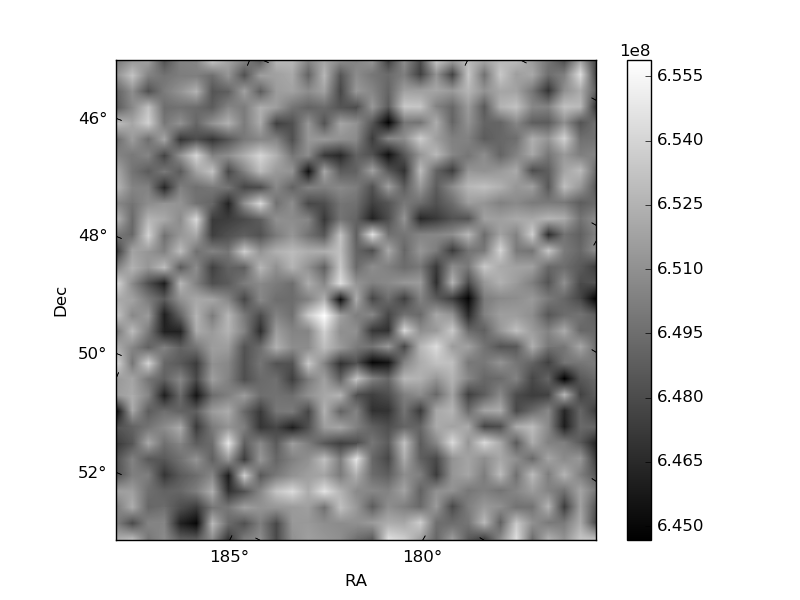
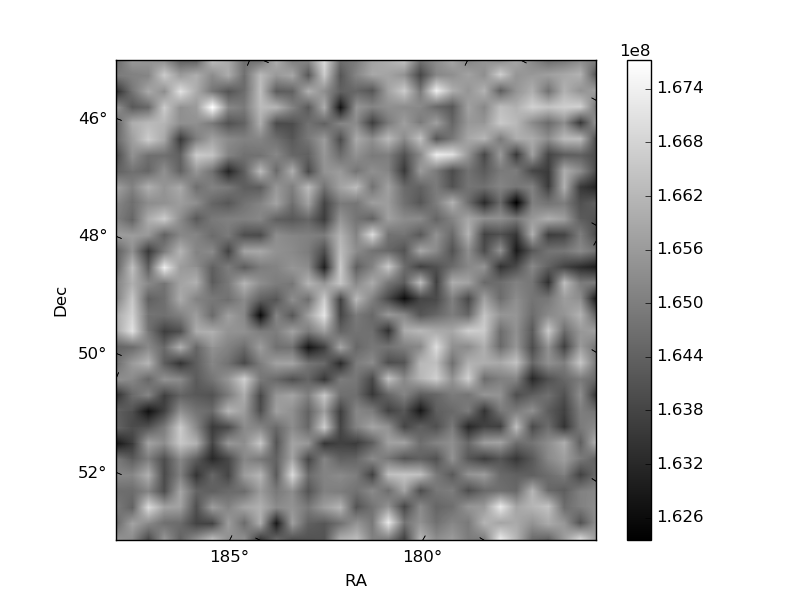
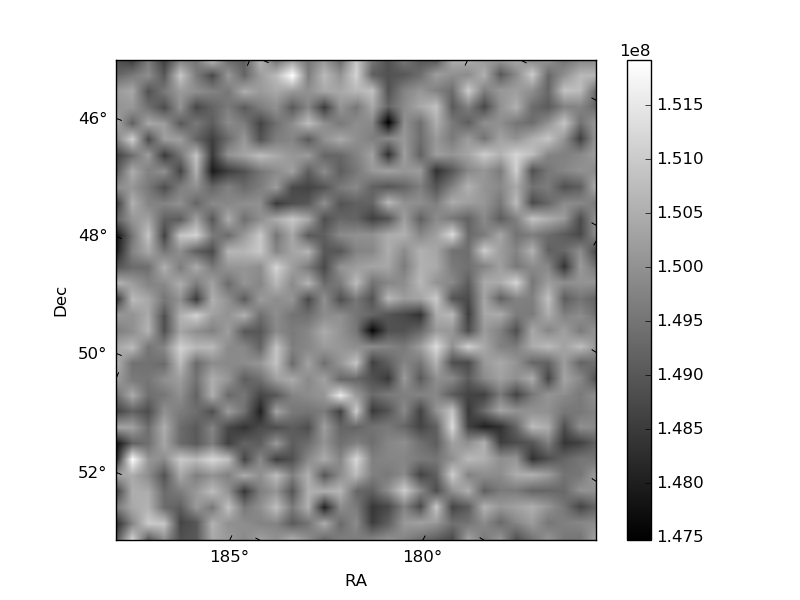
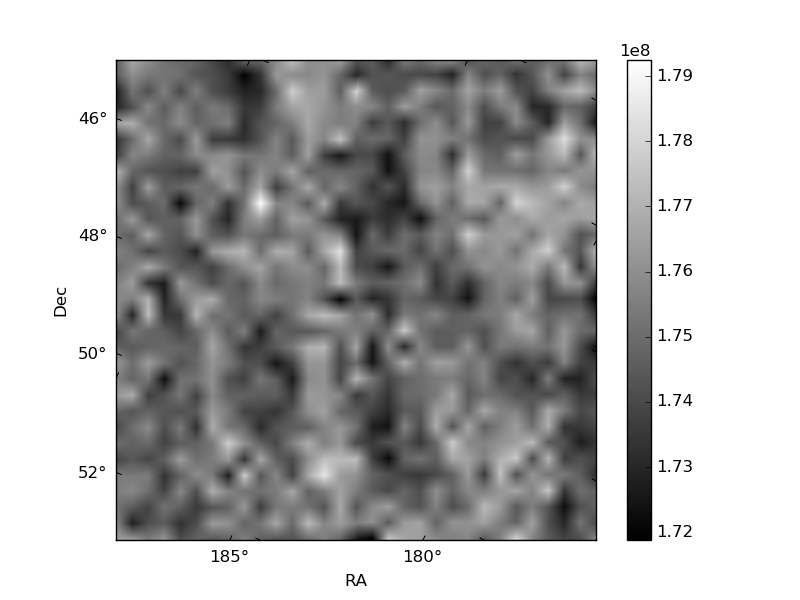
Histogram calculated using DETX and DETY for each event in the final _common_clean file
| Quadrant A | 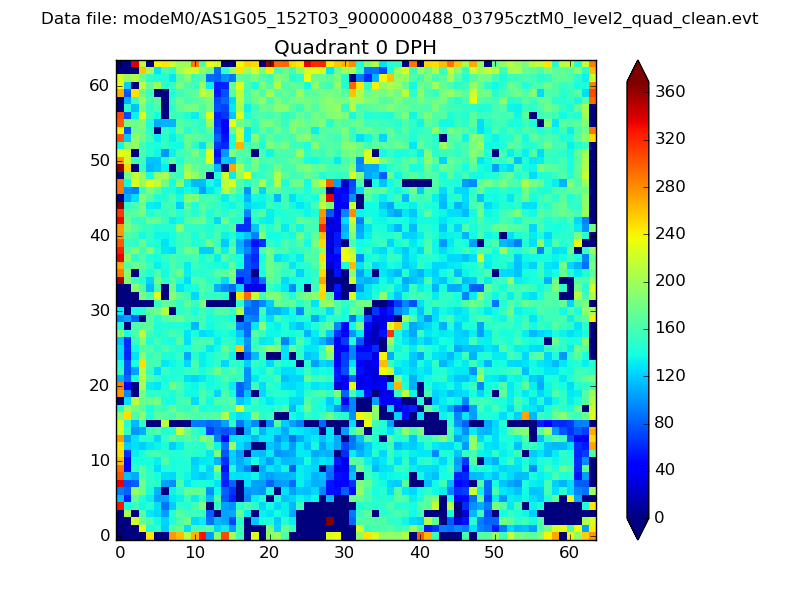 |
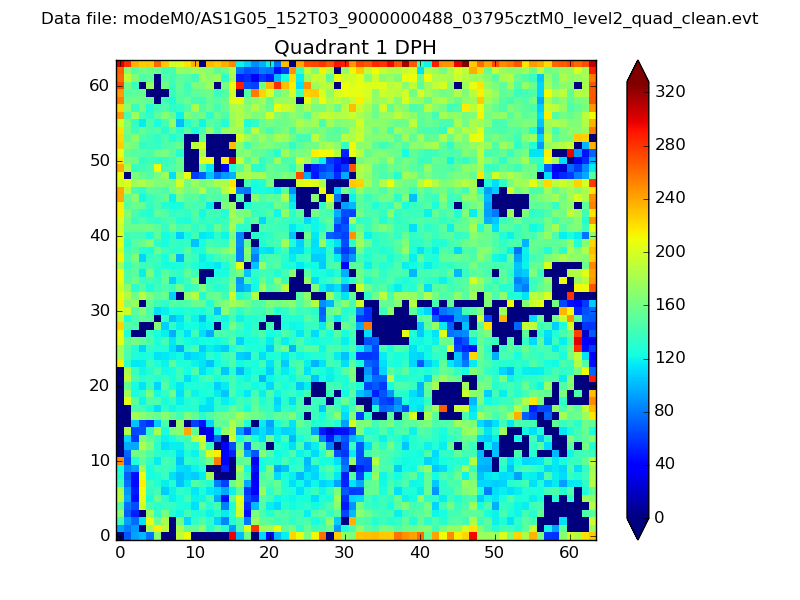 |
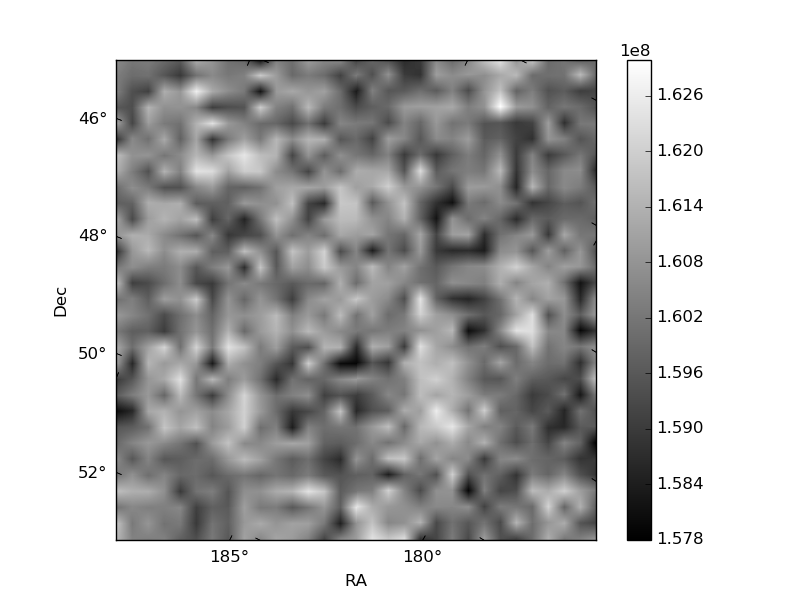
Quadrant B |
|---|---|---|---|
| Quadrant D | 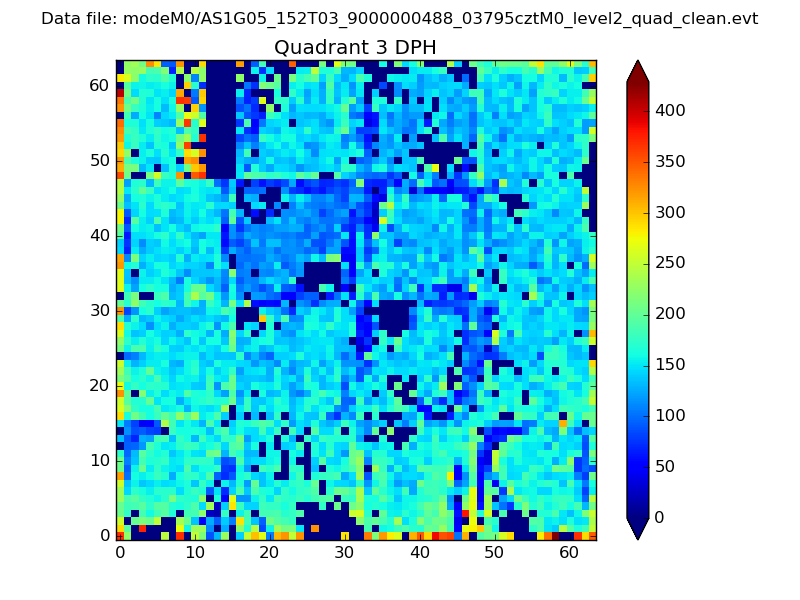 |
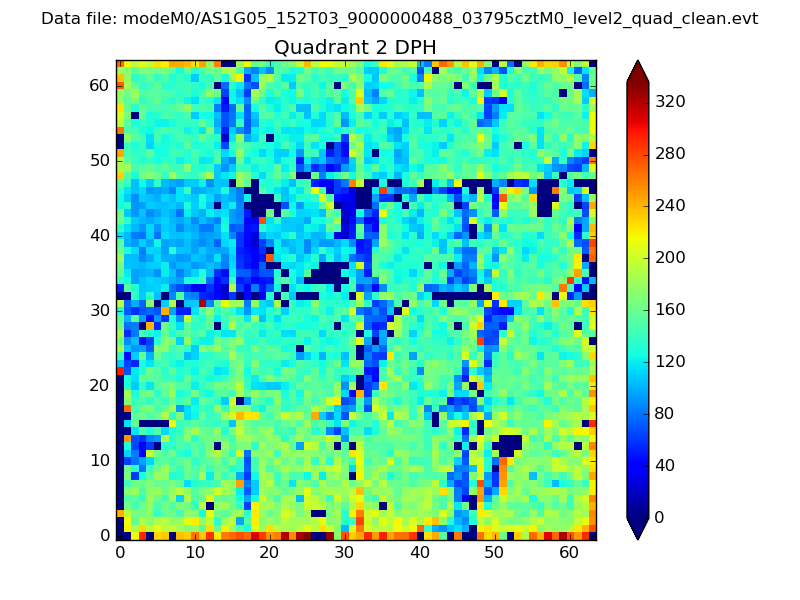 |
Quadrant C |
| Plot type | Count rate plots | Images |
|---|---|---|
| Comparison with Poisson distribution Blue bars denote a histogram of data divided into 1 sec bins. Red curve is a Poisson curve with rate = median count rate of data. |
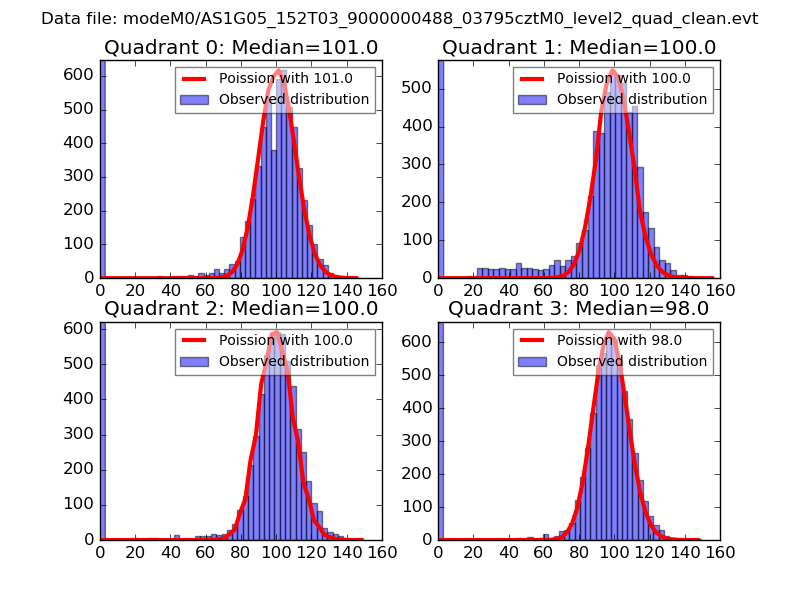 |
 |
| Quadrant-wise count rates Data is divided into 100 sec bins |
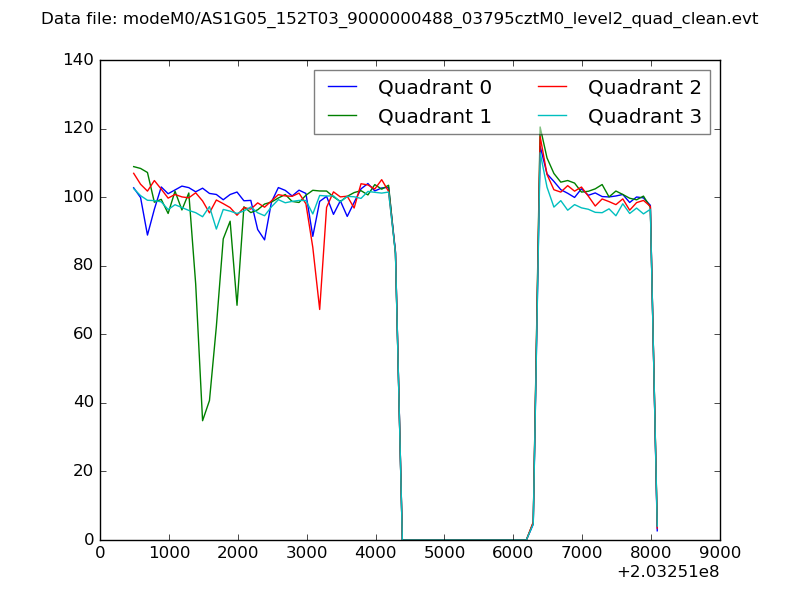 |
|
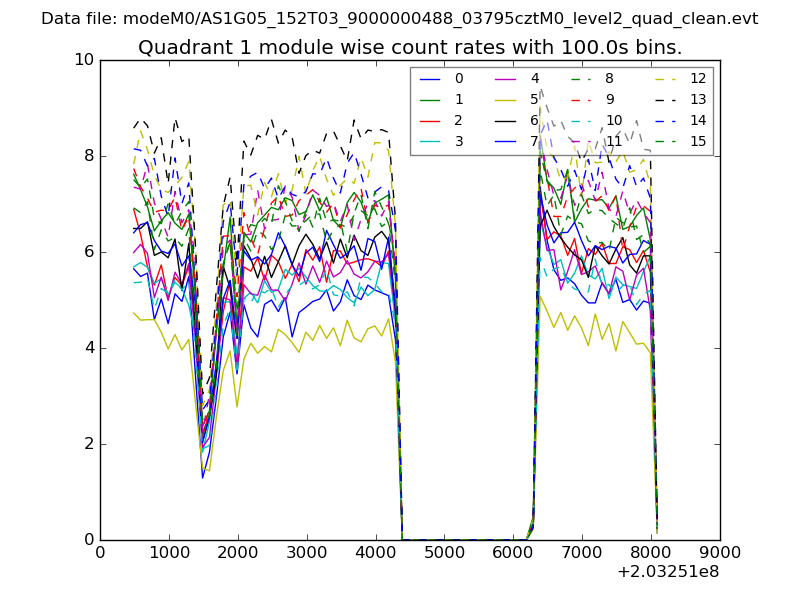
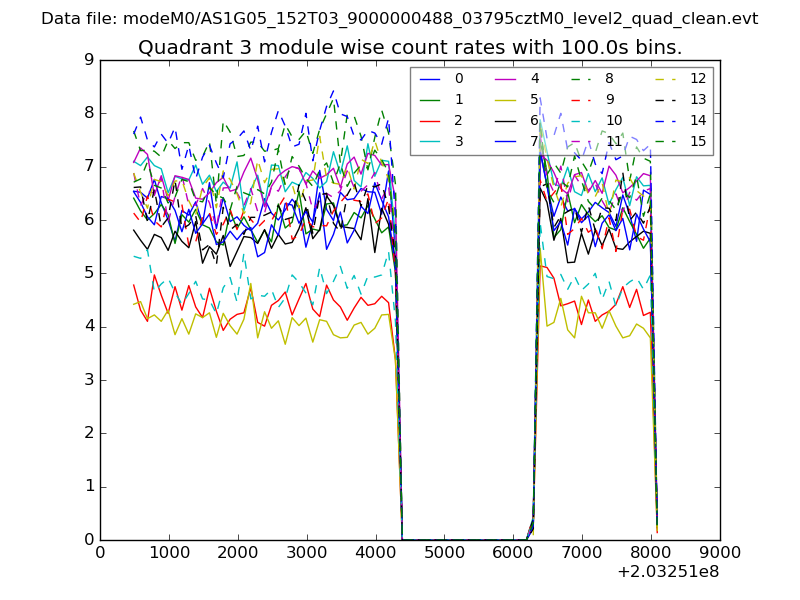
| Module-wise count rates for Quadrant A Data is divided into 100 sec bins |
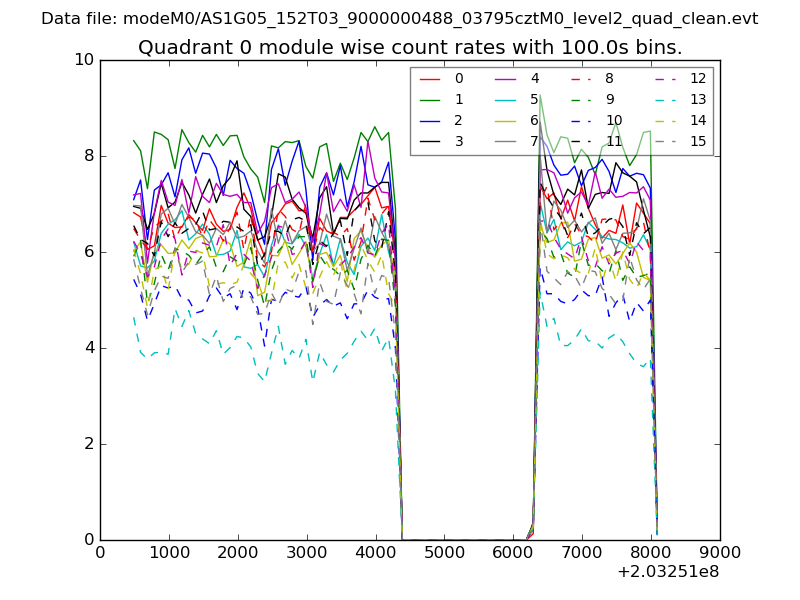 |
 |
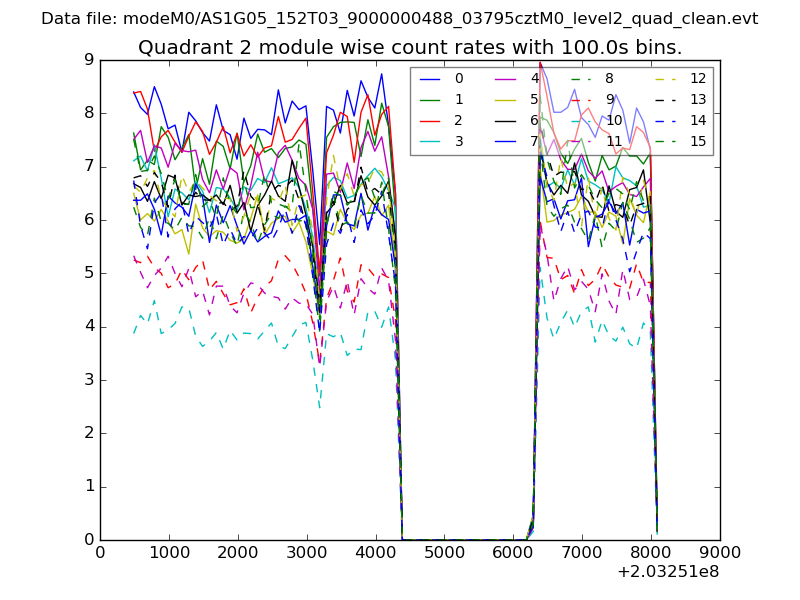
| Module-wise count rates for Quadrant B Data is divided into 100 sec bins |
 |
 |
| Module-wise count rates for Quadrant C Data is divided into 100 sec bins |
 |
 |
| Module-wise count rates for Quadrant D Data is divided into 100 sec bins |
 |
 |
| Parameter | Plot |
|---|---|
| CZT HV Monitor | 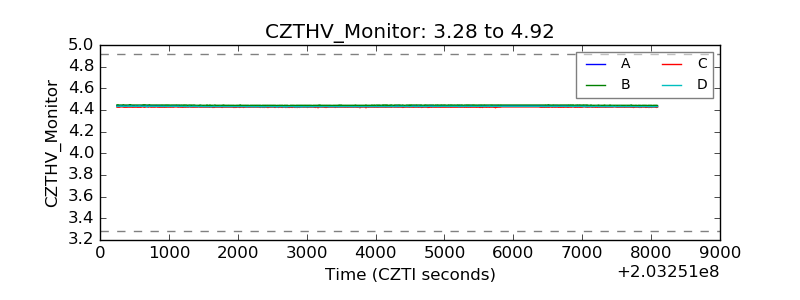 |
| D_VDD | 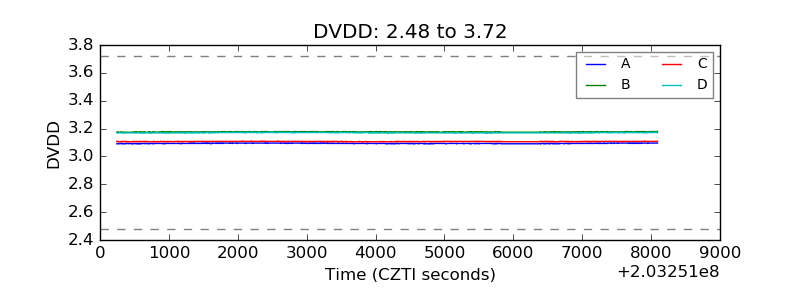 |
| Temperature 1 | 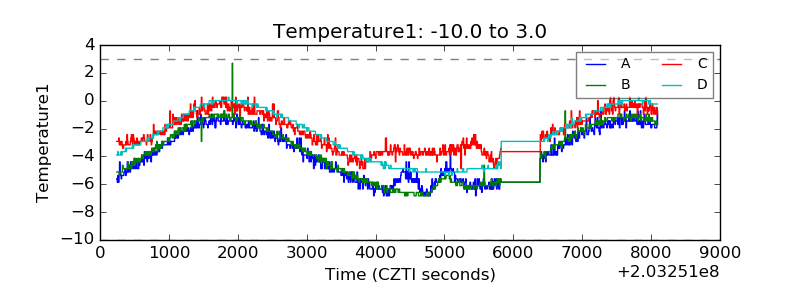 |
| Veto HV Monitor | 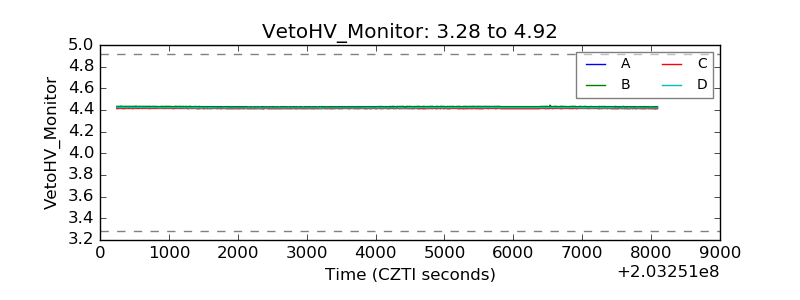 |
| Veto LLD | 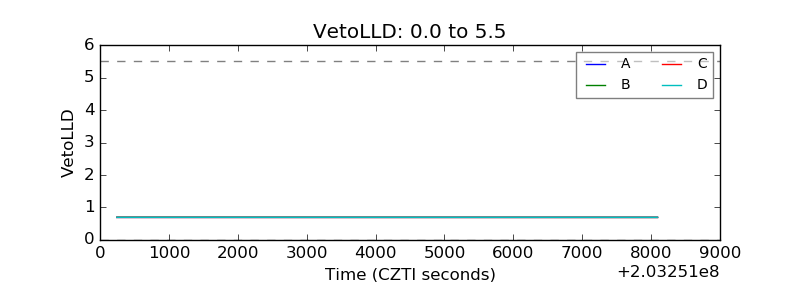 |
| Alpha Counter | 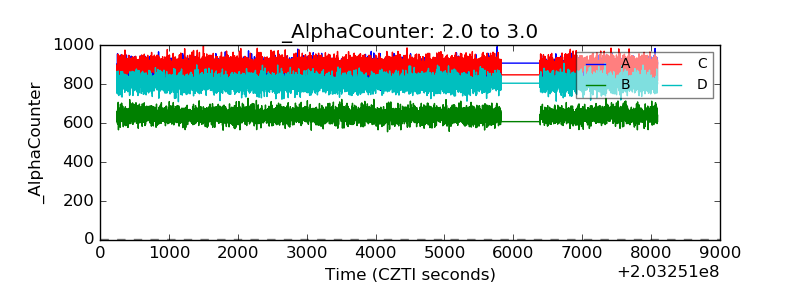 |
| _CPM_Rate | 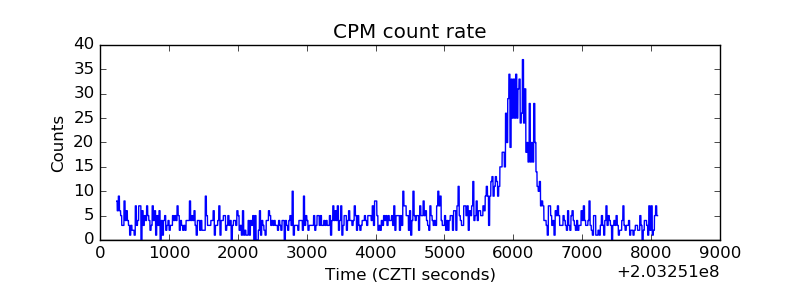 |
| CZT Counter | 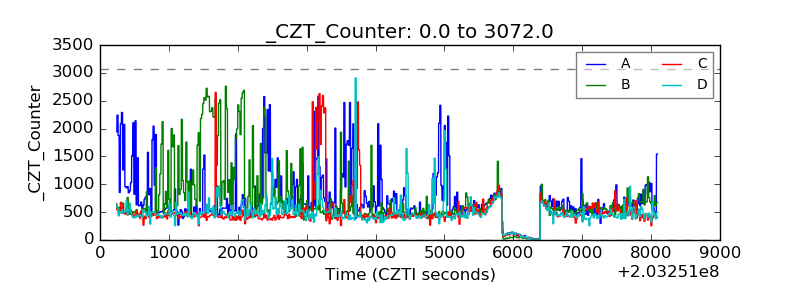 |
| +2.5 Volts monitor |  |
| +5 Volts monitor |  |
| Veto Counter | 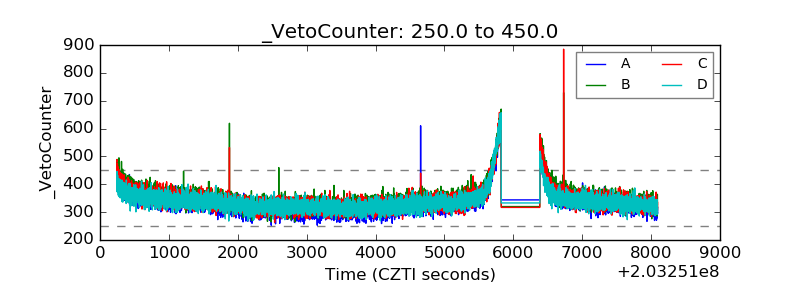 |