| Param | Original file | Final file |
|---|---|---|
| Filename | modeM0/AS1G05_152T03_9000000488_03796cztM0_level2.evt | modeM0/AS1G05_152T03_9000000488_03796cztM0_level2_quad_clean.evt |
| Size (bytes) | 684,720,000 | 85,584,960 |
| Size | 653.0 MB | 81.6 MB |
| Events in quadrant A | 4,991,336 | 535,708 |
| Events in quadrant B | 4,579,982 | 540,693 |
| Events in quadrant C | 3,509,139 | 538,128 |
| Events in quadrant D | 7,160,827 | 466,748 |
| Mode M9 | |||
|---|---|---|---|
| Quadrant | BADHDUFLAG | Total packets | Discarded packets |
| A | 0 | 1 | 0 |
| B | 0 | 1 | 0 |
| C | 0 | 1 | 0 |
| D | 0 | 1 | 0 |
| Mode SS | |||
|---|---|---|---|
| Quadrant | BADHDUFLAG | Total packets | Discarded packets |
| A | 0 | 150 | 0 |
| B | 0 | 150 | 0 |
| C | 0 | 150 | 0 |
| D | 0 | 150 | 0 |
| Mode M0 | |||
|---|---|---|---|
| Quadrant | BADHDUFLAG | Total packets | Discarded packets |
| A | 0 | 19637 | 3 |
| B | 0 | 18443 | 2 |
| C | 0 | 15745 | 2 |
| D | 0 | 26328 | 2 |
| Quadrant | Total seconds | Saturated seconds | Saturation percentage |
|---|---|---|---|
| A | 7317 | 259 | 3.539702% |
| B | 7317 | 161 | 2.200355% |
| C | 7317 | 125 | 1.708350% |
| D | 7317 | 1406 | 19.215525% |
Noise dominated data is calculated using 1-second bins in cleaned event files. If a bin has >2000 counts, and if more than 50% of those come from <1% of pixels, then it is considered to be noise-dominated and hence unusable.
| Quadrant | # 1 sec bins | Bins with >0 counts | Bins with >2000 counts | High rate bins dominated by noise | Noise dominated (total time) | Noise dominated (detector-on time) | Marked lightcurve |
|---|---|---|---|---|---|---|---|
| A | 7487 | 7319 | 134 | 134 | 1.79% | 1.83% | 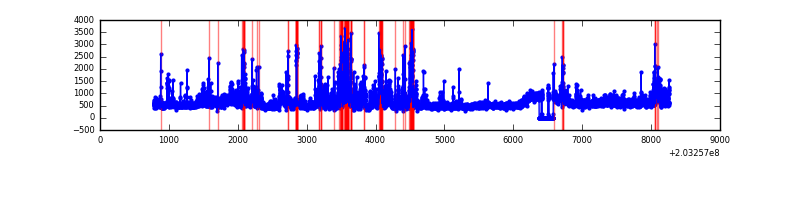 |
| B | 7487 | 7320 | 50 | 50 | 0.67% | 0.68% |  |
| C | 7487 | 7320 | 43 | 43 | 0.57% | 0.59% | 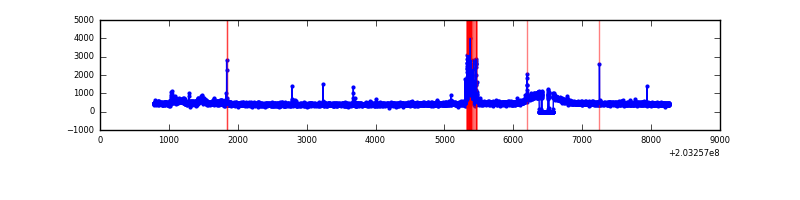 |
| D | 7487 | 7318 | 1182 | 1182 | 15.79% | 16.15% | 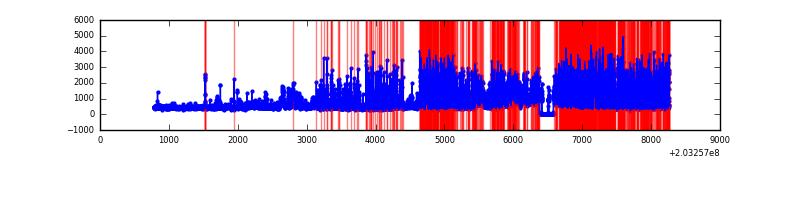 |
Top three noisy pixels from each quadrant. If the there are fewer than three noisy pixels in the level2.evt file, extra rows are filled as -1
| Pixel properties | Quadrant properties | ||||||
|---|---|---|---|---|---|---|---|
| Quadrant | DetID | PixID | Counts | Sigma | Mean | Median | Sigma |
| A | 13 | 251 | 1208858 | 6916.18 | 845 | 826 | 174.7 |
| A | 0 | 118 | 266193 | 1519.27 | 845 | 826 | 174.7 |
| A | 15 | 174 | 103453 | 587.56 | 845 | 826 | 174.7 |
| B | 15 | 204 | 618875 | 3700.03 | 858 | 837 | 167.0 |
| B | 14 | 167 | 348275 | 2080.02 | 858 | 837 | 167.0 |
| B | 4 | 81 | 112709 | 669.75 | 858 | 837 | 167.0 |
| C | 1 | 16 | 167856 | 855.12 | 828 | 832 | 195.3 |
| C | 2 | 53 | 76900 | 389.45 | 828 | 832 | 195.3 |
| C | 12 | 4 | 14839 | 71.71 | 828 | 832 | 195.3 |
| D | 2 | 63 | 3754170 | 20418.03 | 753 | 732 | 183.8 |
| D | 1 | 84 | 167220 | 905.66 | 753 | 732 | 183.8 |
| D | 8 | 112 | 118606 | 641.21 | 753 | 732 | 183.8 |
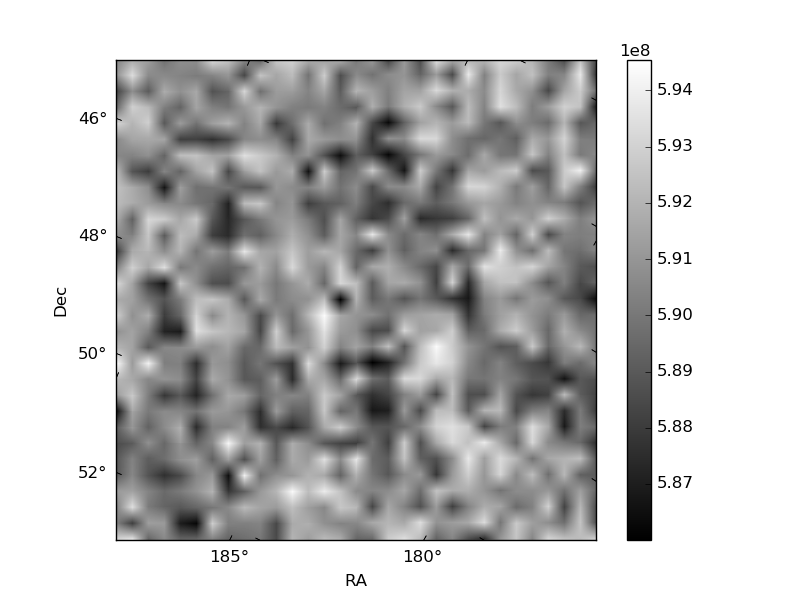
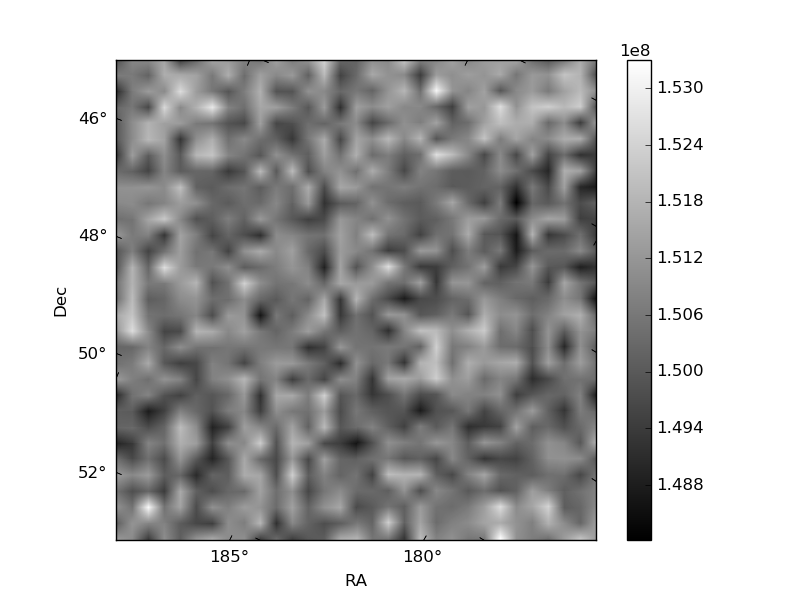
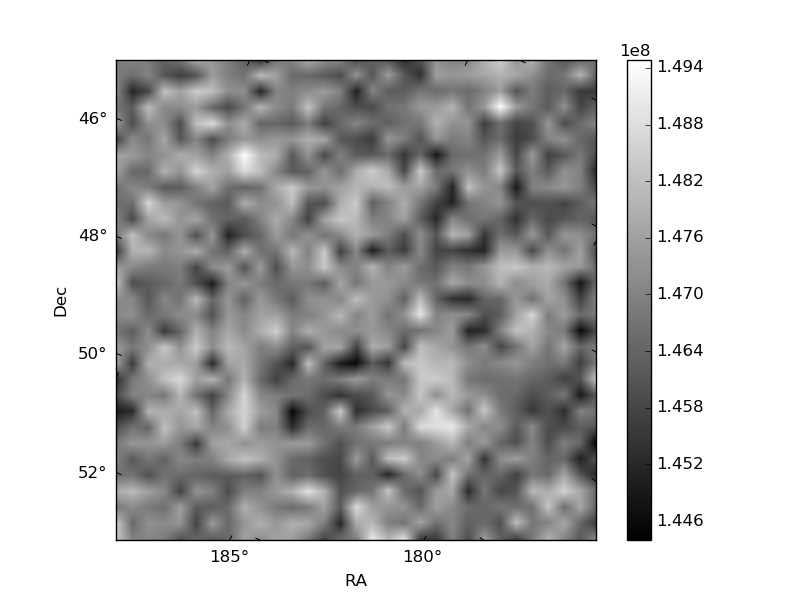
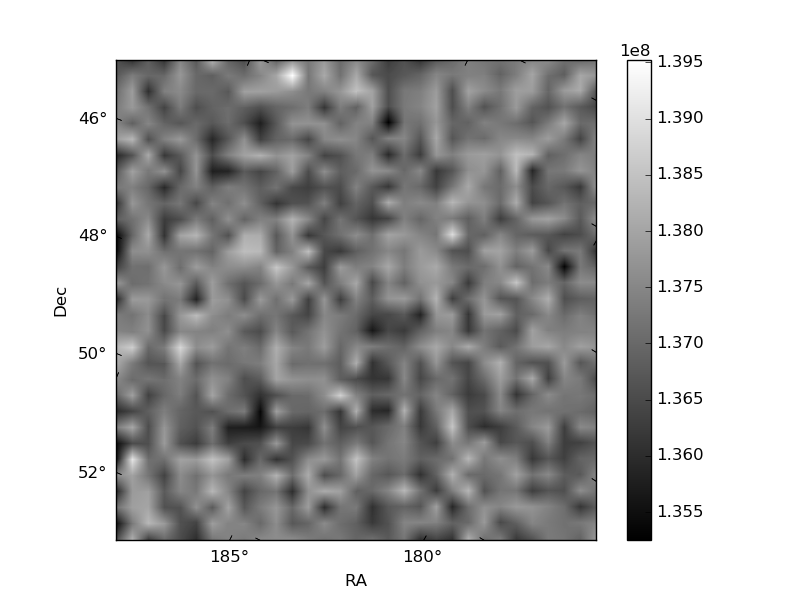
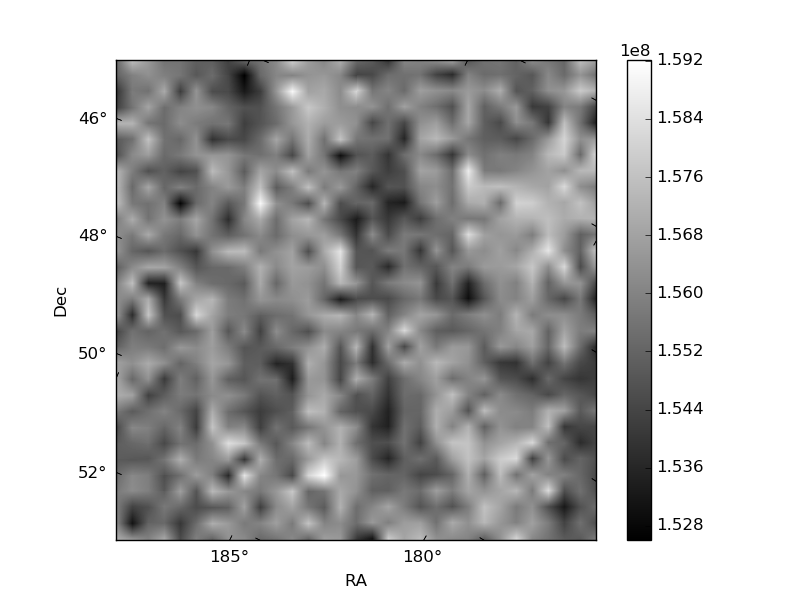
Histogram calculated using DETX and DETY for each event in the final _common_clean file
| Quadrant A | 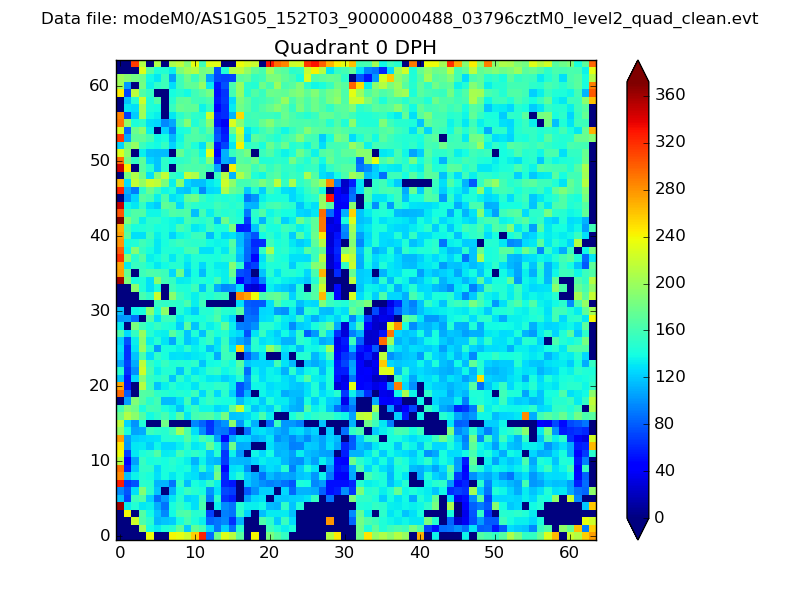 |
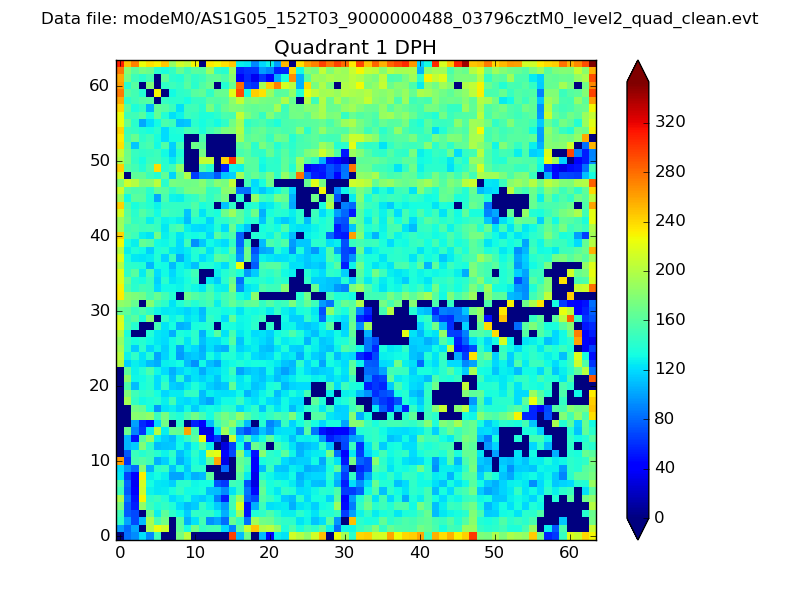 |
Quadrant B |
|---|---|---|---|
| Quadrant D | 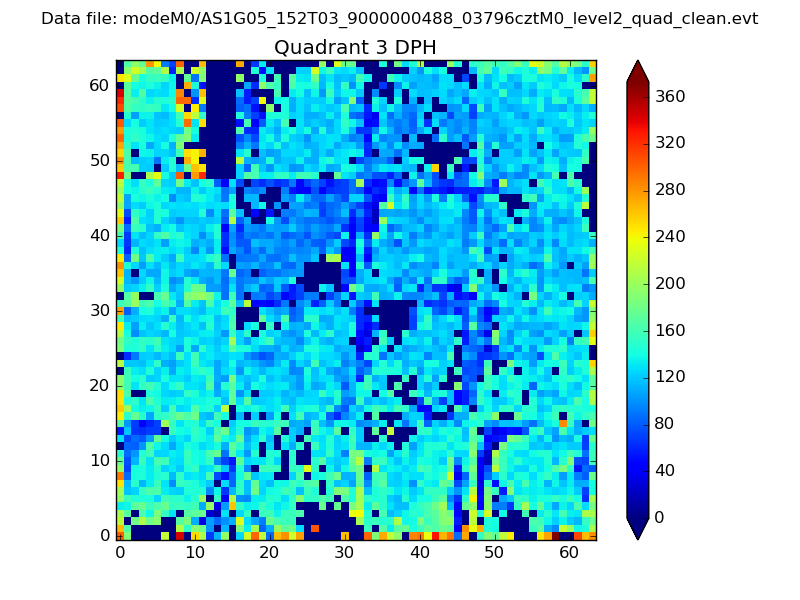 |
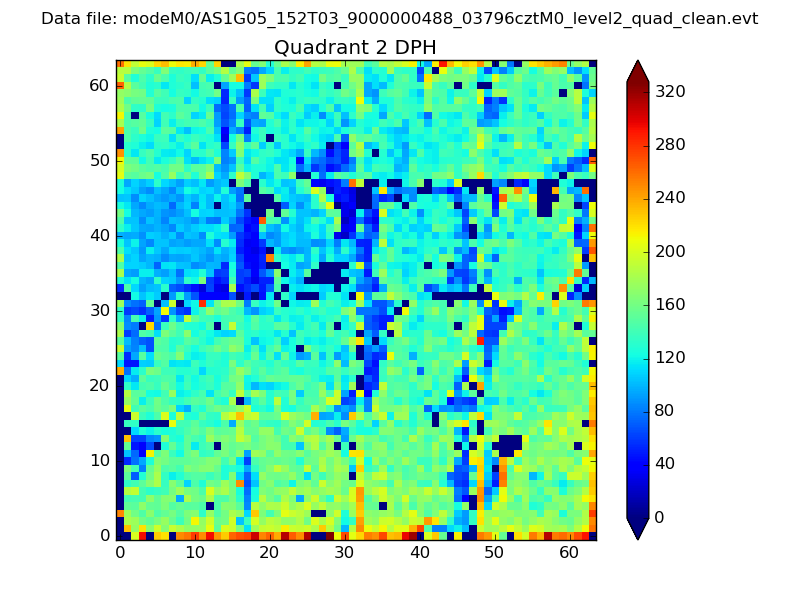 |
Quadrant C |
| Plot type | Count rate plots | Images |
|---|---|---|
| Comparison with Poisson distribution Blue bars denote a histogram of data divided into 1 sec bins. Red curve is a Poisson curve with rate = median count rate of data. |
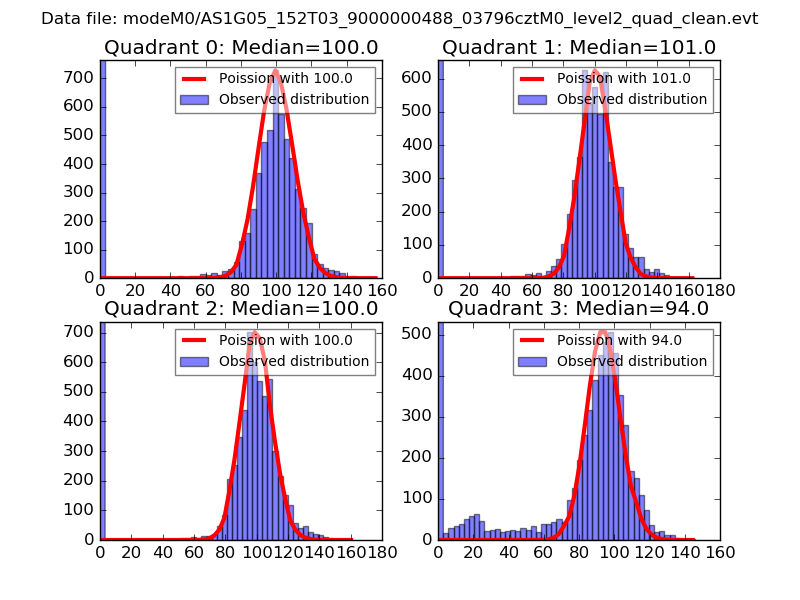 |
 |
| Quadrant-wise count rates Data is divided into 100 sec bins |
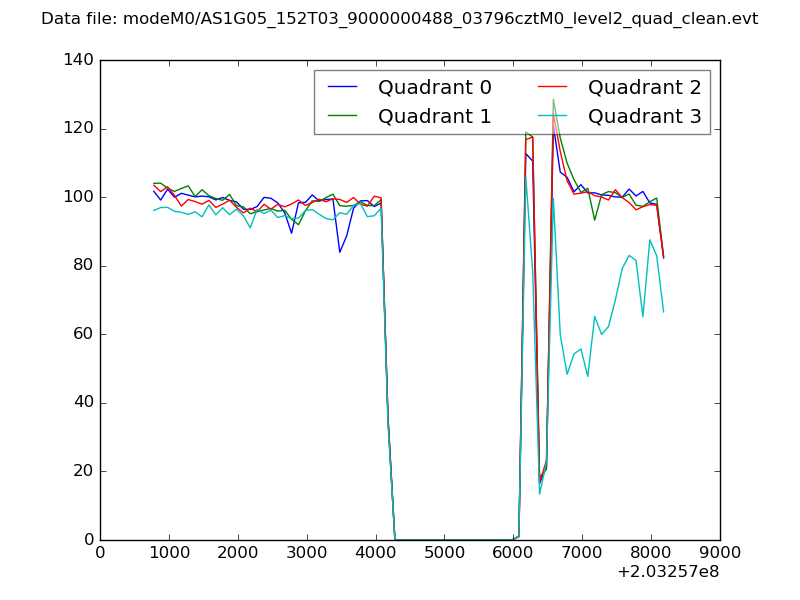 |
|
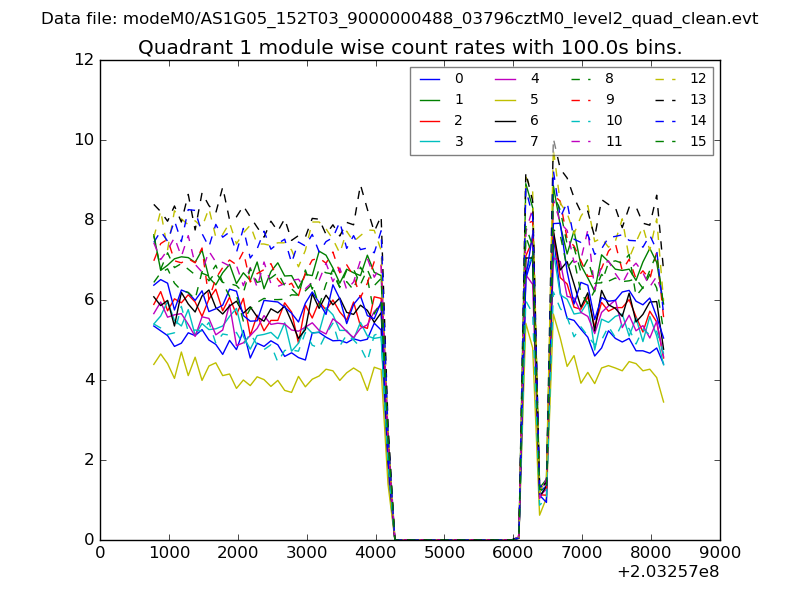
| Module-wise count rates for Quadrant A Data is divided into 100 sec bins |
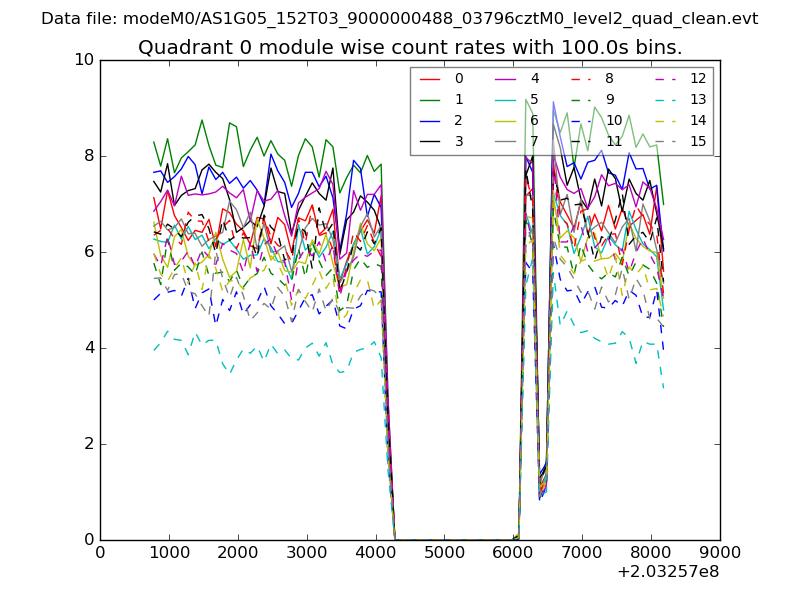 |
 |
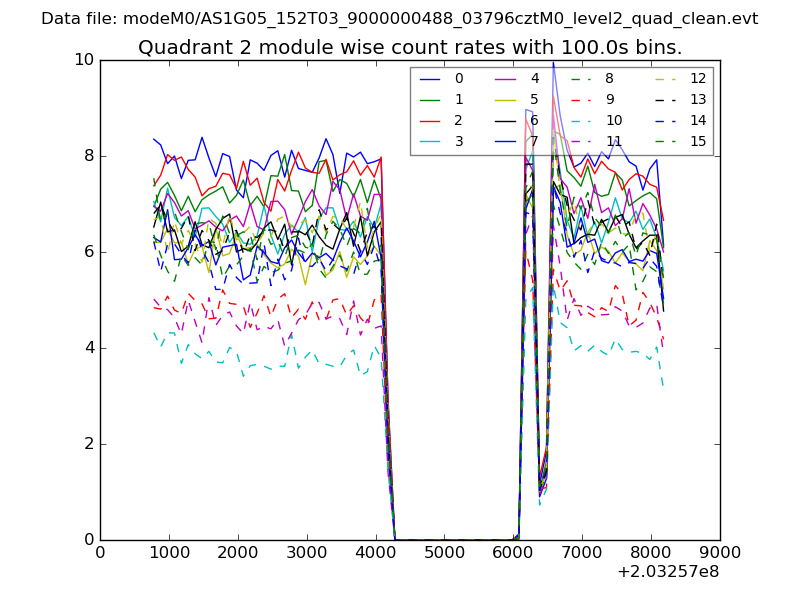
| Module-wise count rates for Quadrant B Data is divided into 100 sec bins |
 |
 |
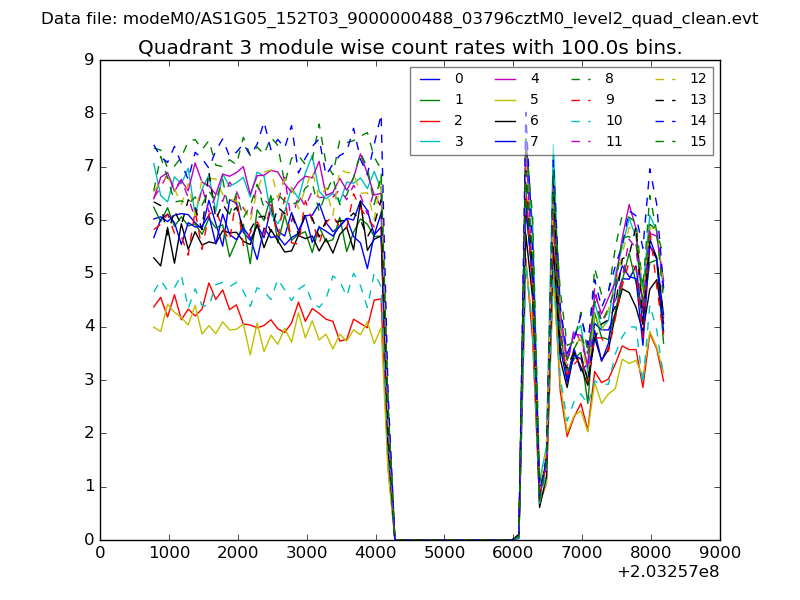
| Module-wise count rates for Quadrant C Data is divided into 100 sec bins |
 |
 |
| Module-wise count rates for Quadrant D Data is divided into 100 sec bins |
 |
 |
| Parameter | Plot |
|---|---|
| CZT HV Monitor | 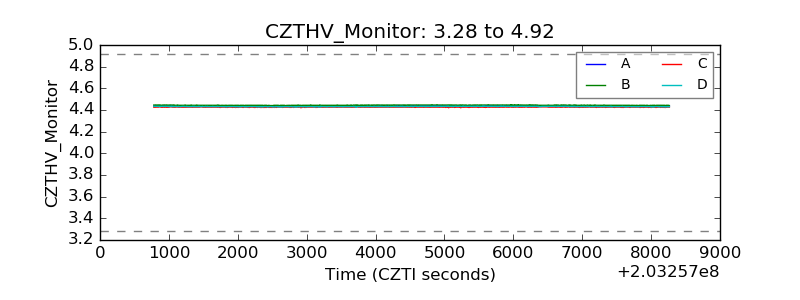 |
| D_VDD | 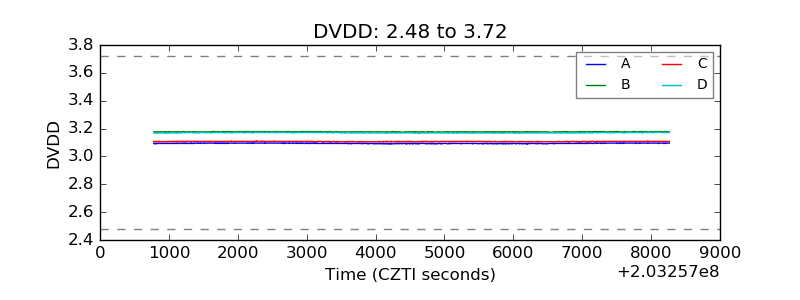 |
| Temperature 1 | 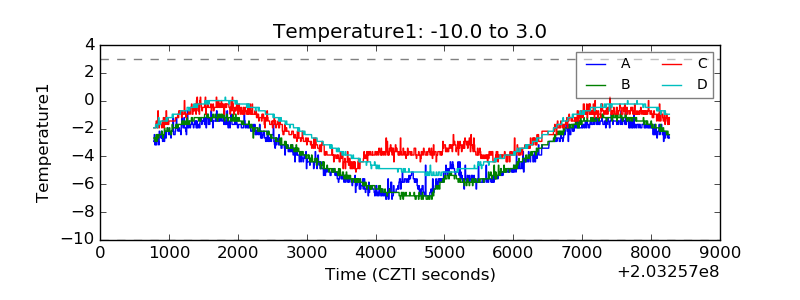 |
| Veto HV Monitor | 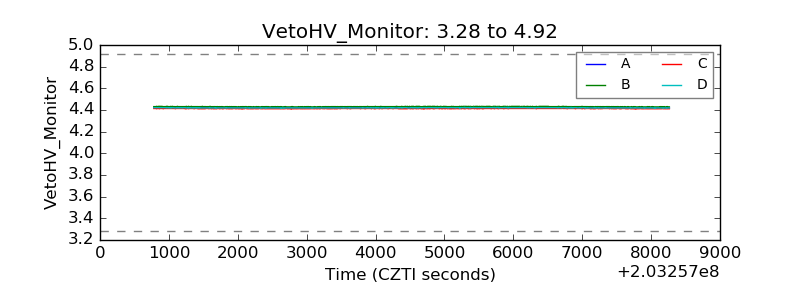 |
| Veto LLD | 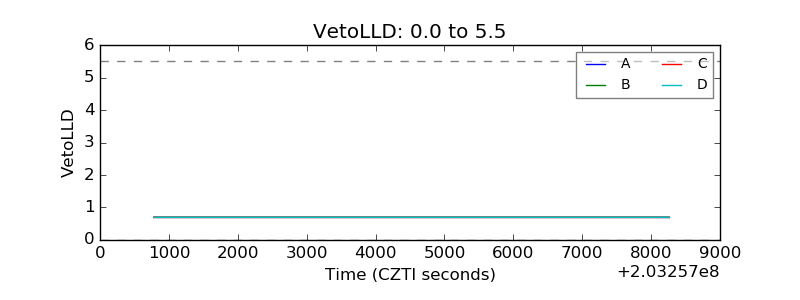 |
| Alpha Counter | 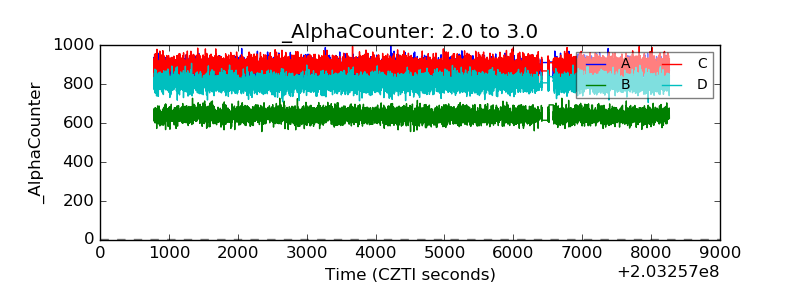 |
| _CPM_Rate | 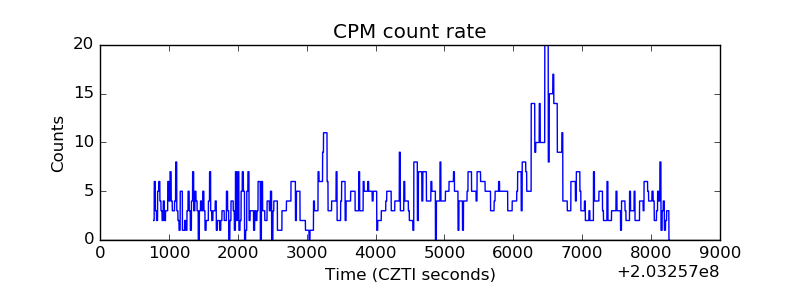 |
| CZT Counter | 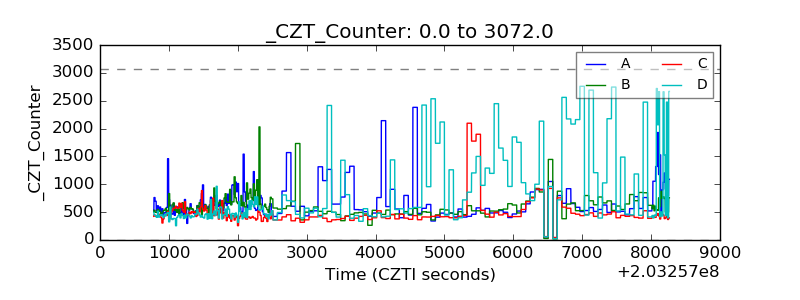 |
| +2.5 Volts monitor |  |
| +5 Volts monitor |  |
| Veto Counter | 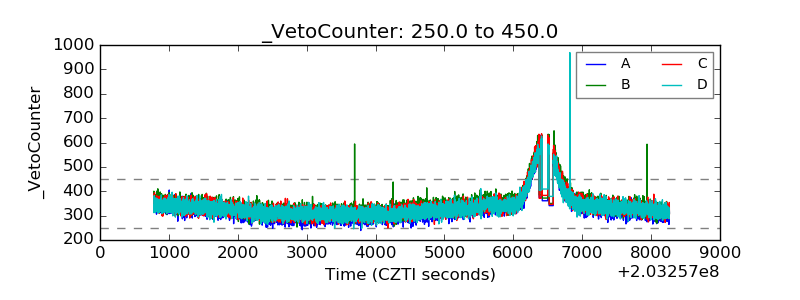 |