| Param | Original file | Final file |
|---|---|---|
| Filename | modeM0/AS1G05_152T03_9000000488_03797cztM0_level2.evt | modeM0/AS1G05_152T03_9000000488_03797cztM0_level2_quad_clean.evt |
| Size (bytes) | 649,923,840 | 85,314,240 |
| Size | 619.8 MB | 81.4 MB |
| Events in quadrant A | 4,842,005 | 532,207 |
| Events in quadrant B | 4,598,939 | 535,634 |
| Events in quadrant C | 3,401,136 | 534,444 |
| Events in quadrant D | 6,347,104 | 472,776 |
| Mode M9 | |||
|---|---|---|---|
| Quadrant | BADHDUFLAG | Total packets | Discarded packets |
| A | 0 | 2 | 0 |
| B | 0 | 2 | 0 |
| C | 0 | 2 | 0 |
| D | 0 | 2 | 0 |
| Mode SS | |||
|---|---|---|---|
| Quadrant | BADHDUFLAG | Total packets | Discarded packets |
| A | 0 | 150 | 0 |
| B | 0 | 150 | 0 |
| C | 0 | 150 | 0 |
| D | 0 | 150 | 0 |
| Mode M0 | |||
|---|---|---|---|
| Quadrant | BADHDUFLAG | Total packets | Discarded packets |
| A | 0 | 19389 | 2 |
| B | 0 | 18753 | 1 |
| C | 0 | 15465 | 1 |
| D | 0 | 23950 | 1 |
| Quadrant | Total seconds | Saturated seconds | Saturation percentage |
|---|---|---|---|
| A | 7293 | 230 | 3.153709% |
| B | 7293 | 220 | 3.016591% |
| C | 7293 | 86 | 1.179213% |
| D | 7293 | 928 | 12.724530% |
Noise dominated data is calculated using 1-second bins in cleaned event files. If a bin has >2000 counts, and if more than 50% of those come from <1% of pixels, then it is considered to be noise-dominated and hence unusable.
| Quadrant | # 1 sec bins | Bins with >0 counts | Bins with >2000 counts | High rate bins dominated by noise | Noise dominated (total time) | Noise dominated (detector-on time) | Marked lightcurve |
|---|---|---|---|---|---|---|---|
| A | 7428 | 7294 | 106 | 106 | 1.43% | 1.45% |  |
| B | 7428 | 7295 | 83 | 83 | 1.12% | 1.14% | 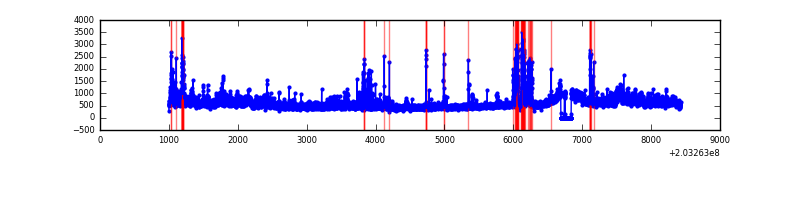 |
| C | 7428 | 7294 | 28 | 28 | 0.38% | 0.38% | 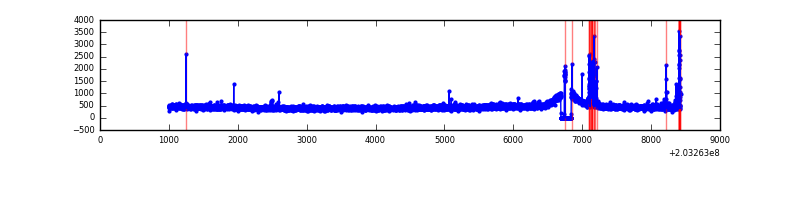 |
| D | 7428 | 7295 | 847 | 847 | 11.40% | 11.61% |  |
Top three noisy pixels from each quadrant. If the there are fewer than three noisy pixels in the level2.evt file, extra rows are filled as -1
| Pixel properties | Quadrant properties | ||||||
|---|---|---|---|---|---|---|---|
| Quadrant | DetID | PixID | Counts | Sigma | Mean | Median | Sigma |
| A | 13 | 251 | 868581 | 5016.08 | 839 | 818 | 173.0 |
| A | 0 | 118 | 383917 | 2214.49 | 839 | 818 | 173.0 |
| A | 13 | 164 | 156731 | 901.25 | 839 | 818 | 173.0 |
| B | 15 | 204 | 536442 | 3206.5 | 850 | 827 | 167.0 |
| B | 5 | 200 | 236058 | 1408.23 | 850 | 827 | 167.0 |
| B | 14 | 167 | 175361 | 1044.86 | 850 | 827 | 167.0 |
| C | 14 | 234 | 136679 | 706.39 | 822 | 827 | 192.3 |
| C | 2 | 53 | 23620 | 118.52 | 822 | 827 | 192.3 |
| C | 12 | 4 | 11244 | 54.17 | 822 | 827 | 192.3 |
| D | 2 | 63 | 2865669 | 14972.48 | 778 | 755 | 191.3 |
| D | 8 | 112 | 269542 | 1404.72 | 778 | 755 | 191.3 |
| D | 13 | 239 | 73952 | 382.54 | 778 | 755 | 191.3 |
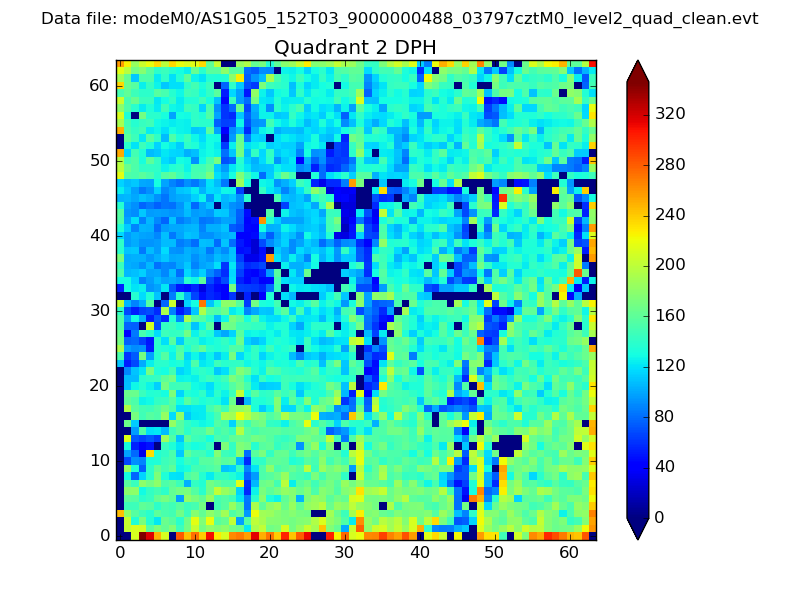
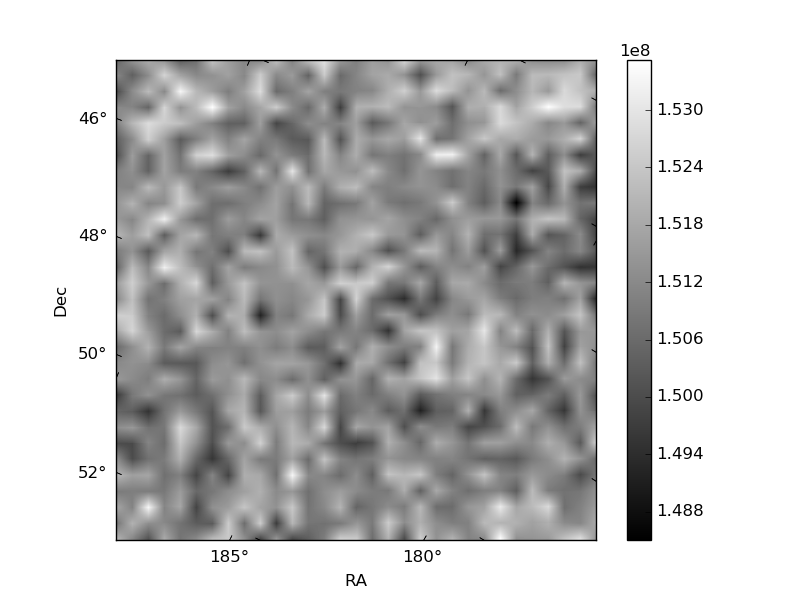
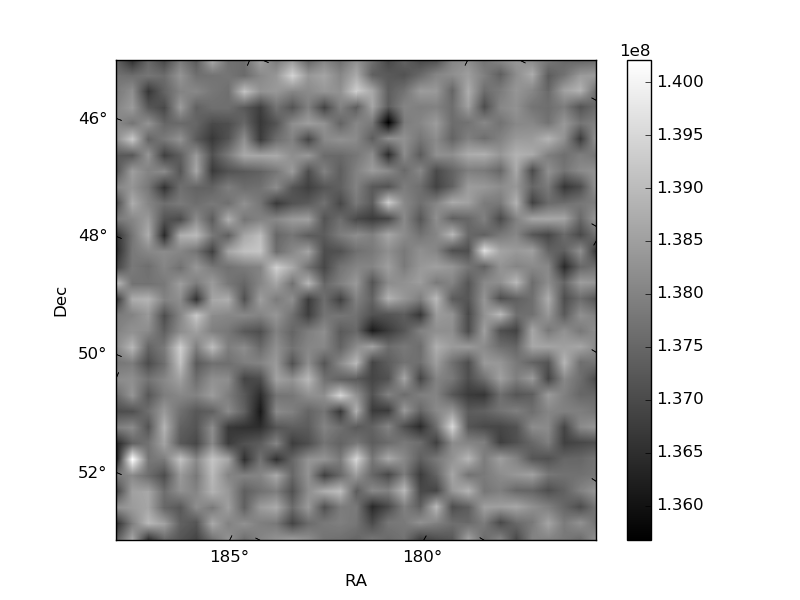
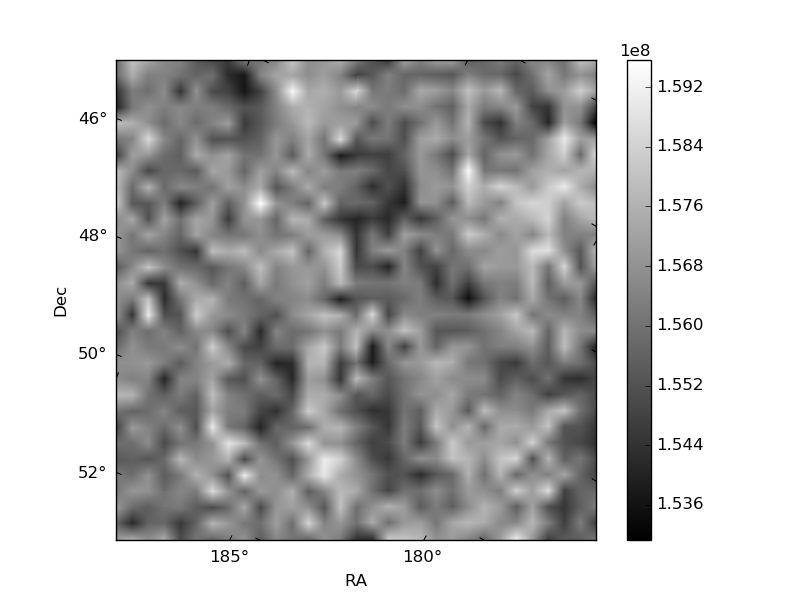
Histogram calculated using DETX and DETY for each event in the final _common_clean file
| Quadrant A | 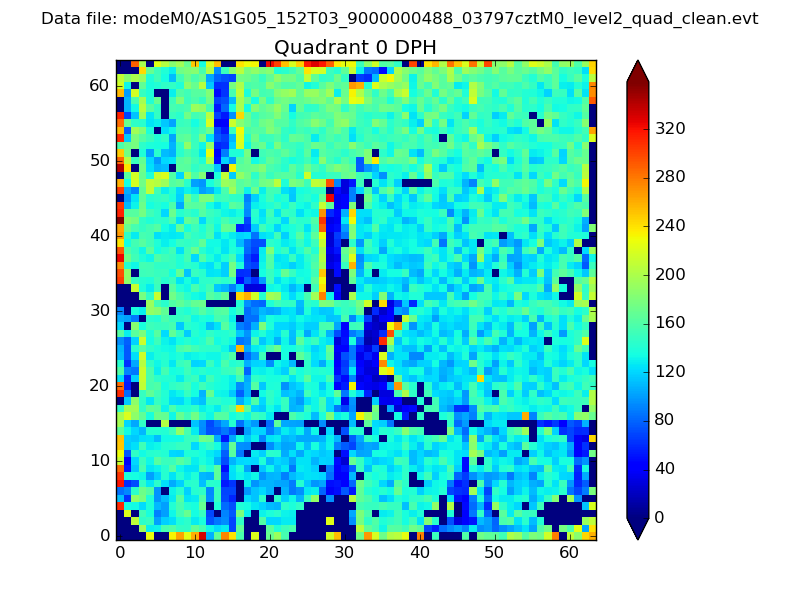 |
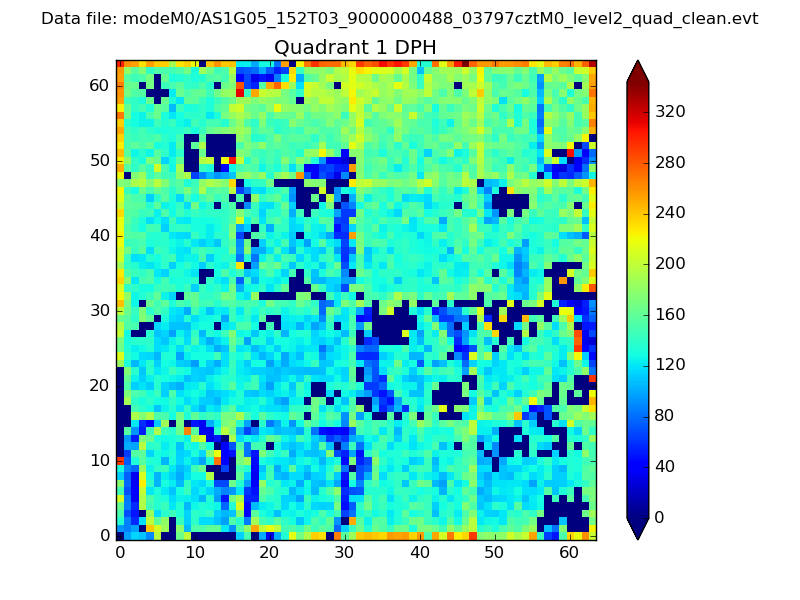 |
Quadrant B |
|---|---|---|---|
| Quadrant D | 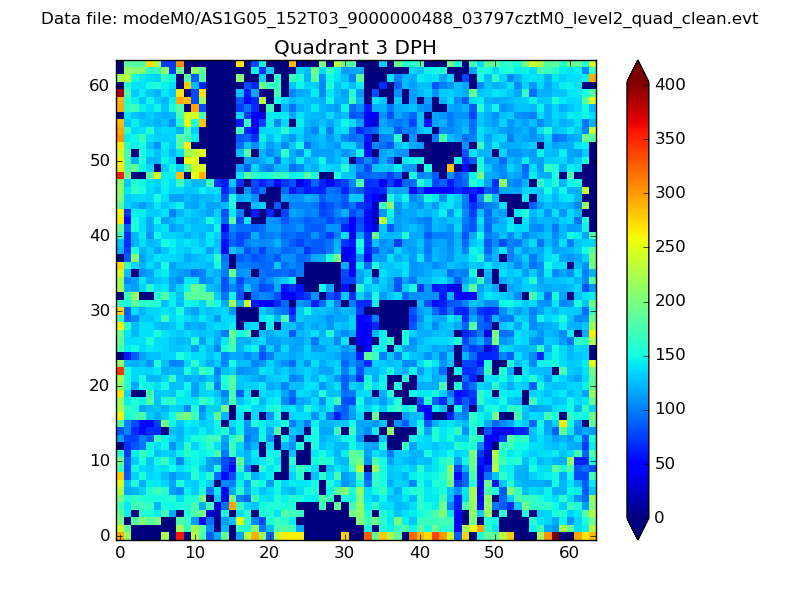 |
 |
Quadrant C |
| Plot type | Count rate plots | Images |
|---|---|---|
| Comparison with Poisson distribution Blue bars denote a histogram of data divided into 1 sec bins. Red curve is a Poisson curve with rate = median count rate of data. |
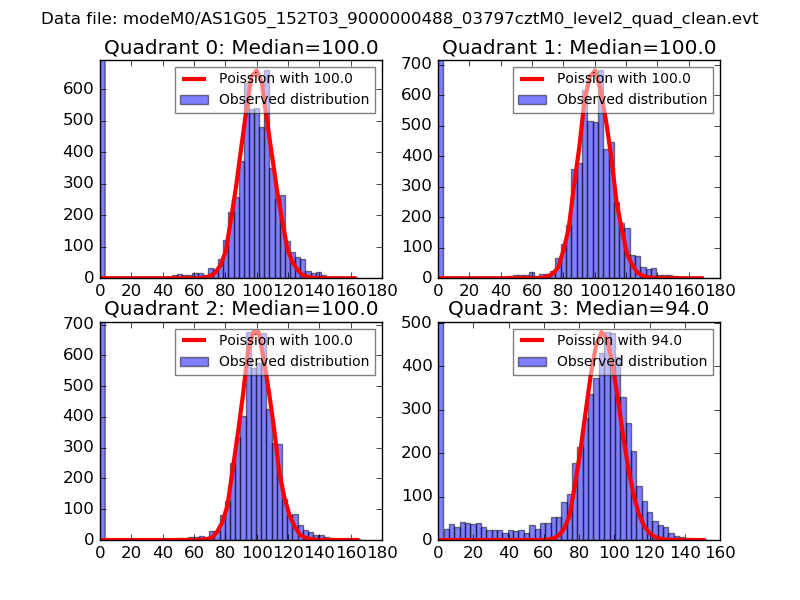 |
 |
| Quadrant-wise count rates Data is divided into 100 sec bins |
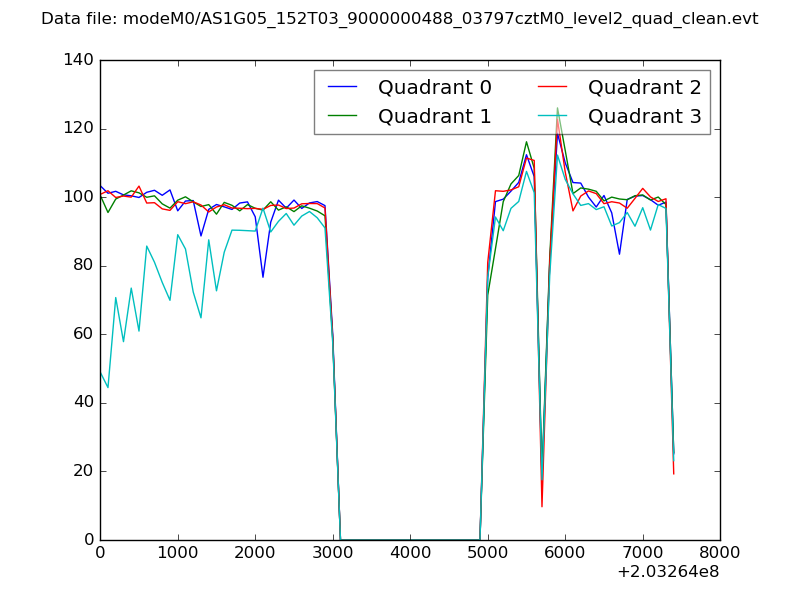 |
|
| Module-wise count rates for Quadrant A Data is divided into 100 sec bins |
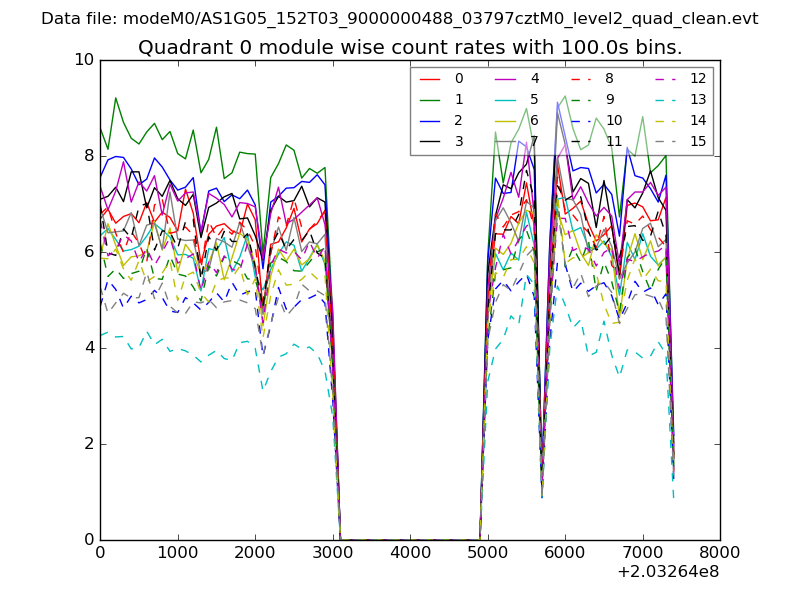 |
 |
| Module-wise count rates for Quadrant B Data is divided into 100 sec bins |
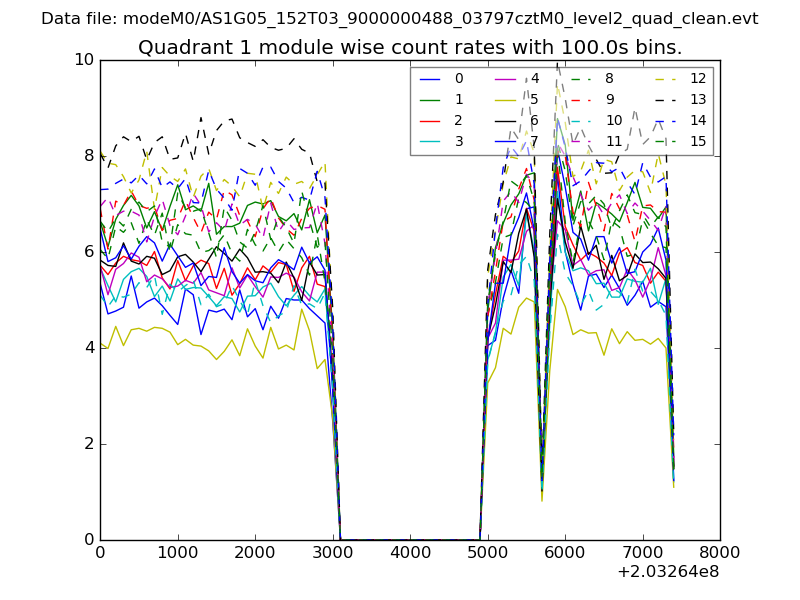 |
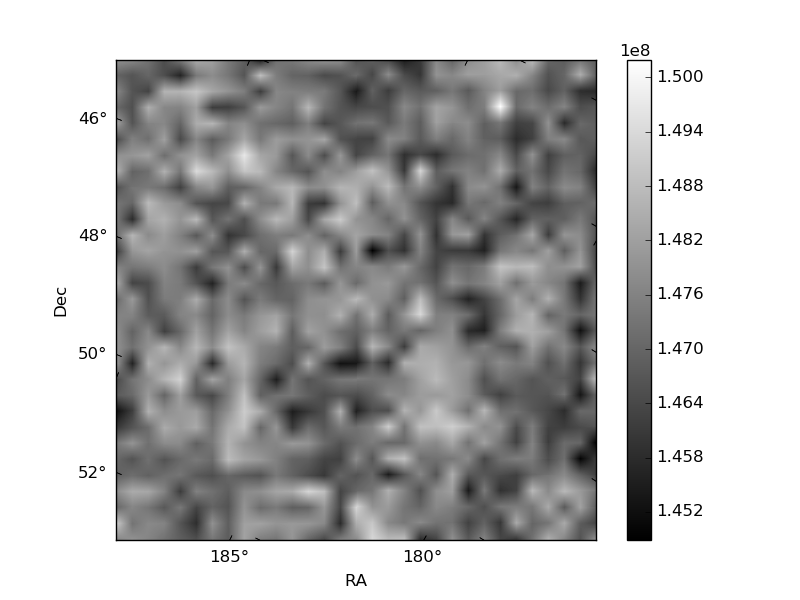 |
| Module-wise count rates for Quadrant C Data is divided into 100 sec bins |
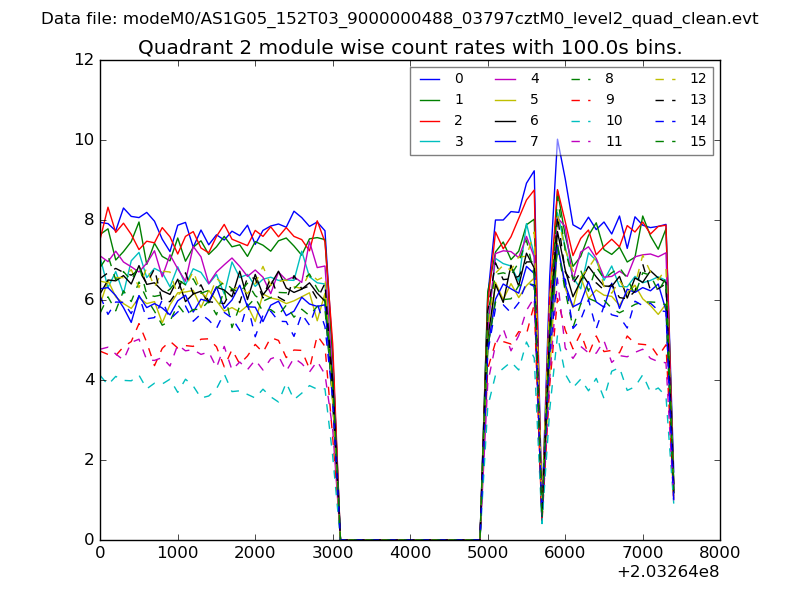 |
 |
| Module-wise count rates for Quadrant D Data is divided into 100 sec bins |
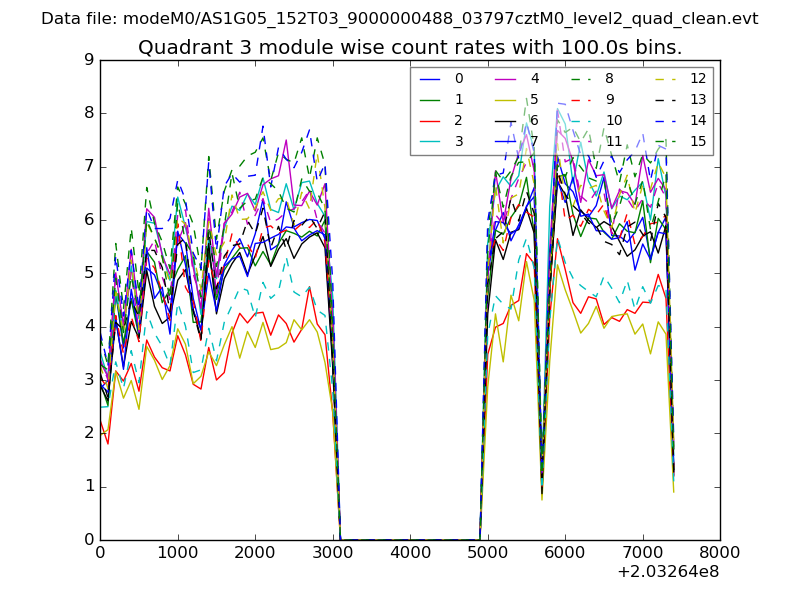 |
 |
| Parameter | Plot |
|---|---|
| CZT HV Monitor | 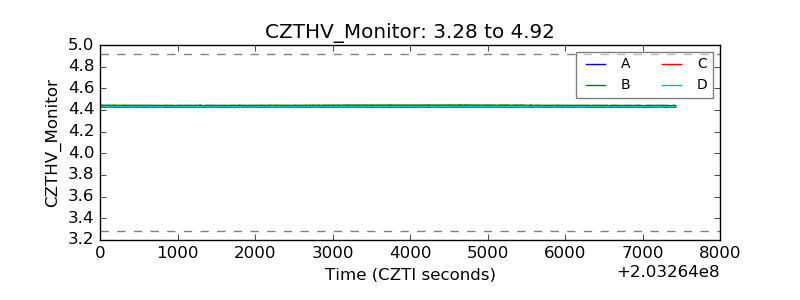 |
| D_VDD | 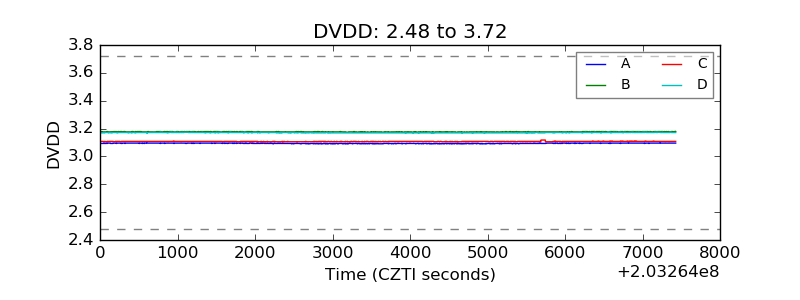 |
| Temperature 1 | 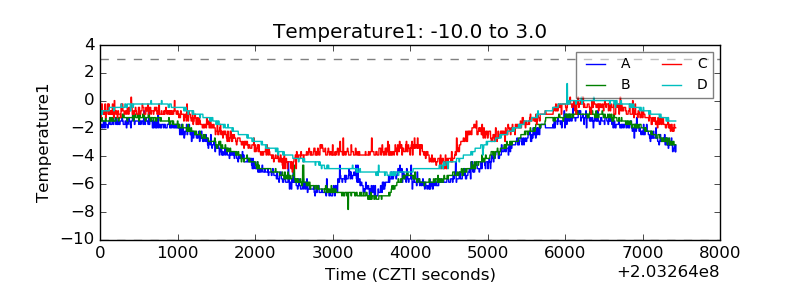 |
| Veto HV Monitor | 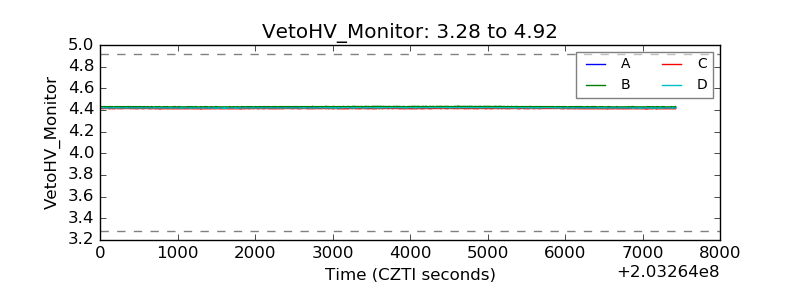 |
| Veto LLD | 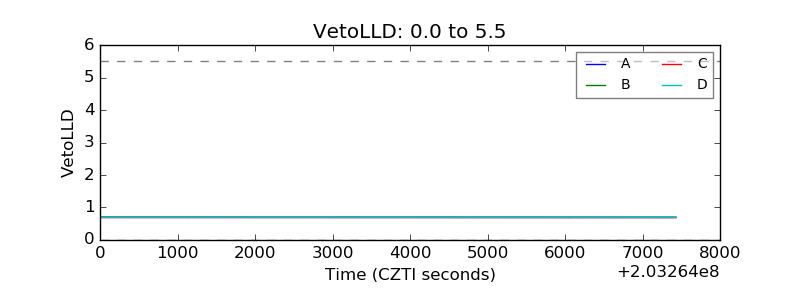 |
| Alpha Counter | 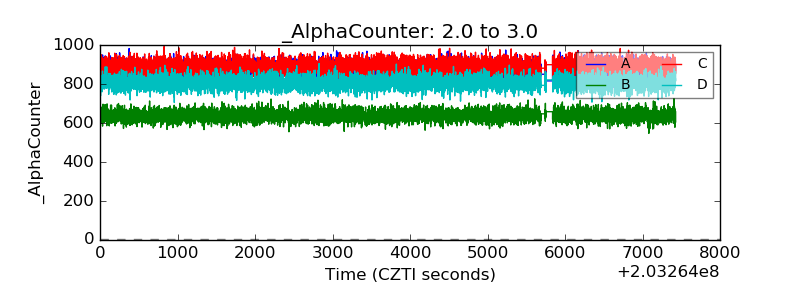 |
| _CPM_Rate | 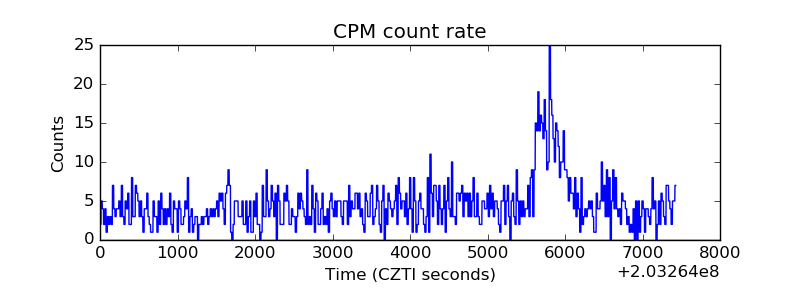 |
| CZT Counter | 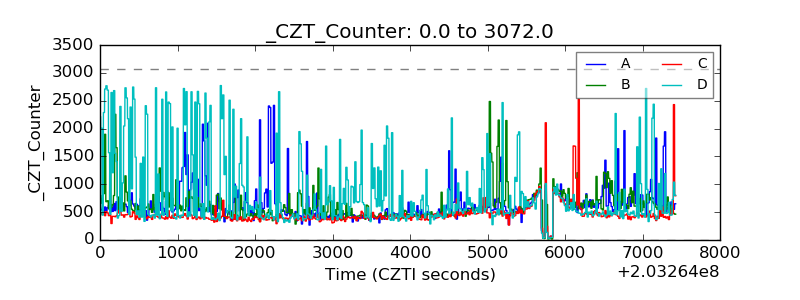 |
| +2.5 Volts monitor |  |
| +5 Volts monitor |  |
| Veto Counter | 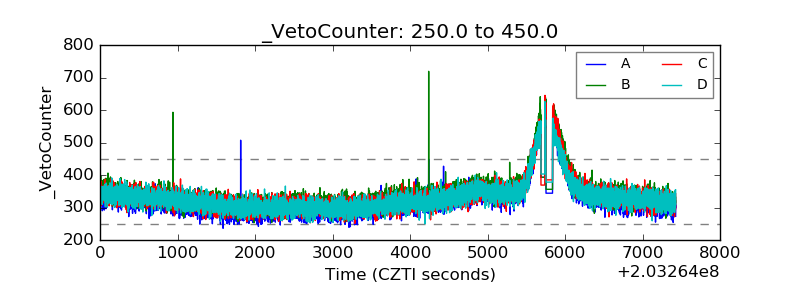 |