| Param | Original file | Final file |
|---|---|---|
| Filename | modeM0/AS1G05_152T03_9000000488_03798cztM0_level2.evt | modeM0/AS1G05_152T03_9000000488_03798cztM0_level2_quad_clean.evt |
| Size (bytes) | 170,683,200 | 30,015,360 |
| Size | 162.8 MB | 28.6 MB |
| Events in quadrant A | 1,505,354 | 191,764 |
| Events in quadrant B | 1,259,675 | 193,999 |
| Events in quadrant C | 883,108 | 193,558 |
| Events in quadrant D | 1,384,649 | 185,433 |
| Mode SS | |||
|---|---|---|---|
| Quadrant | BADHDUFLAG | Total packets | Discarded packets |
| A | 0 | 40 | 0 |
| B | 0 | 40 | 0 |
| C | 0 | 40 | 0 |
| D | 0 | 40 | 0 |
| Mode M0 | |||
|---|---|---|---|
| Quadrant | BADHDUFLAG | Total packets | Discarded packets |
| A | 0 | 5867 | 5 |
| B | 0 | 5134 | 4 |
| C | 0 | 4113 | 2 |
| D | 0 | 5521 | 4 |
| Quadrant | Total seconds | Saturated seconds | Saturation percentage |
|---|---|---|---|
| A | 1974 | 71 | 3.596758% |
| B | 1974 | 2 | 0.101317% |
| C | 1975 | 16 | 0.810127% |
| D | 1974 | 97 | 4.913880% |
Noise dominated data is calculated using 1-second bins in cleaned event files. If a bin has >2000 counts, and if more than 50% of those come from <1% of pixels, then it is considered to be noise-dominated and hence unusable.
| Quadrant | # 1 sec bins | Bins with >0 counts | Bins with >2000 counts | High rate bins dominated by noise | Noise dominated (total time) | Noise dominated (detector-on time) | Marked lightcurve |
|---|---|---|---|---|---|---|---|
| A | 1976 | 1976 | 40 | 40 | 2.02% | 2.02% | 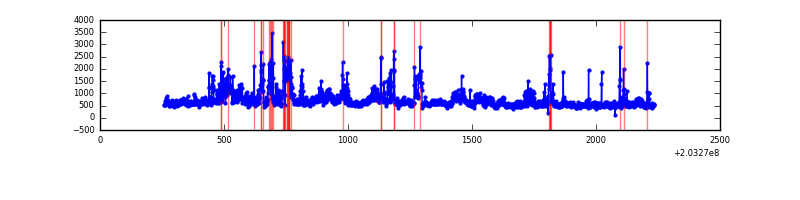 |
| B | 1976 | 1976 | 0 | 0 | 0.00% | 0.00% | 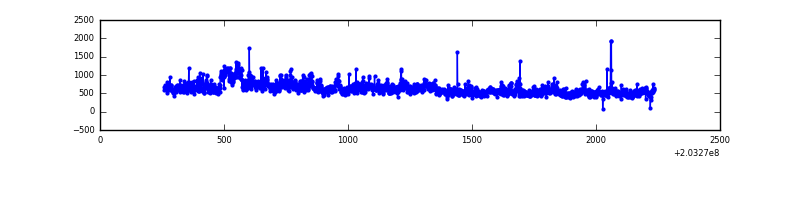 |
| C | 1976 | 1976 | 14 | 14 | 0.71% | 0.71% | 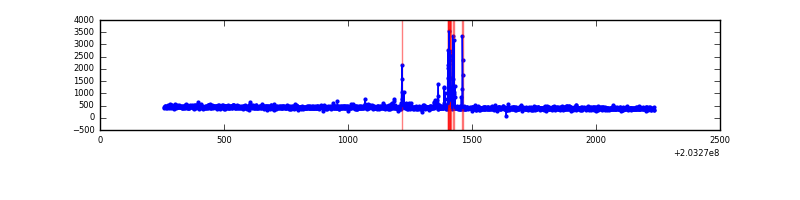 |
| D | 1976 | 1976 | 94 | 94 | 4.76% | 4.76% | 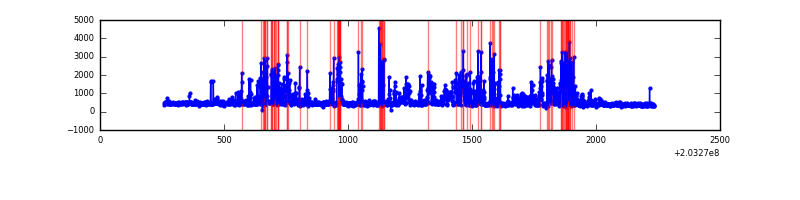 |
Top three noisy pixels from each quadrant. If the there are fewer than three noisy pixels in the level2.evt file, extra rows are filled as -1
| Pixel properties | Quadrant properties | ||||||
|---|---|---|---|---|---|---|---|
| Quadrant | DetID | PixID | Counts | Sigma | Mean | Median | Sigma |
| A | 13 | 251 | 467974 | 10402.05 | 208 | 204 | 45.0 |
| A | 0 | 118 | 184377 | 4095.55 | 208 | 204 | 45.0 |
| A | 0 | 226 | 19395 | 426.76 | 208 | 204 | 45.0 |
| B | 15 | 204 | 238824 | 5615.3 | 212 | 207 | 42.5 |
| B | 0 | 173 | 114054 | 2679.13 | 212 | 207 | 42.5 |
| B | 14 | 167 | 42675 | 999.39 | 212 | 207 | 42.5 |
| C | 14 | 234 | 62853 | 1255.04 | 208 | 208 | 49.9 |
| C | 10 | 65 | 3375 | 63.44 | 208 | 208 | 49.9 |
| C | 13 | 61 | 1880 | 33.49 | 208 | 208 | 49.9 |
| D | 2 | 63 | 531790 | 10188.4 | 208 | 201 | 52.2 |
| D | 8 | 112 | 33217 | 632.78 | 208 | 201 | 52.2 |
| D | 1 | 84 | 14823 | 280.24 | 208 | 201 | 52.2 |
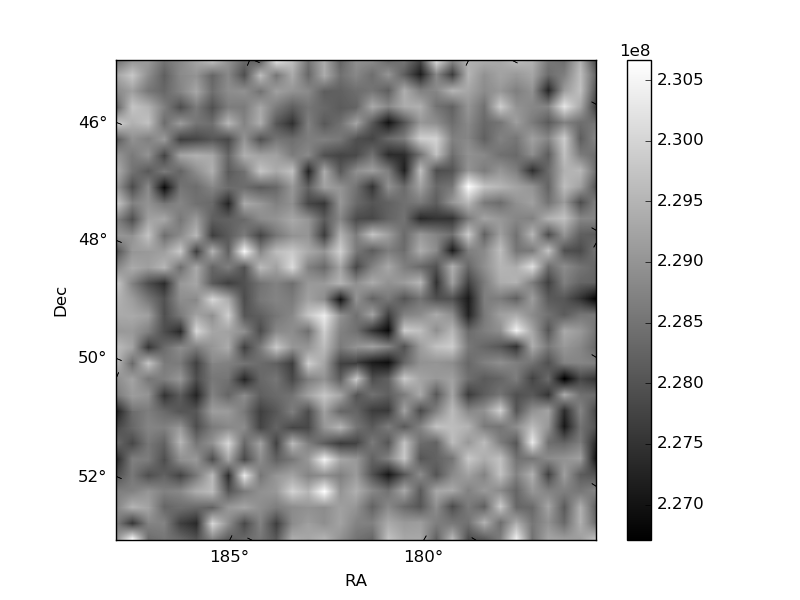
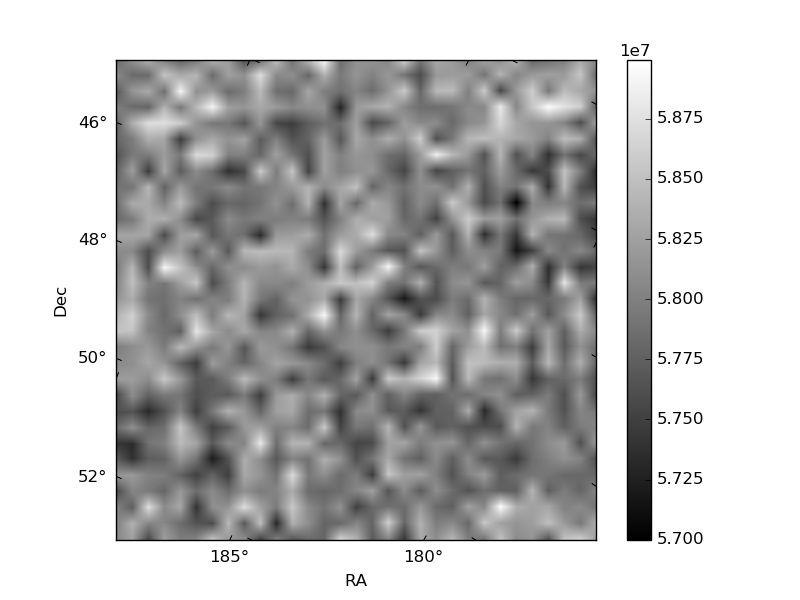
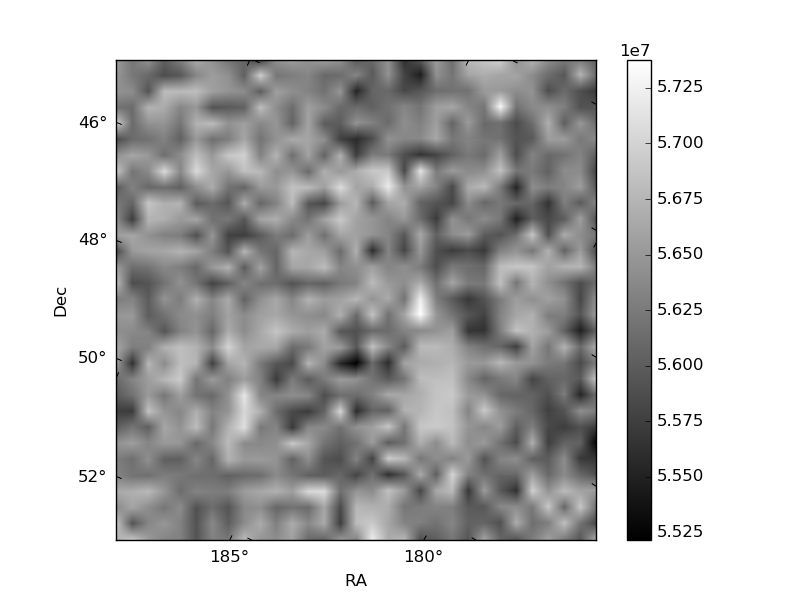
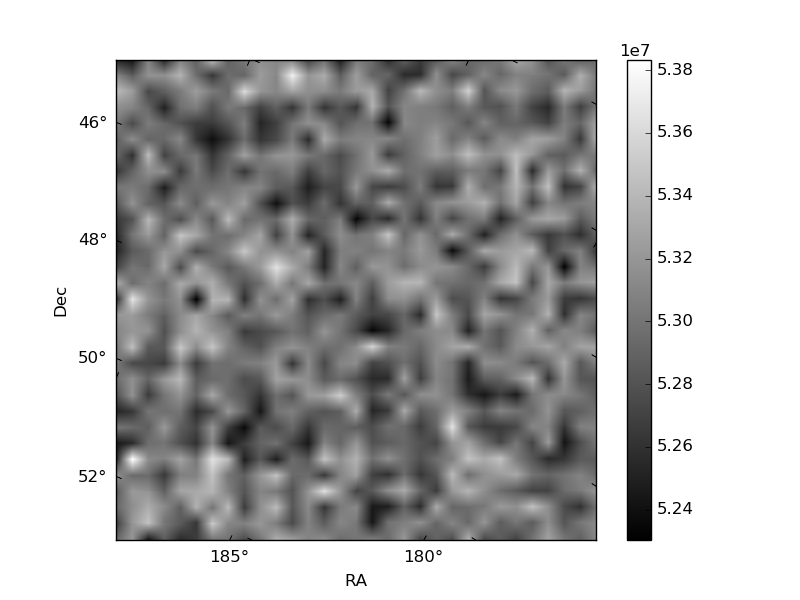
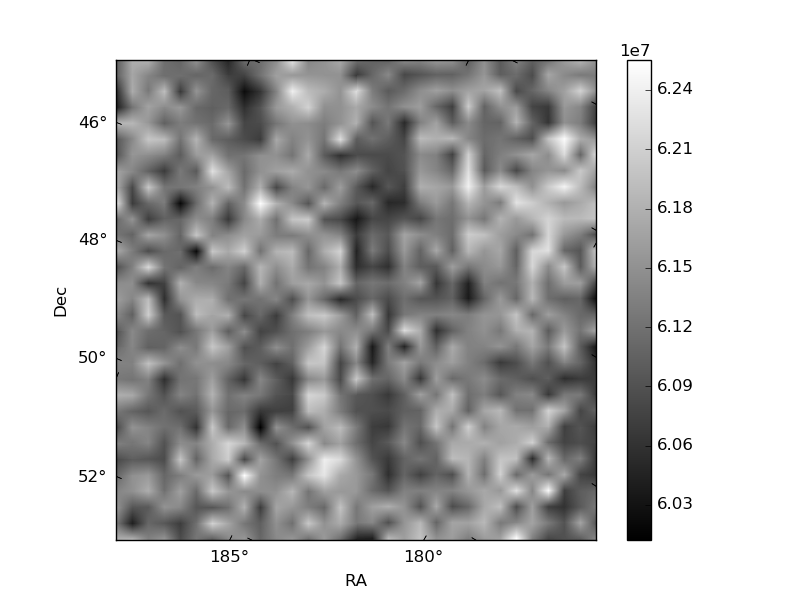
Histogram calculated using DETX and DETY for each event in the final _common_clean file
| Quadrant A | 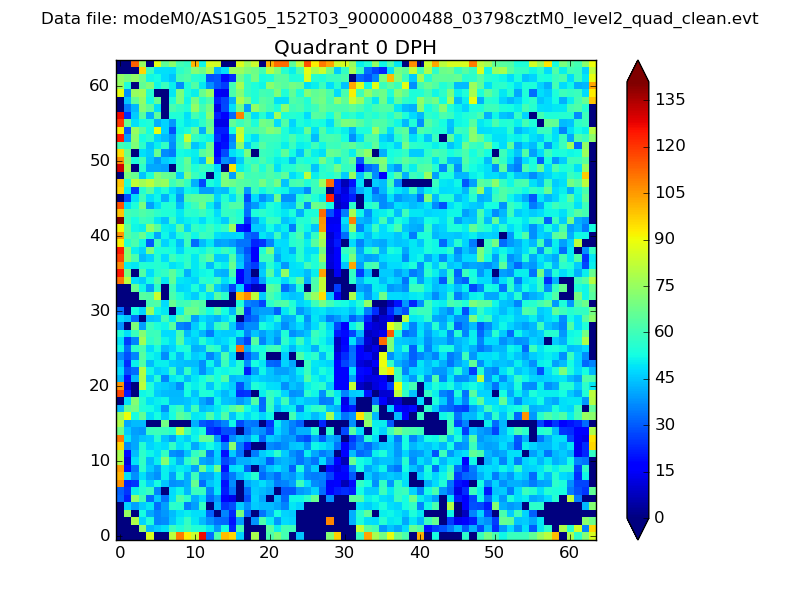 |
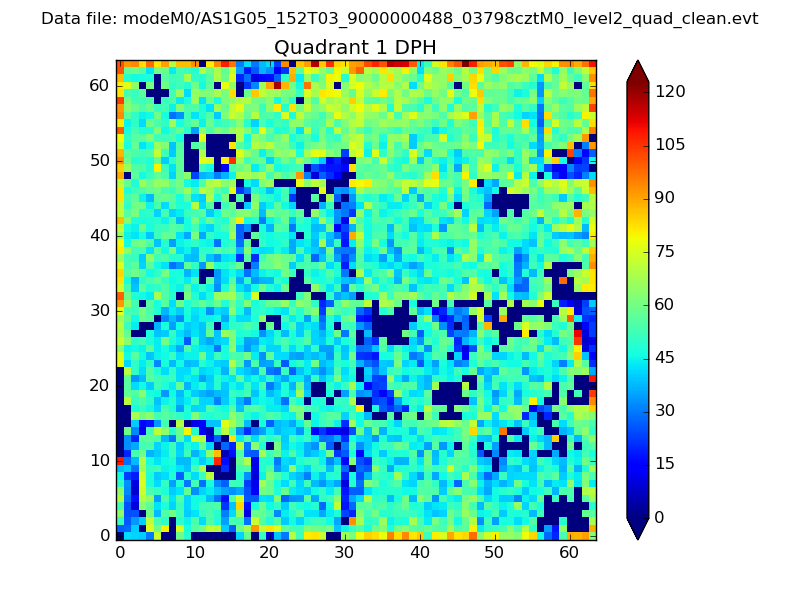 |
Quadrant B |
|---|---|---|---|
| Quadrant D | 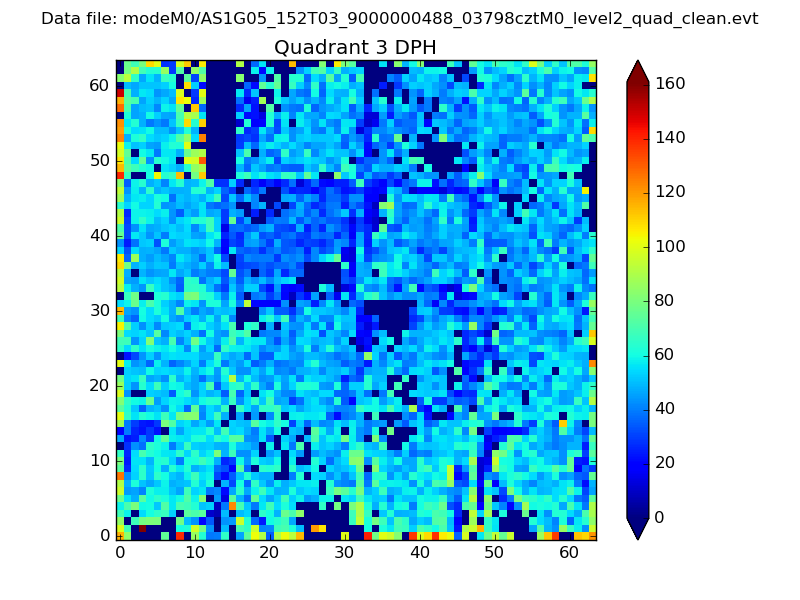 |
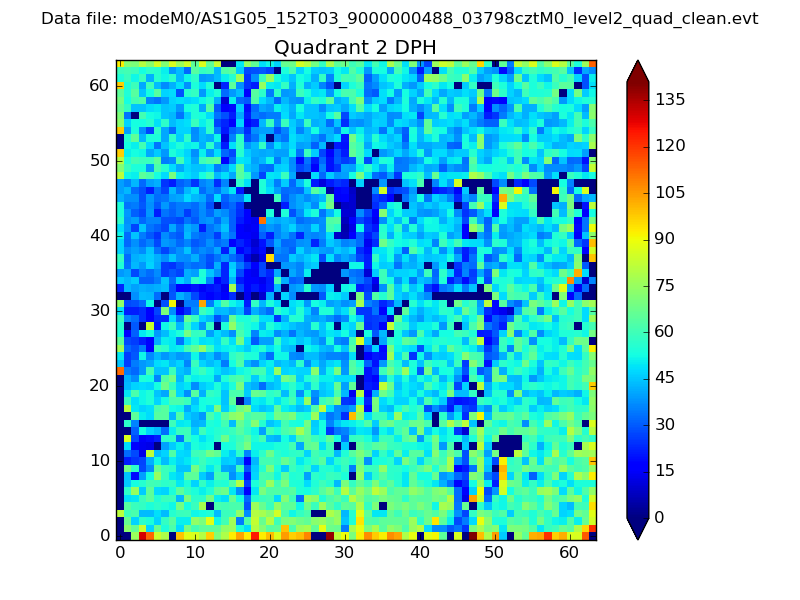 |
Quadrant C |
| Plot type | Count rate plots | Images |
|---|---|---|
| Comparison with Poisson distribution Blue bars denote a histogram of data divided into 1 sec bins. Red curve is a Poisson curve with rate = median count rate of data. |
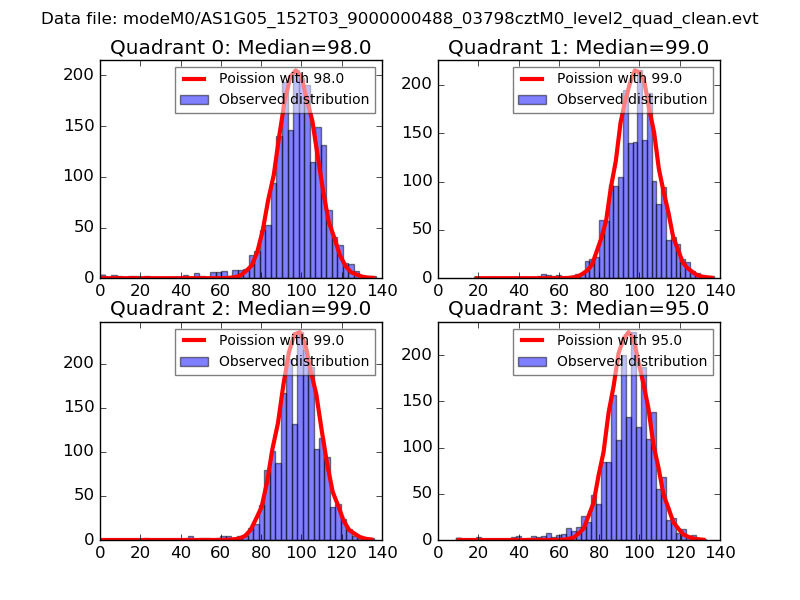 |
 |
| Quadrant-wise count rates Data is divided into 100 sec bins |
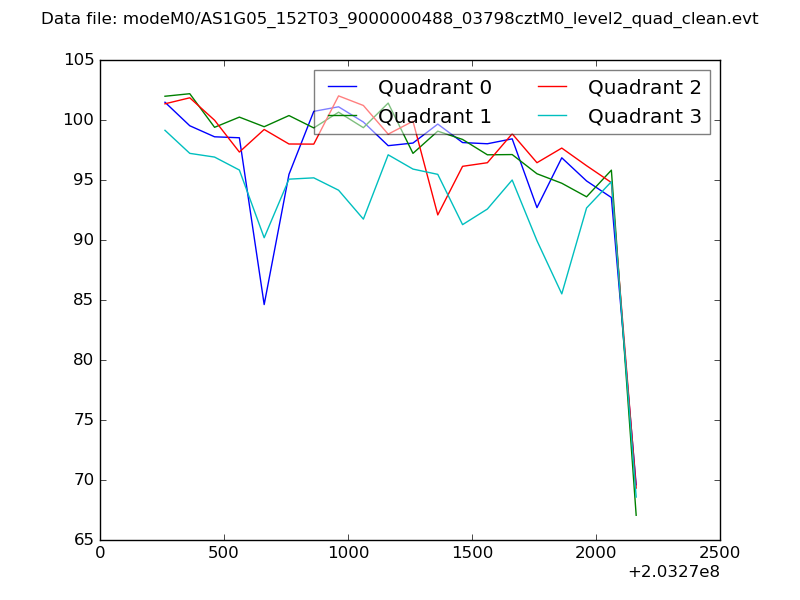 |
|
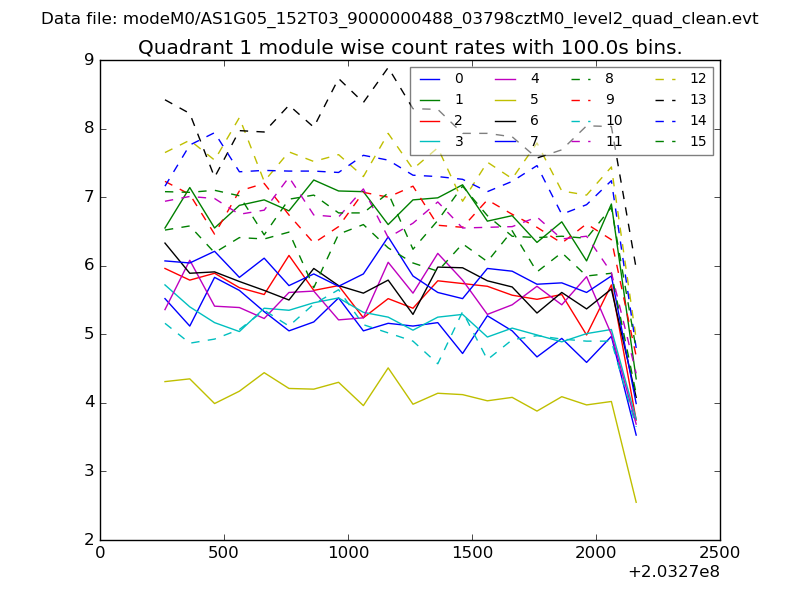
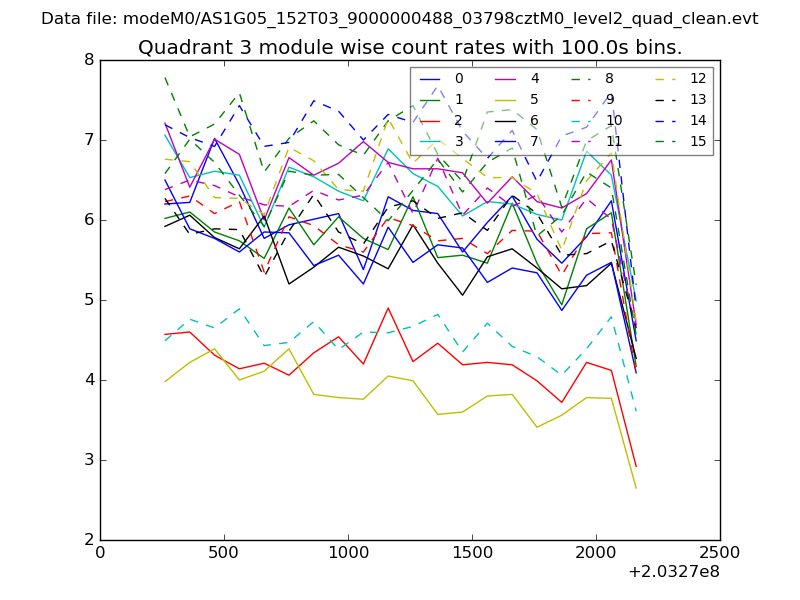
| Module-wise count rates for Quadrant A Data is divided into 100 sec bins |
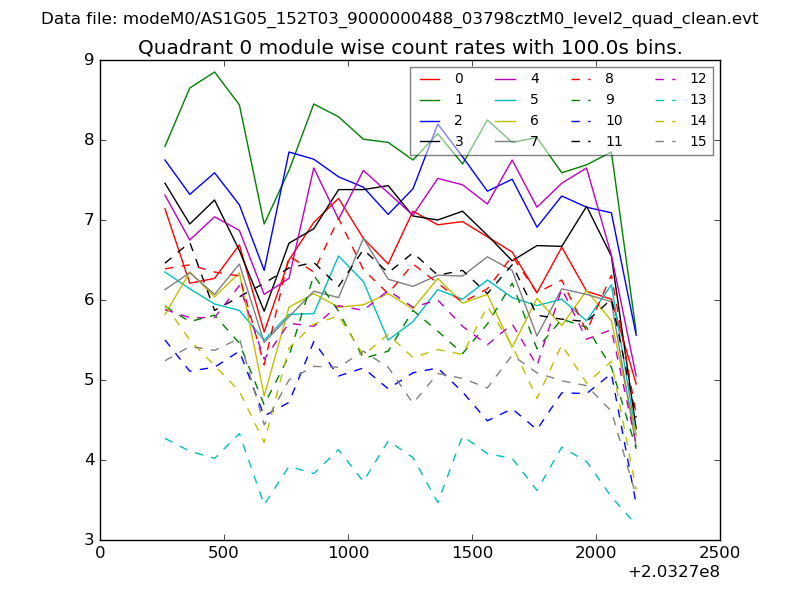 |
 |
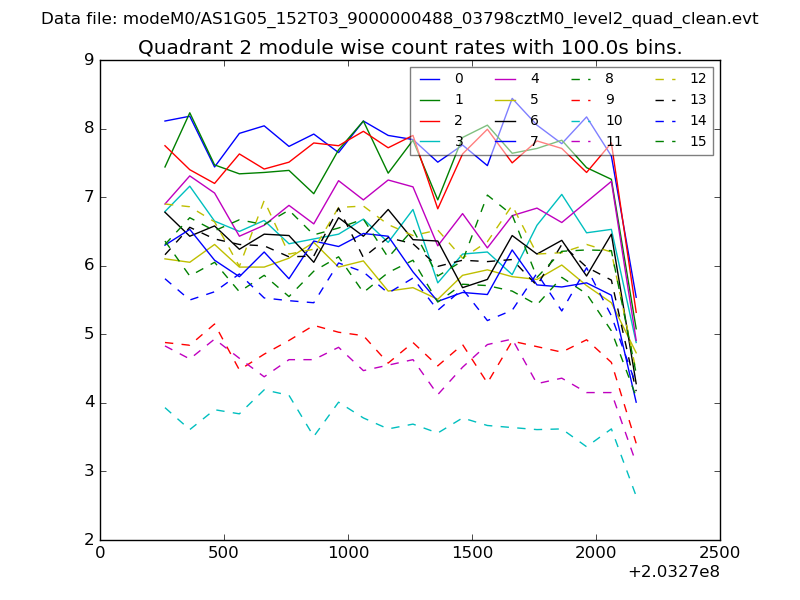
| Module-wise count rates for Quadrant B Data is divided into 100 sec bins |
 |
 |
| Module-wise count rates for Quadrant C Data is divided into 100 sec bins |
 |
 |
| Module-wise count rates for Quadrant D Data is divided into 100 sec bins |
 |
 |
| Parameter | Plot |
|---|---|
| CZT HV Monitor | 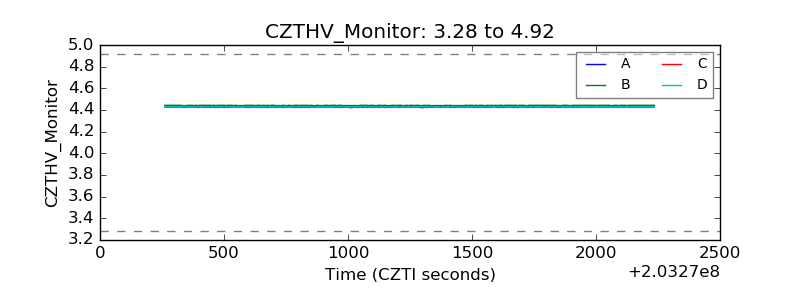 |
| D_VDD | 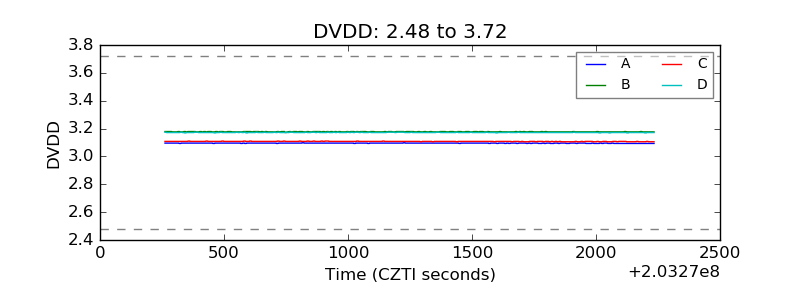 |
| Temperature 1 | 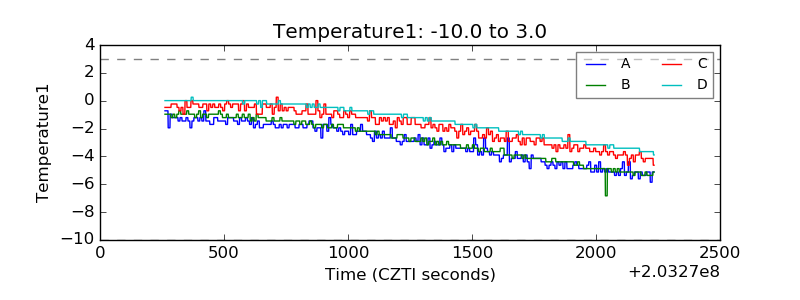 |
| Veto HV Monitor | 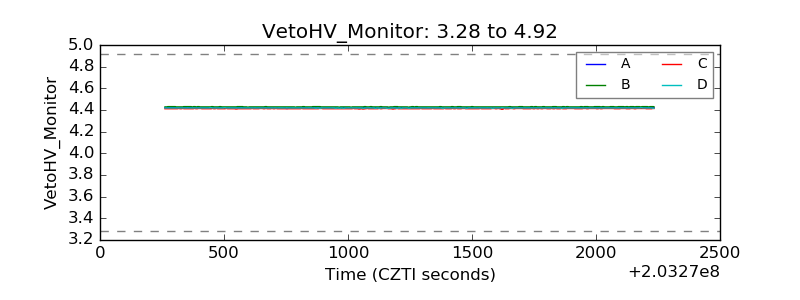 |
| Veto LLD | 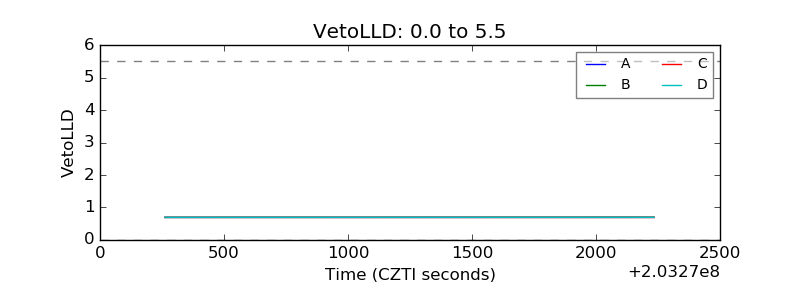 |
| Alpha Counter | 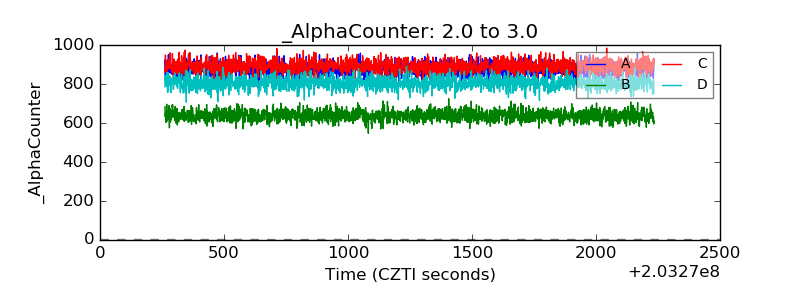 |
| _CPM_Rate | 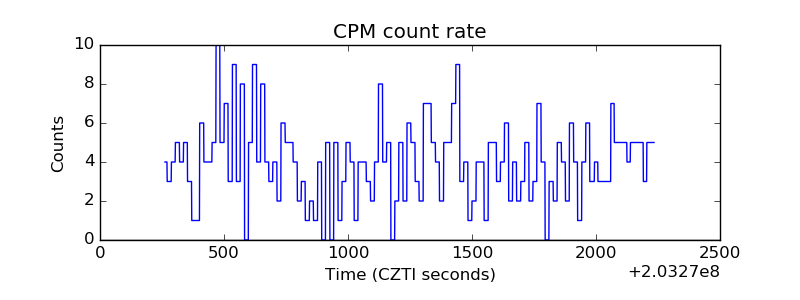 |
| CZT Counter | 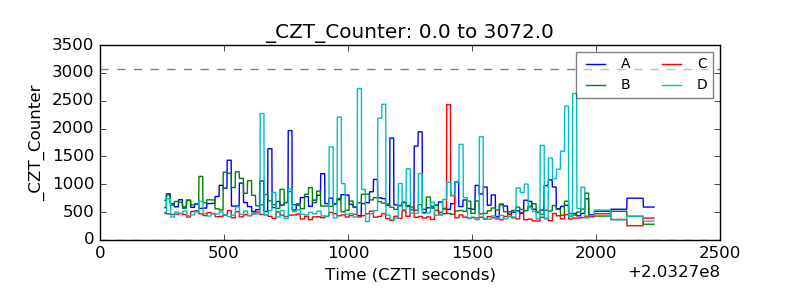 |
| +2.5 Volts monitor |  |
| +5 Volts monitor |  |
| Veto Counter | 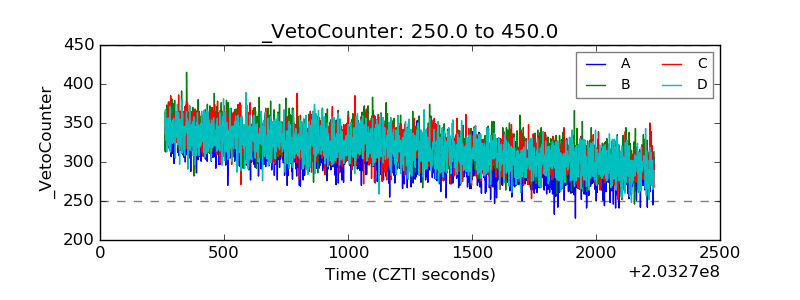 |