| Param | Original file | Final file |
|---|---|---|
| Filename | modeM0/AS1G05_194T01_9000000490cztM0_level2.fits | modeM0/AS1G05_194T01_9000000490cztM0_level2_quad_clean.evt |
| Size (bytes) | 417,882,240 | 406,823,040 |
| Size | 398.5 MB | 388.0 MB |
| Events in quadrant A | 2,521,082 | 2,419,678 |
| Events in quadrant B | 2,444,780 | 2,424,771 |
| Events in quadrant C | 2,450,360 | 2,269,589 |
| Events in quadrant D | 2,134,782 | 2,102,322 |
| Mode SS | |||
|---|---|---|---|
| Quadrant | BADHDUFLAG | Total packets | Discarded packets |
| A | 0 | 924 | 0 |
| B | 0 | 924 | 0 |
| C | 0 | 924 | 0 |
| D | 0 | 924 | 0 |
| Mode M9 | |||
|---|---|---|---|
| Quadrant | BADHDUFLAG | Total packets | Discarded packets |
| A | 0 | 79 | 0 |
| B | 0 | 79 | 0 |
| C | 0 | 79 | 0 |
| D | 0 | 80 | 0 |
| Mode M0 | |||
|---|---|---|---|
| Quadrant | BADHDUFLAG | Total packets | Discarded packets |
| A | 0 | 109273 | 0 |
| B | 0 | 99995 | 0 |
| C | 0 | 105183 | 0 |
| D | 0 | 101047 | 0 |
| Quadrant | Total seconds | Saturated seconds | Saturation percentage |
|---|---|---|---|
| A | 45209 | 953 | 2.107987% |
| B | 45208 | 553 | 1.223235% |
| C | 45209 | 758 | 1.676657% |
| D | 45209 | 898 | 1.986330% |
Noise dominated data is calculated using 1-second bins in cleaned event files. If a bin has >2000 counts, and if more than 50% of those come from <1% of pixels, then it is considered to be noise-dominated and hence unusable.
| Quadrant | # 1 sec bins | Bins with >0 counts | Bins with >2000 counts | High rate bins dominated by noise | Noise dominated (total time) | Noise dominated (detector-on time) | Marked lightcurve |
|---|---|---|---|---|---|---|---|
| A | 64149 | 45201 | 0 | 0 | 0.00% | 0.00% | 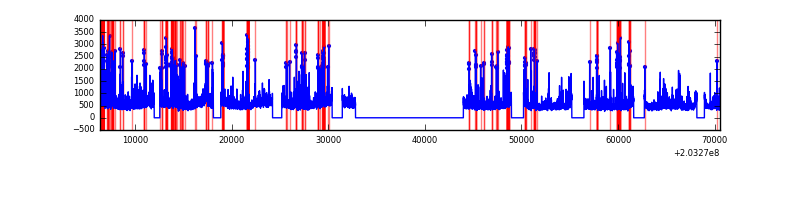 |
| B | 64149 | 45202 | 0 | 0 | 0.00% | 0.00% |  |
| C | 64149 | 45205 | 0 | 0 | 0.00% | 0.00% |  |
| D | 64149 | 45177 | 0 | 0 | 0.00% | 0.00% |  |
Top three noisy pixels from each quadrant. If the there are fewer than three noisy pixels in the level2.evt file, extra rows are filled as -1
| Pixel properties | Quadrant properties | ||||||
|---|---|---|---|---|---|---|---|
| Quadrant | DetID | PixID | Counts | Sigma | Mean | Median | Sigma |
| A | 14 | 188 | 2522 | 11.34 | 654 | 610 | 168.6 |
| A | 0 | 29 | 2417 | 10.72 | 654 | 610 | 168.6 |
| A | 7 | 110 | 2115 | 8.92 | 654 | 610 | 168.6 |
| B | 2 | 9 | 2146 | 11.39 | 646 | 612 | 134.7 |
| B | 12 | 226 | 1807 | 8.87 | 646 | 612 | 134.7 |
| B | 14 | 254 | 1690 | 8.0 | 646 | 612 | 134.7 |
| C | 1 | 80 | 1744 | 6.52 | 647 | 597 | 175.9 |
| C | 12 | 241 | 1722 | 6.4 | 647 | 597 | 175.9 |
| C | 1 | 81 | 1719 | 6.38 | 647 | 597 | 175.9 |
| D | 11 | 82 | 1935 | 8.35 | 610 | 553 | 165.6 |
| D | 7 | 5 | 1583 | 6.22 | 610 | 553 | 165.6 |
| D | 6 | 231 | 1494 | 5.68 | 610 | 553 | 165.6 |
Histogram calculated using DETX and DETY for each event in the final _common_clean file
| Quadrant A | 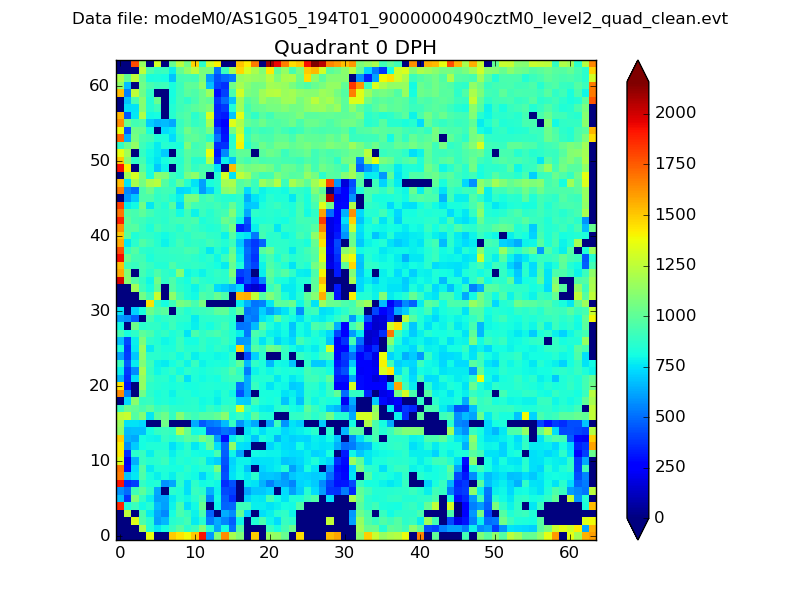 |
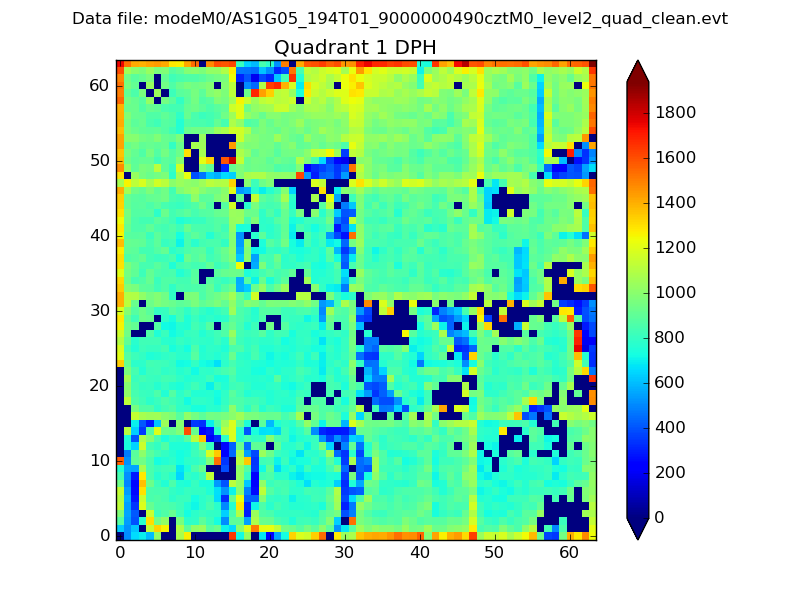 |
Quadrant B |
|---|---|---|---|
| Quadrant D |  |
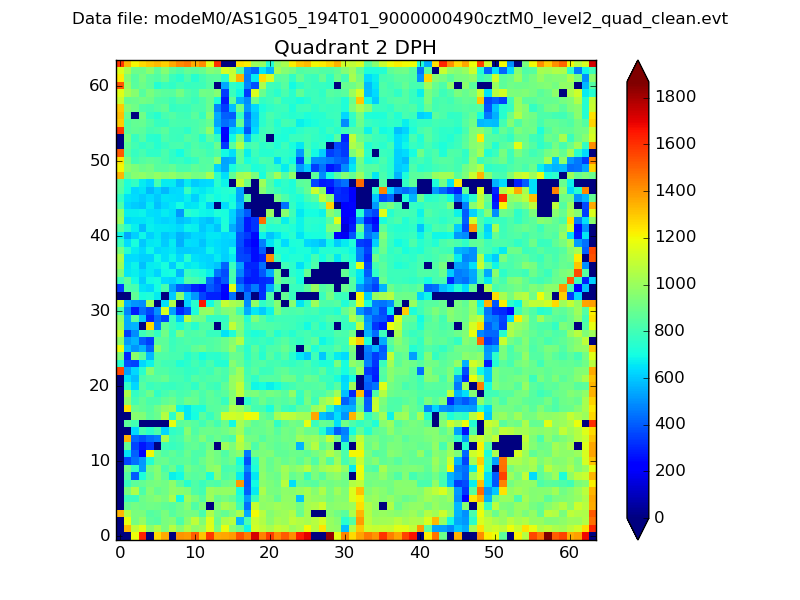 |
Quadrant C |
| Plot type | Count rate plots | Images |
|---|---|---|
| Comparison with Poisson distribution Blue bars denote a histogram of data divided into 1 sec bins. Red curve is a Poisson curve with rate = median count rate of data. |
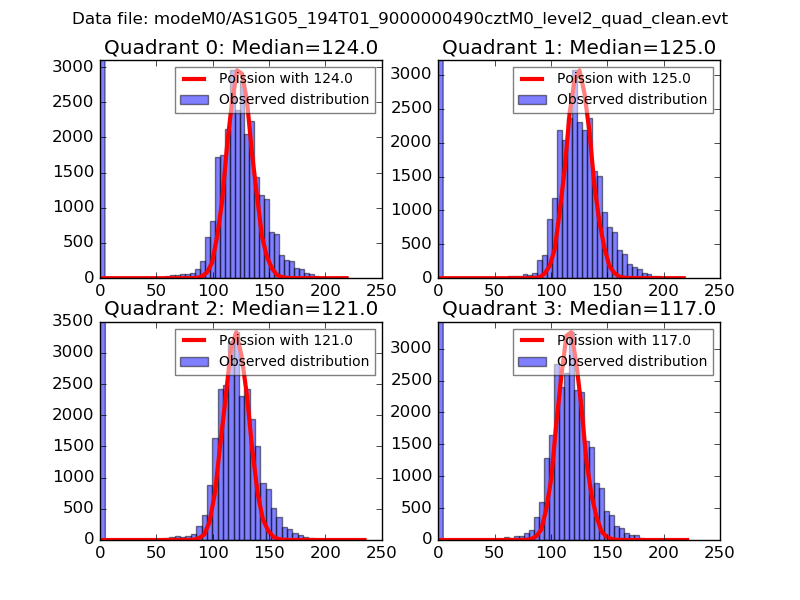 |
 |
| Quadrant-wise count rates Data is divided into 100 sec bins |
 |
|
| Module-wise count rates for Quadrant A Data is divided into 100 sec bins |
 |
 |
| Module-wise count rates for Quadrant B Data is divided into 100 sec bins |
 |
 |
| Module-wise count rates for Quadrant C Data is divided into 100 sec bins |
 |
 |
| Module-wise count rates for Quadrant D Data is divided into 100 sec bins |
 |
 |
| Parameter | Plot |
|---|---|
| CZT HV Monitor |  |
| D_VDD |  |
| Temperature 1 |  |
| Veto HV Monitor |  |
| Veto LLD |  |
| Alpha Counter |  |
| _CPM_Rate |  |
| CZT Counter | 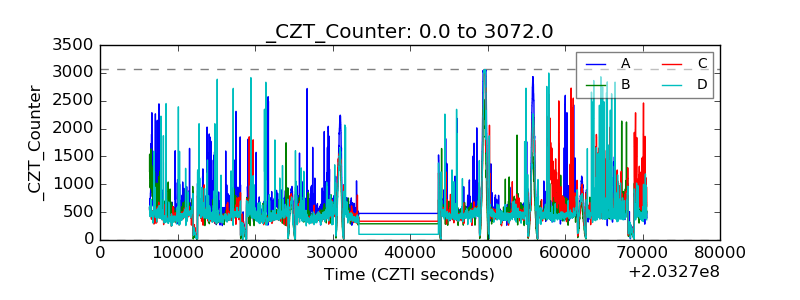 |
| +2.5 Volts monitor |  |
| +5 Volts monitor |  |
| _ROLL_ROT |  |
| _Roll_DEC |  |
| _Roll_RA |  |
| Veto Counter | 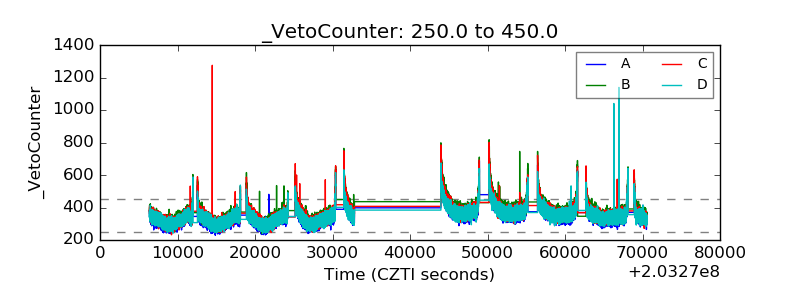 |