| Param | Original file | Final file |
|---|---|---|
| Filename | modeM0/AS1G05_194T01_9000000490_03800cztM0_level2.evt | modeM0/AS1G05_194T01_9000000490_03800cztM0_level2_quad_clean.evt |
| Size (bytes) | 929,960,640 | 144,388,800 |
| Size | 886.9 MB | 137.7 MB |
| Events in quadrant A | 8,425,474 | 889,356 |
| Events in quadrant B | 6,970,431 | 886,768 |
| Events in quadrant C | 5,755,699 | 872,261 |
| Events in quadrant D | 6,153,707 | 846,961 |
| Mode SS | |||
|---|---|---|---|
| Quadrant | BADHDUFLAG | Total packets | Discarded packets |
| A | 0 | 260 | 0 |
| B | 0 | 260 | 0 |
| C | 0 | 260 | 0 |
| D | 0 | 260 | 0 |
| Mode M9 | |||
|---|---|---|---|
| Quadrant | BADHDUFLAG | Total packets | Discarded packets |
| A | 0 | 13 | 0 |
| B | 0 | 13 | 0 |
| C | 0 | 13 | 0 |
| D | 0 | 13 | 0 |
| Mode M0 | |||
|---|---|---|---|
| Quadrant | BADHDUFLAG | Total packets | Discarded packets |
| A | 0 | 33410 | 3 |
| B | 0 | 29260 | 5 |
| C | 0 | 26061 | 2 |
| D | 0 | 27616 | 2 |
| Quadrant | Total seconds | Saturated seconds | Saturation percentage |
|---|---|---|---|
| A | 12689 | 299 | 2.356372% |
| B | 12688 | 120 | 0.945776% |
| C | 12689 | 78 | 0.614706% |
| D | 12689 | 150 | 1.182126% |
Noise dominated data is calculated using 1-second bins in cleaned event files. If a bin has >2000 counts, and if more than 50% of those come from <1% of pixels, then it is considered to be noise-dominated and hence unusable.
| Quadrant | # 1 sec bins | Bins with >0 counts | Bins with >2000 counts | High rate bins dominated by noise | Noise dominated (total time) | Noise dominated (detector-on time) | Marked lightcurve |
|---|---|---|---|---|---|---|---|
| A | 14039 | 12690 | 181 | 181 | 1.29% | 1.43% |  |
| B | 14039 | 12690 | 8 | 8 | 0.06% | 0.06% | 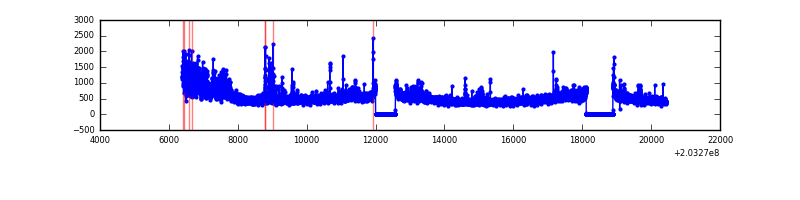 |
| C | 14039 | 12690 | 16 | 16 | 0.11% | 0.13% | 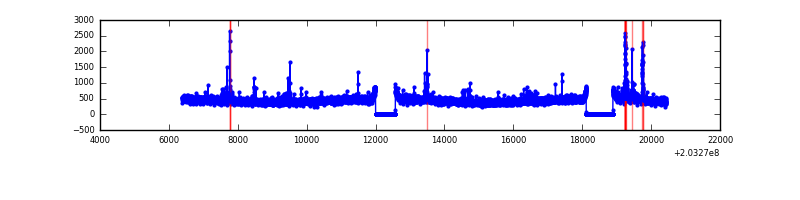 |
| D | 14039 | 12690 | 107 | 107 | 0.76% | 0.84% | 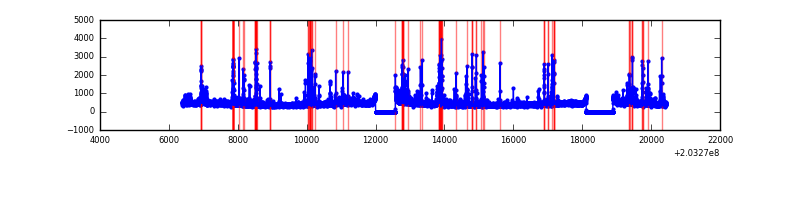 |
Top three noisy pixels from each quadrant. If the there are fewer than three noisy pixels in the level2.evt file, extra rows are filled as -1
| Pixel properties | Quadrant properties | ||||||
|---|---|---|---|---|---|---|---|
| Quadrant | DetID | PixID | Counts | Sigma | Mean | Median | Sigma |
| A | 13 | 251 | 2272361 | 7646.76 | 1453 | 1423 | 297.0 |
| A | 0 | 118 | 262637 | 879.57 | 1453 | 1423 | 297.0 |
| A | 0 | 50 | 218077 | 729.52 | 1453 | 1423 | 297.0 |
| B | 15 | 204 | 956291 | 3349.81 | 1481 | 1443 | 285.0 |
| B | 14 | 167 | 159331 | 553.91 | 1481 | 1443 | 285.0 |
| B | 4 | 81 | 53051 | 181.05 | 1481 | 1443 | 285.0 |
| C | 9 | 247 | 87803 | 258.52 | 1420 | 1425 | 334.1 |
| C | 10 | 65 | 49439 | 143.7 | 1420 | 1425 | 334.1 |
| C | 12 | 4 | 27102 | 76.85 | 1420 | 1425 | 334.1 |
| D | 13 | 239 | 277902 | 807.13 | 1411 | 1367 | 342.6 |
| D | 13 | 223 | 150012 | 433.85 | 1411 | 1367 | 342.6 |
| D | 14 | 34 | 89375 | 256.87 | 1411 | 1367 | 342.6 |
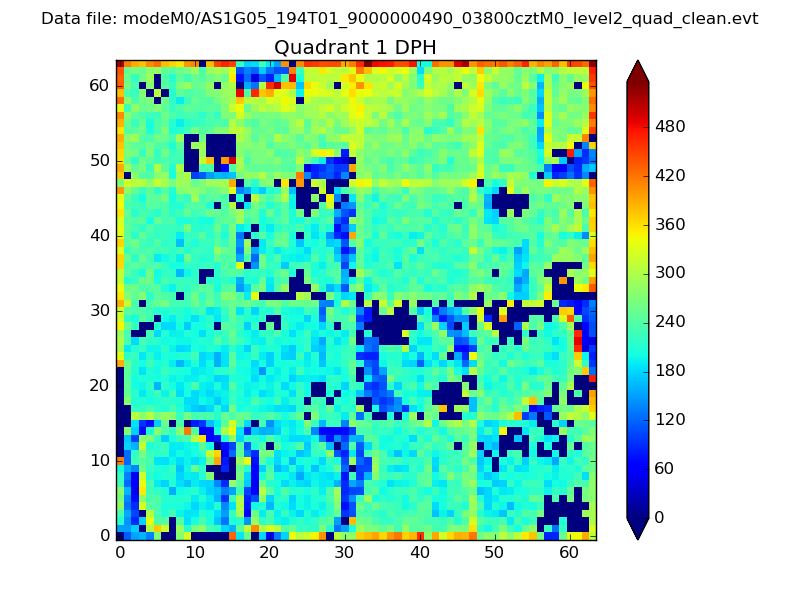
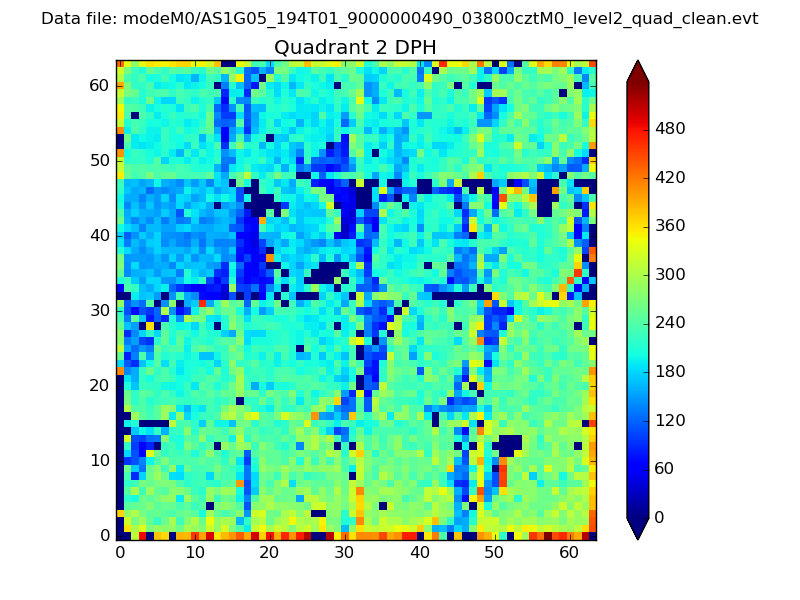
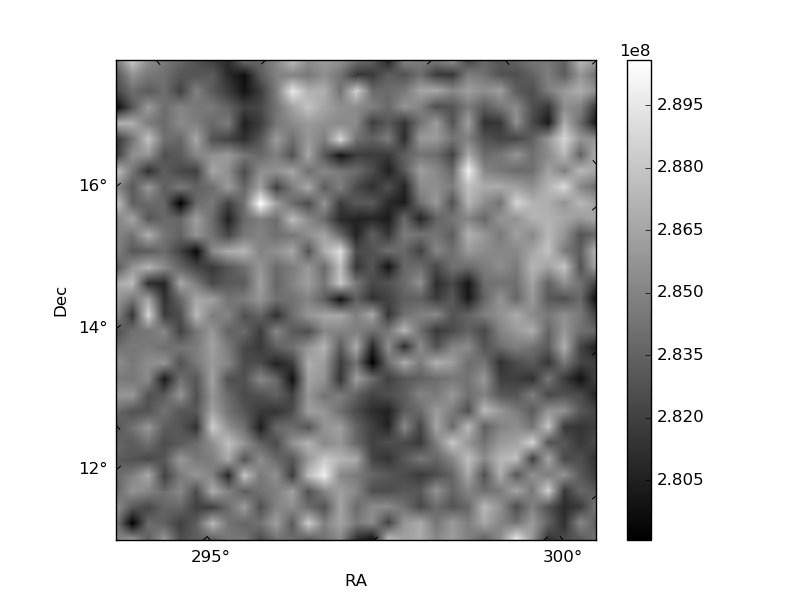
Histogram calculated using DETX and DETY for each event in the final _common_clean file
| Quadrant A | 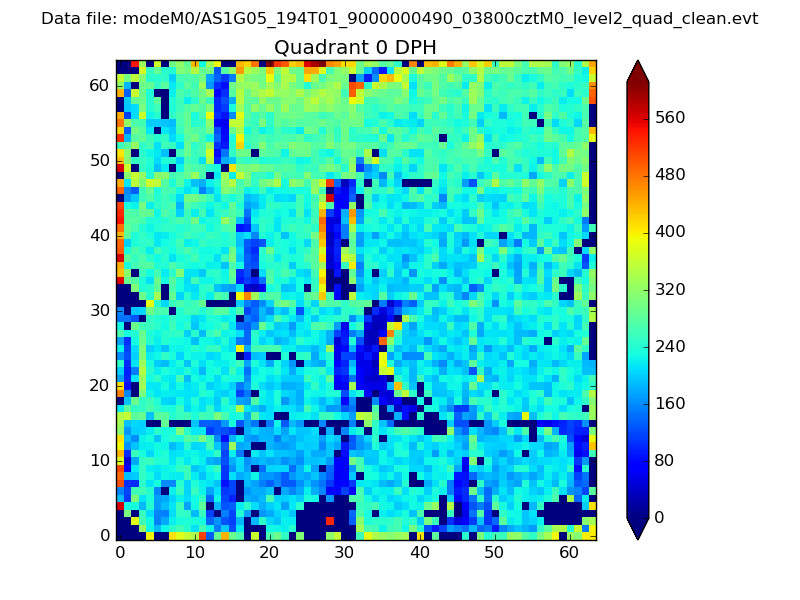 |
 |
Quadrant B |
|---|---|---|---|
| Quadrant D | 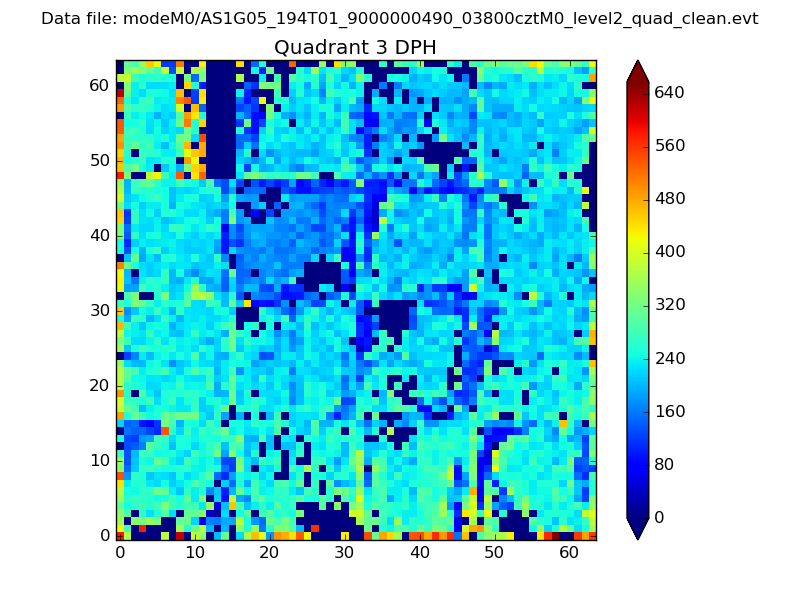 |
 |
Quadrant C |
| Plot type | Count rate plots | Images |
|---|---|---|
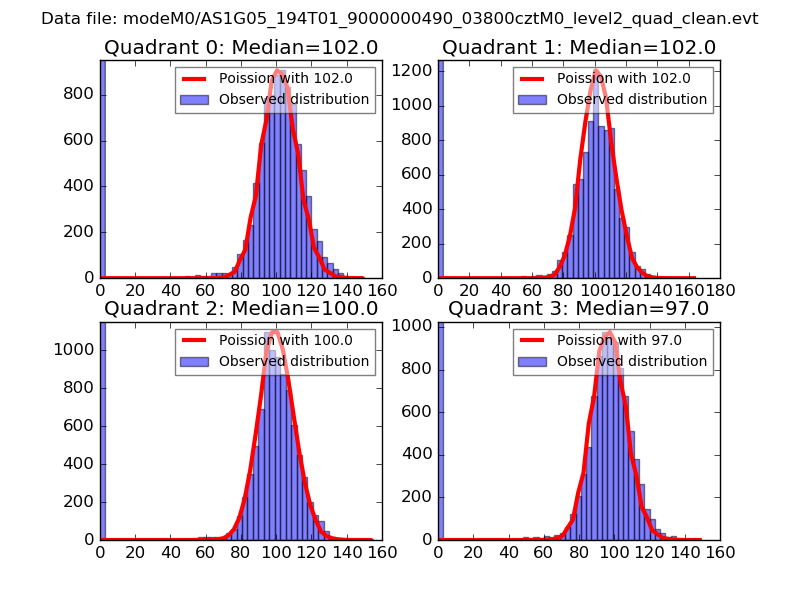
| Comparison with Poisson distribution Blue bars denote a histogram of data divided into 1 sec bins. Red curve is a Poisson curve with rate = median count rate of data. |
 |
 |
| Quadrant-wise count rates Data is divided into 100 sec bins |
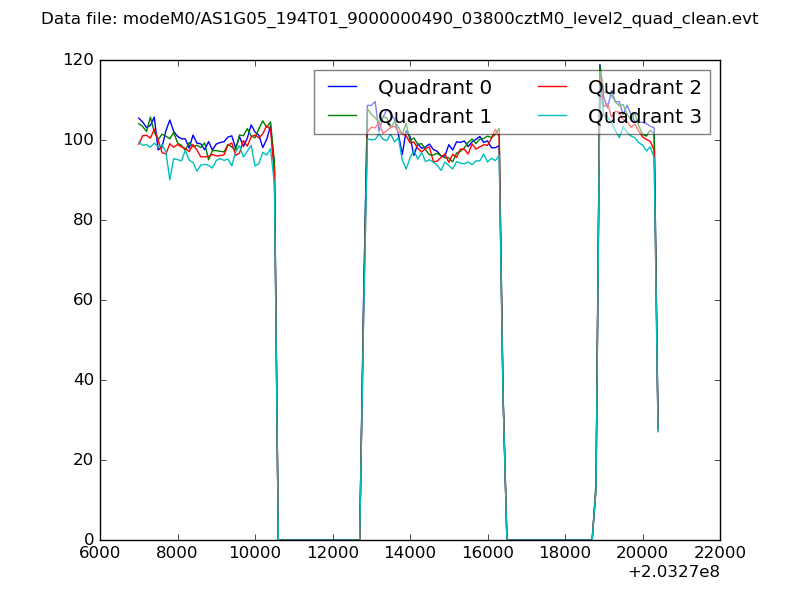 |
|
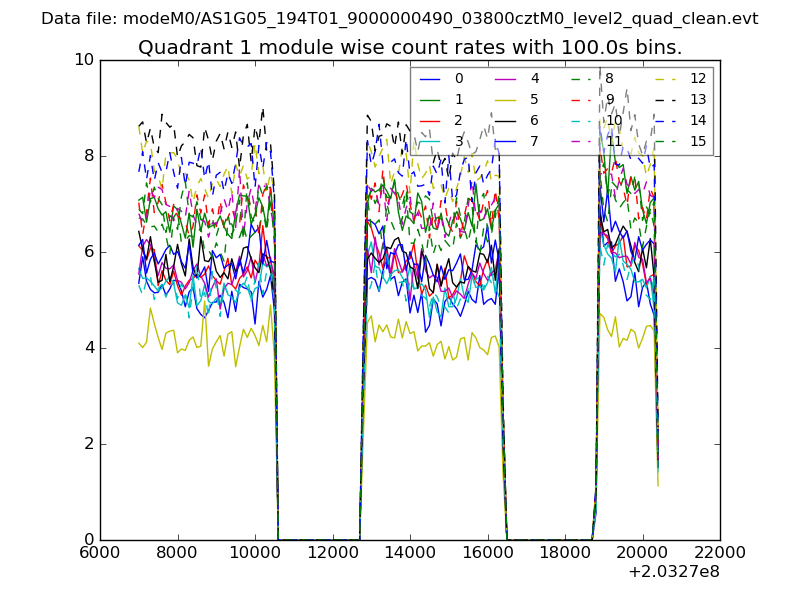
| Module-wise count rates for Quadrant A Data is divided into 100 sec bins |
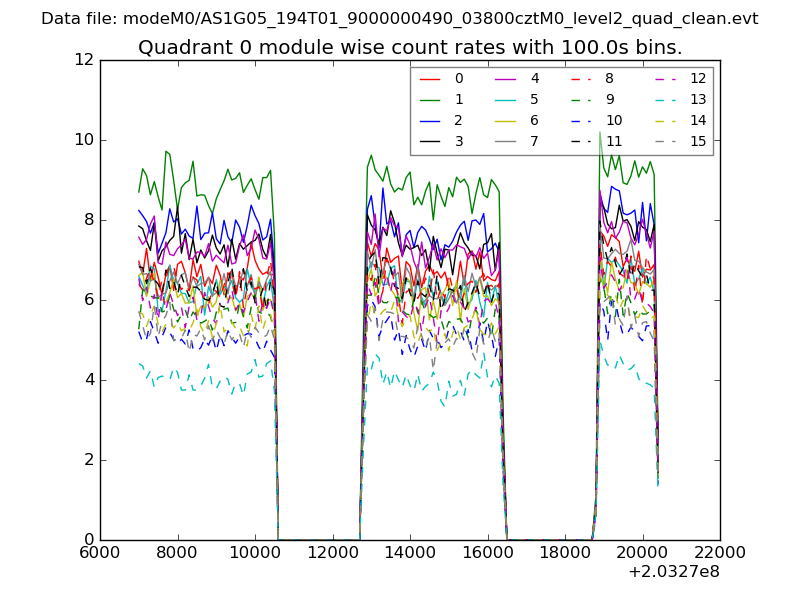 |
 |
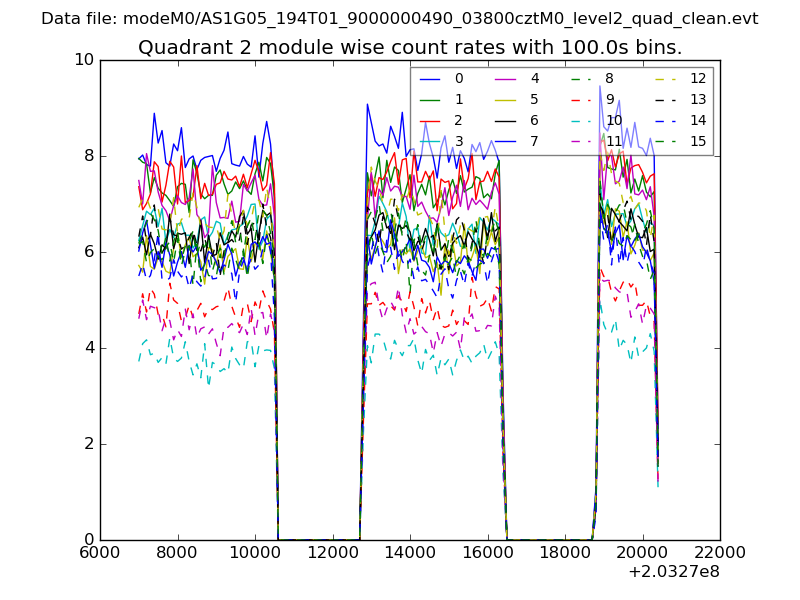
| Module-wise count rates for Quadrant B Data is divided into 100 sec bins |
 |
 |
| Module-wise count rates for Quadrant C Data is divided into 100 sec bins |
 |
 |
| Module-wise count rates for Quadrant D Data is divided into 100 sec bins |
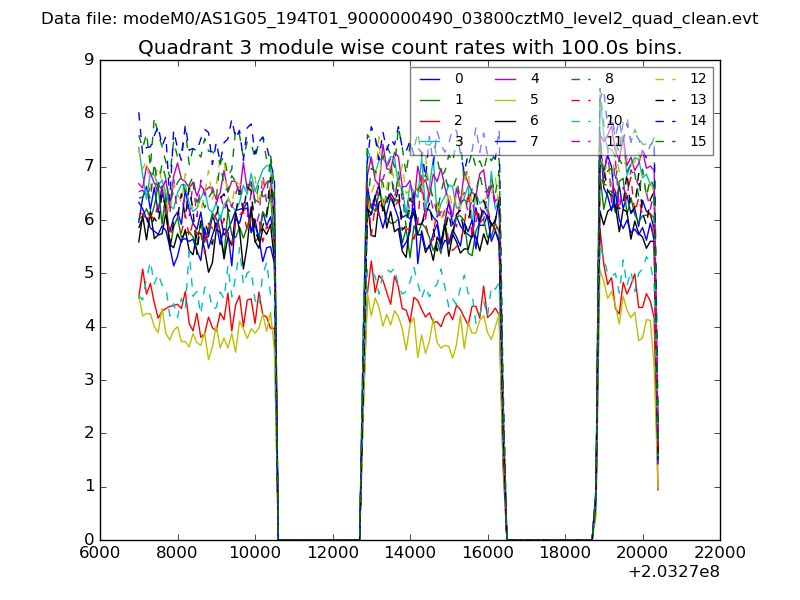 |
 |
| Parameter | Plot |
|---|---|
| CZT HV Monitor | 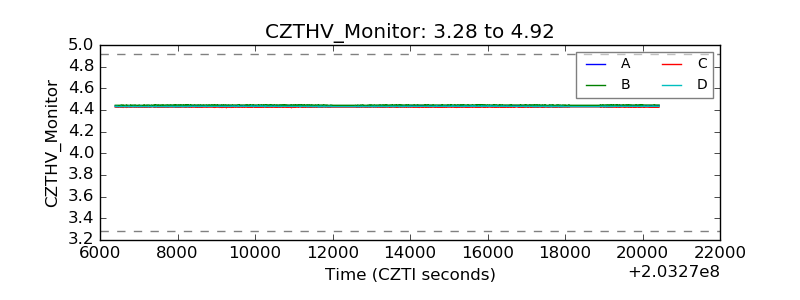 |
| D_VDD | 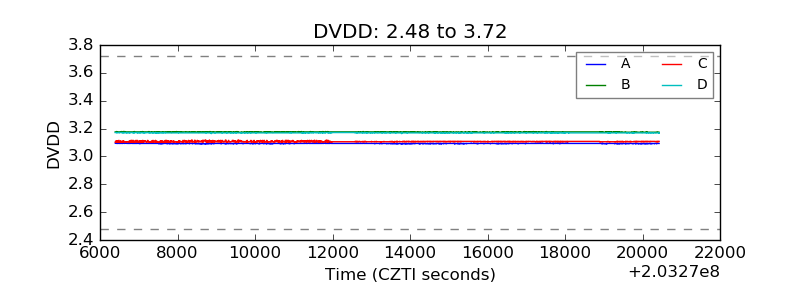 |
| Temperature 1 | 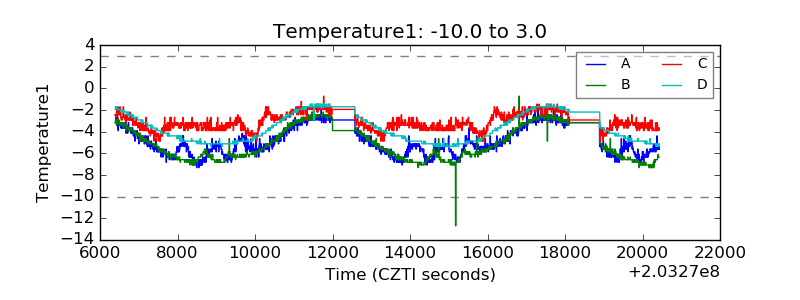 |
| Veto HV Monitor | 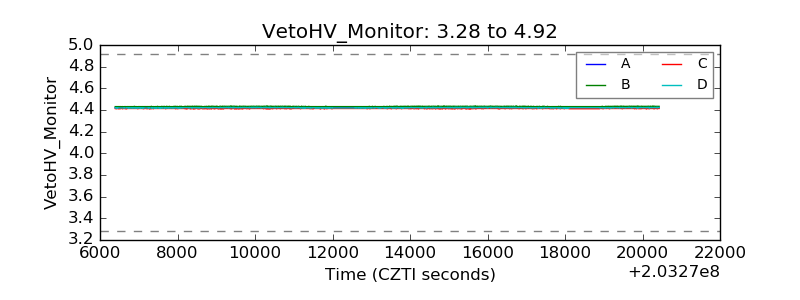 |
| Veto LLD | 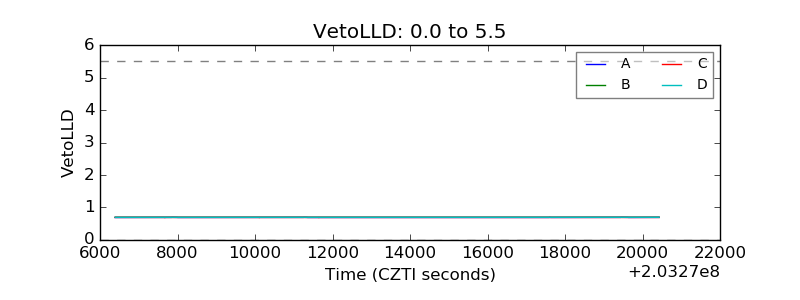 |
| Alpha Counter | 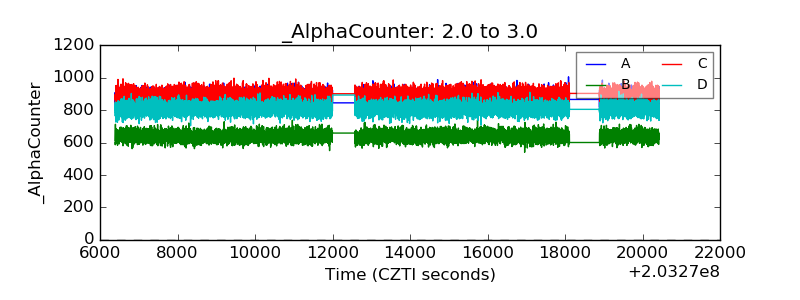 |
| _CPM_Rate | 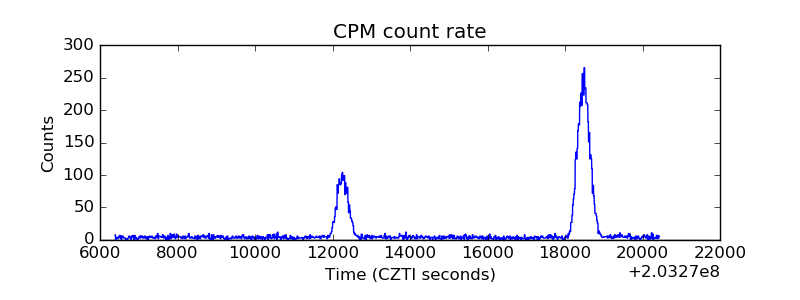 |
| CZT Counter | 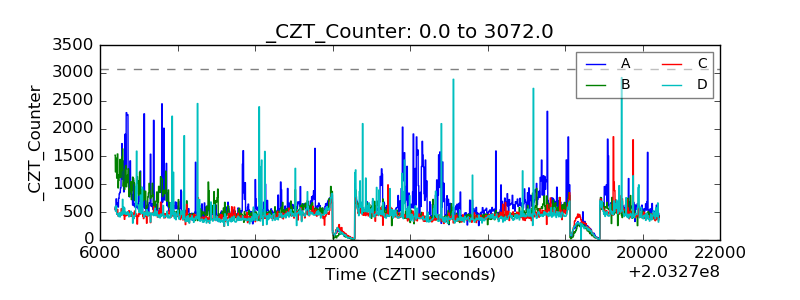 |
| +2.5 Volts monitor |  |
| +5 Volts monitor |  |
| Veto Counter | 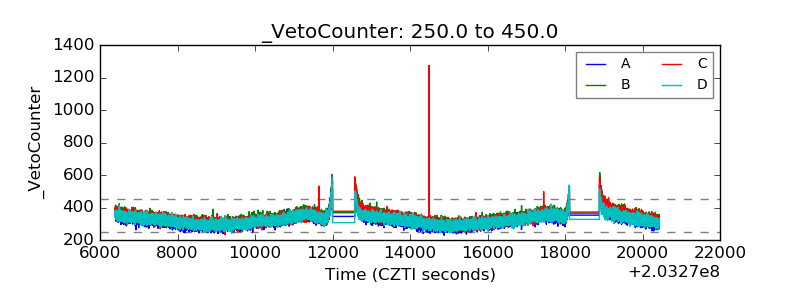 |