| Param | Original file | Final file |
|---|---|---|
| Filename | modeM0/AS1G05_194T01_9000000490_03802cztM0_level2.evt | modeM0/AS1G05_194T01_9000000490_03802cztM0_level2_quad_clean.evt |
| Size (bytes) | 485,812,800 | 77,060,160 |
| Size | 463.3 MB | 73.5 MB |
| Events in quadrant A | 4,428,152 | 471,174 |
| Events in quadrant B | 3,422,473 | 471,445 |
| Events in quadrant C | 3,098,836 | 463,115 |
| Events in quadrant D | 3,294,886 | 447,004 |
| Mode SS | |||
|---|---|---|---|
| Quadrant | BADHDUFLAG | Total packets | Discarded packets |
| A | 0 | 144 | 0 |
| B | 0 | 144 | 0 |
| C | 0 | 144 | 0 |
| D | 0 | 144 | 0 |
| Mode M9 | |||
|---|---|---|---|
| Quadrant | BADHDUFLAG | Total packets | Discarded packets |
| A | 0 | 19 | 0 |
| B | 0 | 19 | 0 |
| C | 0 | 19 | 0 |
| D | 0 | 19 | 0 |
| Mode M0 | |||
|---|---|---|---|
| Quadrant | BADHDUFLAG | Total packets | Discarded packets |
| A | 0 | 17809 | 3 |
| B | 0 | 14828 | 2 |
| C | 0 | 14100 | 2 |
| D | 0 | 14938 | 2 |
| Quadrant | Total seconds | Saturated seconds | Saturation percentage |
|---|---|---|---|
| A | 6893 | 133 | 1.929494% |
| B | 6893 | 38 | 0.551284% |
| C | 6893 | 18 | 0.261134% |
| D | 6893 | 55 | 0.797911% |
Noise dominated data is calculated using 1-second bins in cleaned event files. If a bin has >2000 counts, and if more than 50% of those come from <1% of pixels, then it is considered to be noise-dominated and hence unusable.
| Quadrant | # 1 sec bins | Bins with >0 counts | Bins with >2000 counts | High rate bins dominated by noise | Noise dominated (total time) | Noise dominated (detector-on time) | Marked lightcurve |
|---|---|---|---|---|---|---|---|
| A | 8908 | 6895 | 53 | 53 | 0.59% | 0.77% |  |
| B | 8908 | 6894 | 2 | 2 | 0.02% | 0.03% |  |
| C | 8908 | 6895 | 0 | 0 | 0.00% | 0.00% | 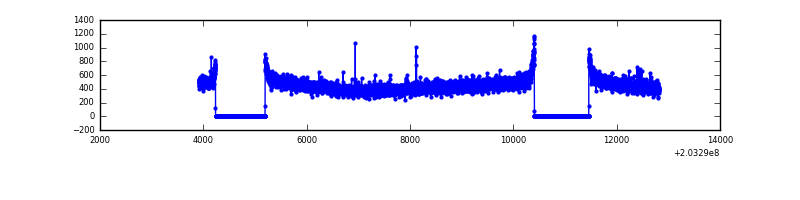 |
| D | 8908 | 6895 | 31 | 31 | 0.35% | 0.45% |  |
Top three noisy pixels from each quadrant. If the there are fewer than three noisy pixels in the level2.evt file, extra rows are filled as -1
| Pixel properties | Quadrant properties | ||||||
|---|---|---|---|---|---|---|---|
| Quadrant | DetID | PixID | Counts | Sigma | Mean | Median | Sigma |
| A | 13 | 251 | 1018218 | 6163.73 | 808 | 793 | 165.1 |
| A | 0 | 118 | 189893 | 1145.6 | 808 | 793 | 165.1 |
| A | 0 | 50 | 64464 | 385.73 | 808 | 793 | 165.1 |
| B | 15 | 204 | 125557 | 782.05 | 822 | 802 | 159.5 |
| B | 14 | 167 | 38099 | 233.8 | 822 | 802 | 159.5 |
| B | 5 | 200 | 29845 | 182.06 | 822 | 802 | 159.5 |
| C | 10 | 65 | 9120 | 44.95 | 787 | 794 | 185.2 |
| C | 2 | 53 | 6985 | 33.42 | 787 | 794 | 185.2 |
| C | 13 | 61 | 6598 | 31.33 | 787 | 794 | 185.2 |
| D | 8 | 112 | 182124 | 959.65 | 777 | 755 | 189.0 |
| D | 13 | 239 | 75006 | 392.87 | 777 | 755 | 189.0 |
| D | 2 | 14 | 43592 | 226.66 | 777 | 755 | 189.0 |
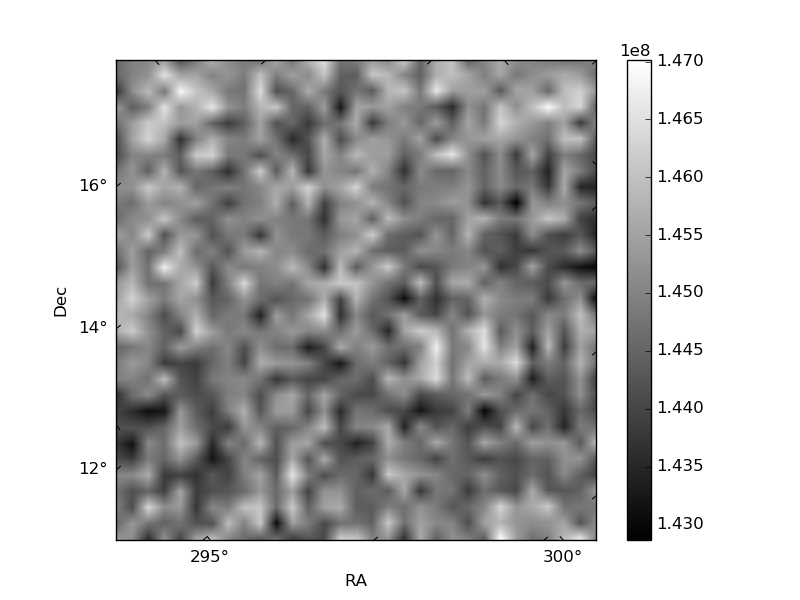
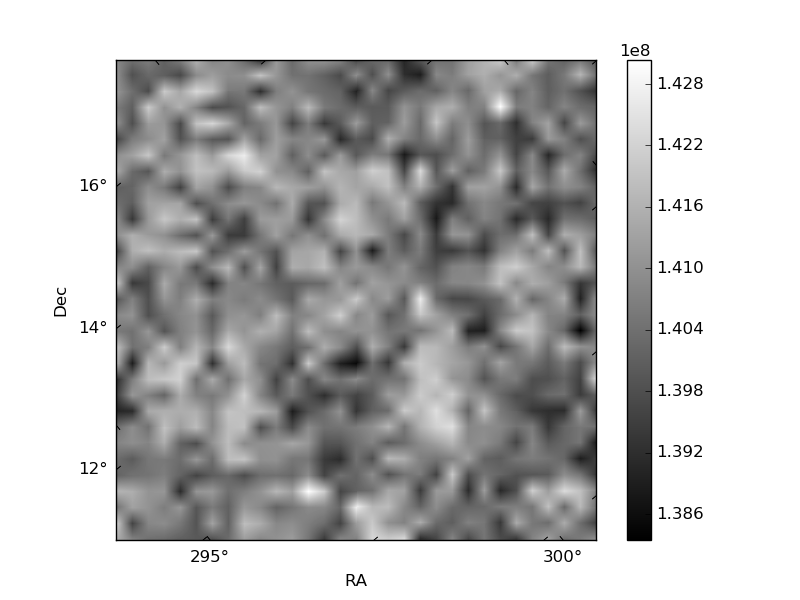
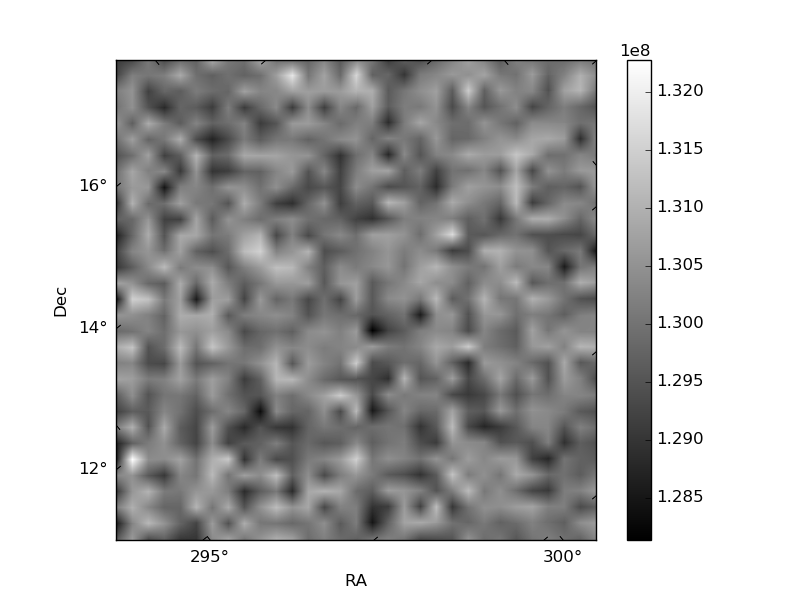
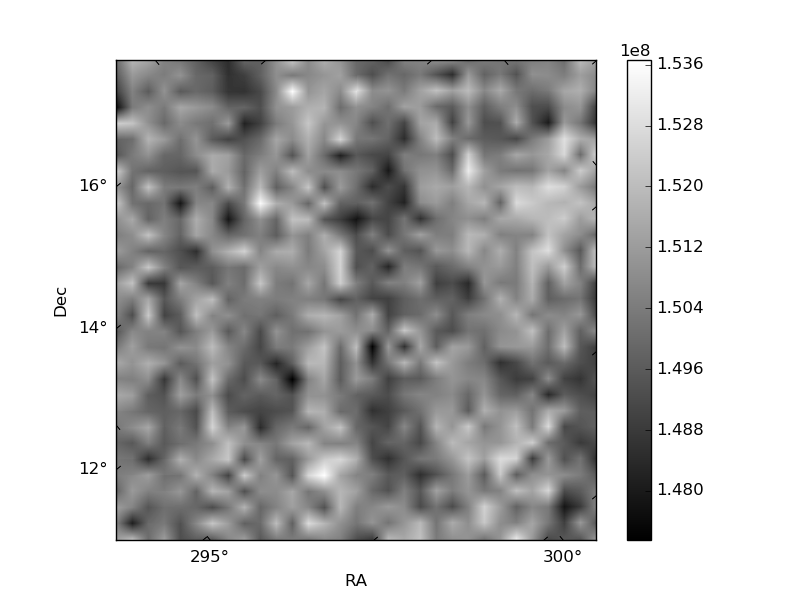
Histogram calculated using DETX and DETY for each event in the final _common_clean file
| Quadrant A | 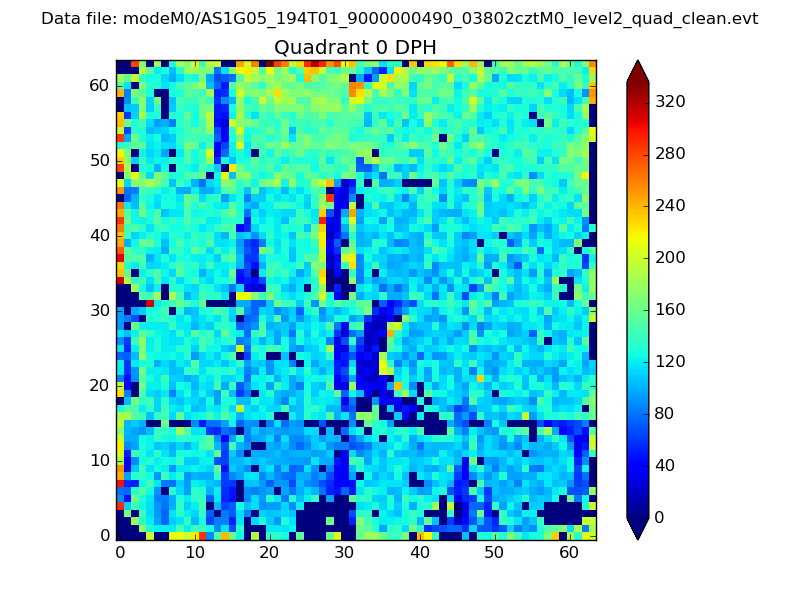 |
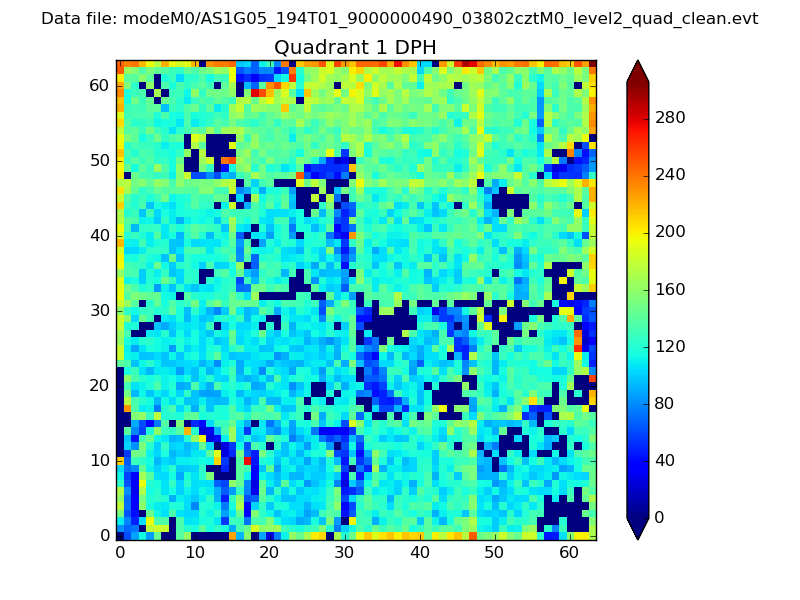 |
Quadrant B |
|---|---|---|---|
| Quadrant D | 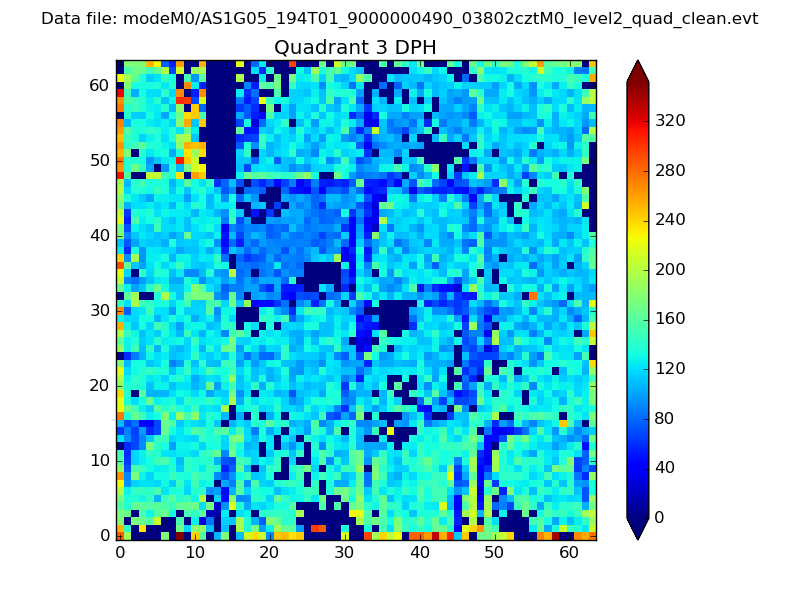 |
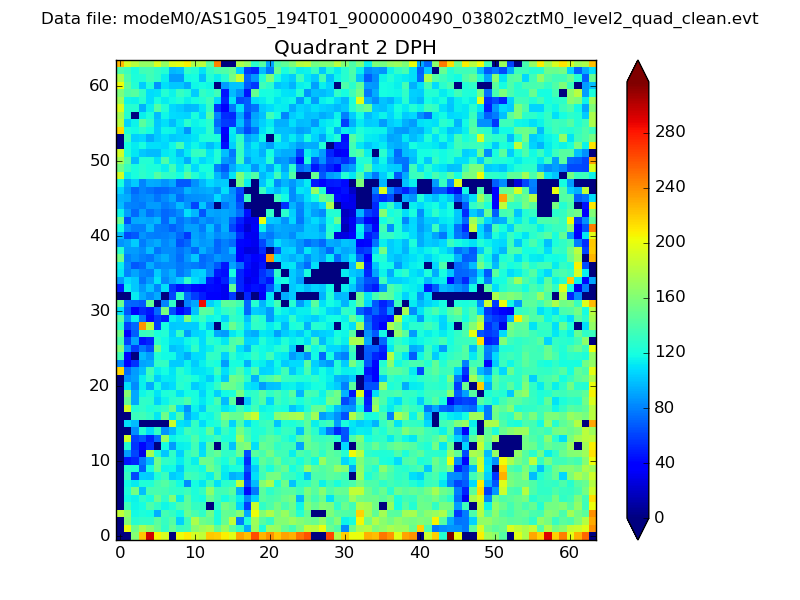 |
Quadrant C |
| Plot type | Count rate plots | Images |
|---|---|---|
| Comparison with Poisson distribution Blue bars denote a histogram of data divided into 1 sec bins. Red curve is a Poisson curve with rate = median count rate of data. |
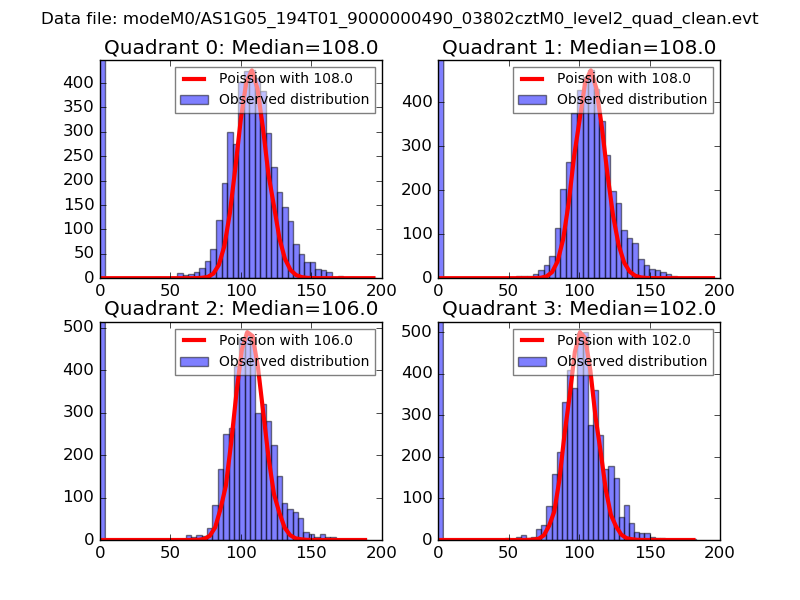 |
 |
| Quadrant-wise count rates Data is divided into 100 sec bins |
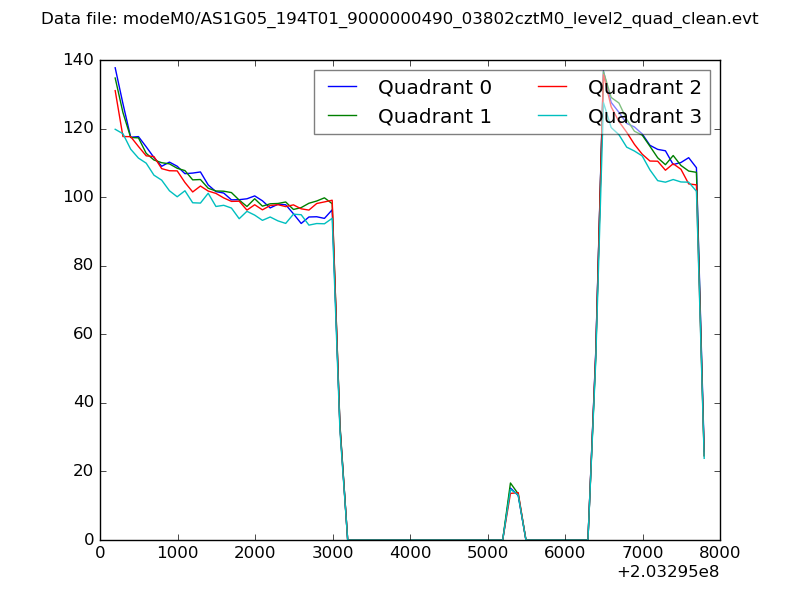 |
|
| Module-wise count rates for Quadrant A Data is divided into 100 sec bins |
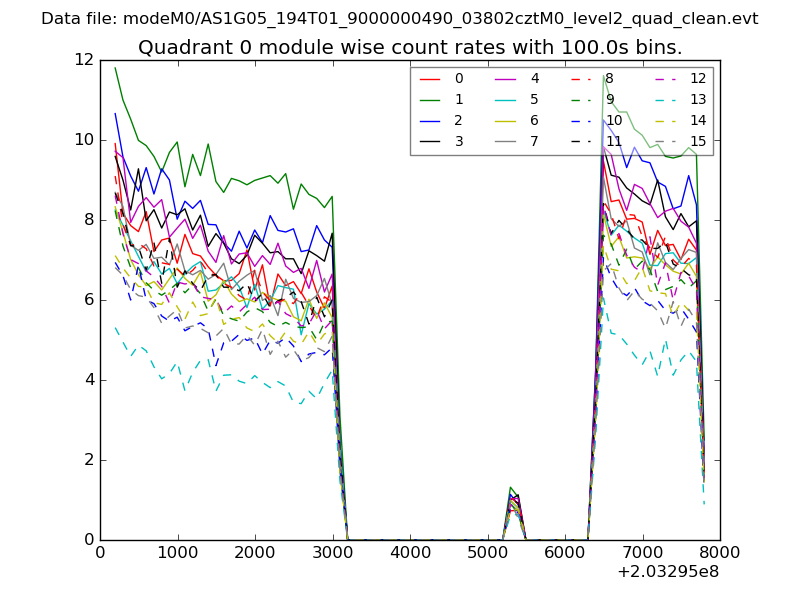 |
 |
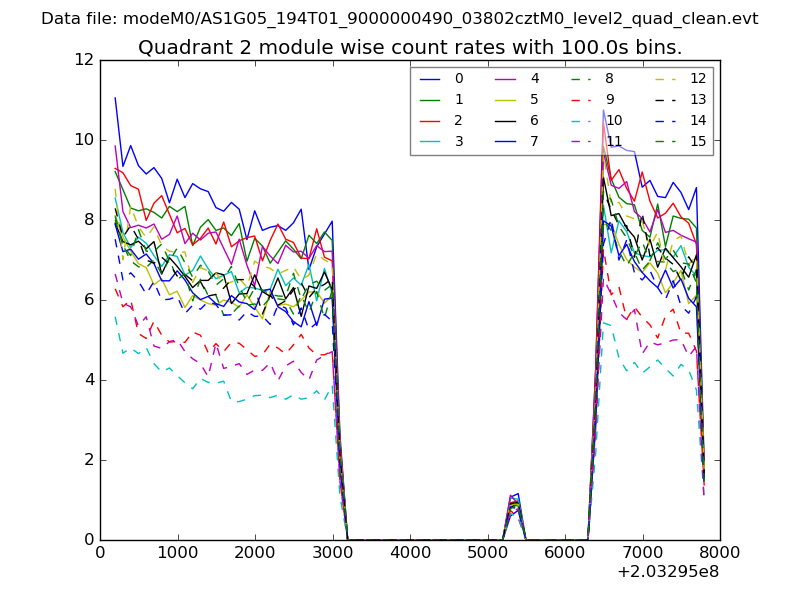
| Module-wise count rates for Quadrant B Data is divided into 100 sec bins |
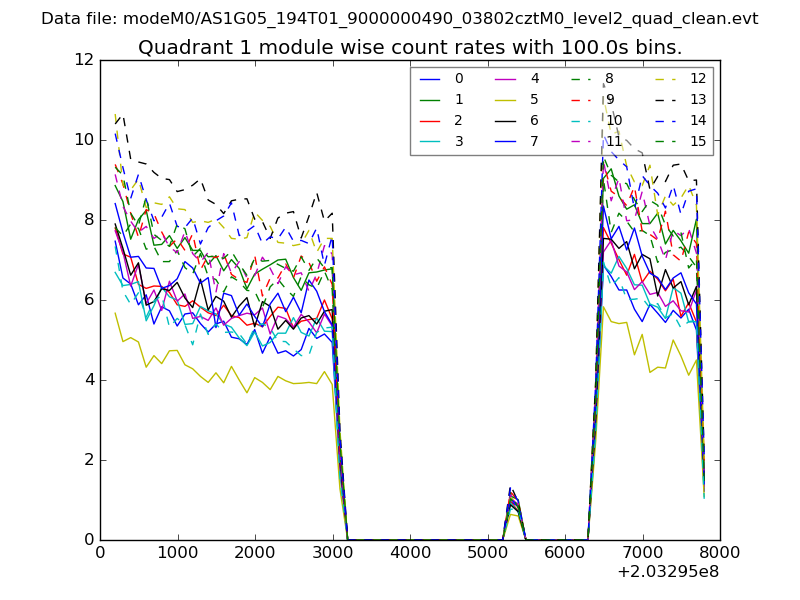 |
 |
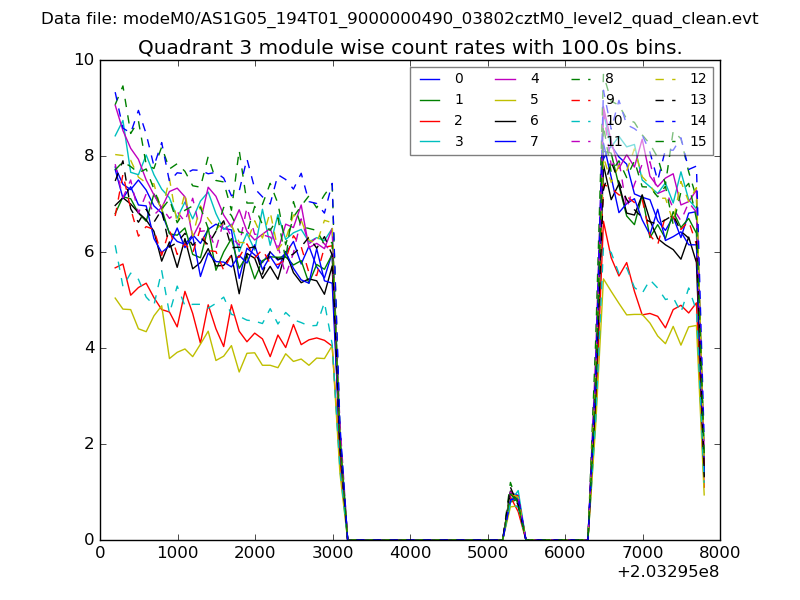
| Module-wise count rates for Quadrant C Data is divided into 100 sec bins |
 |
 |
| Module-wise count rates for Quadrant D Data is divided into 100 sec bins |
 |
 |
| Parameter | Plot |
|---|---|
| CZT HV Monitor | 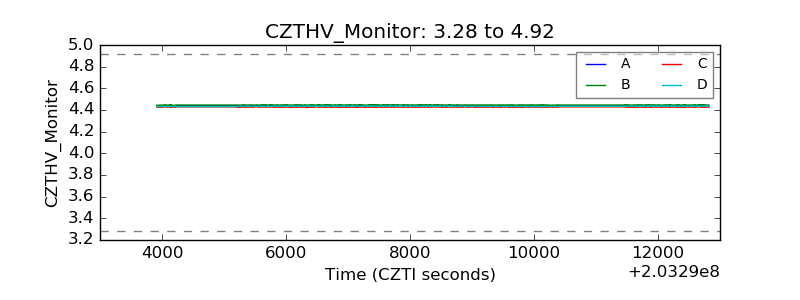 |
| D_VDD | 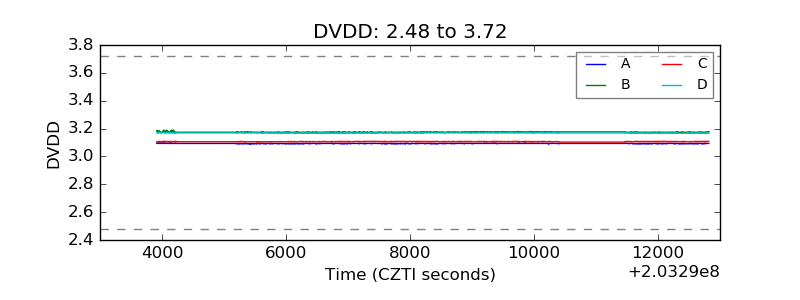 |
| Temperature 1 | 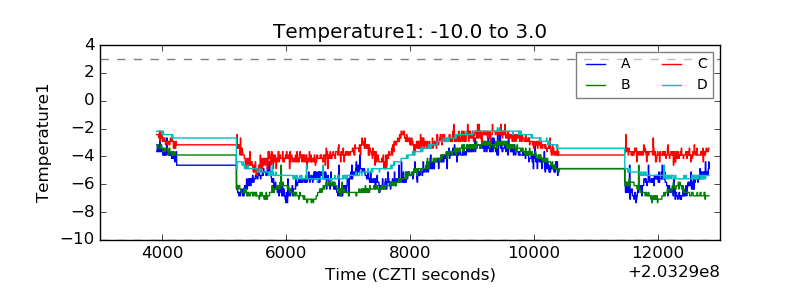 |
| Veto HV Monitor | 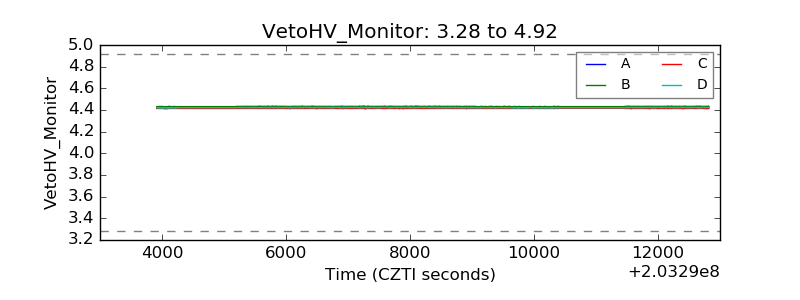 |
| Veto LLD | 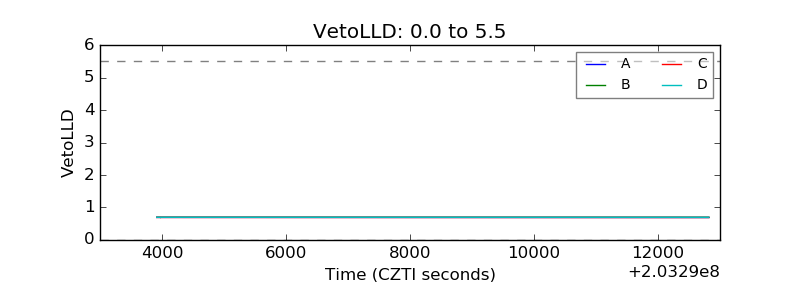 |
| Alpha Counter | 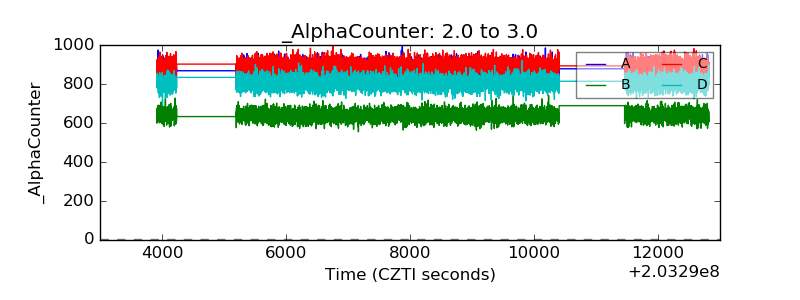 |
| _CPM_Rate | 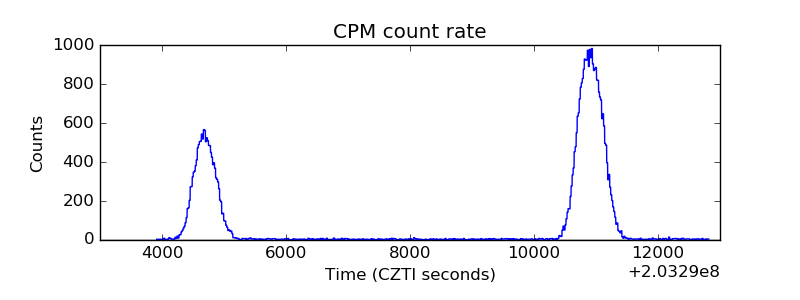 |
| CZT Counter | 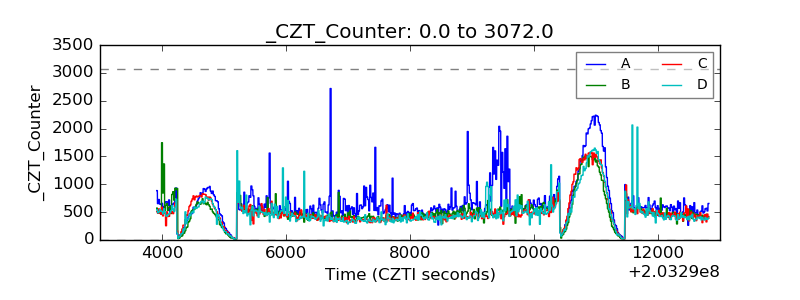 |
| +2.5 Volts monitor |  |
| +5 Volts monitor | 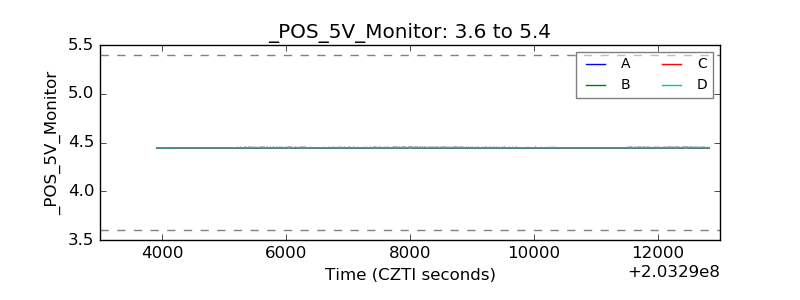 |
| Veto Counter | 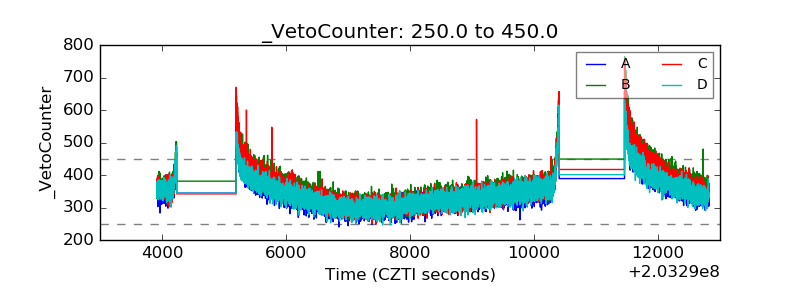 |