| Param | Original file | Final file |
|---|---|---|
| Filename | modeM0/AS1G05_194T01_9000000490_03806cztM0_level2.evt | modeM0/AS1G05_194T01_9000000490_03806cztM0_level2_quad_clean.evt |
| Size (bytes) | 453,329,280 | 79,931,520 |
| Size | 432.3 MB | 76.2 MB |
| Events in quadrant A | 3,666,266 | 502,844 |
| Events in quadrant B | 3,282,147 | 510,261 |
| Events in quadrant C | 3,119,804 | 485,673 |
| Events in quadrant D | 3,222,735 | 471,864 |
| Mode SS | |||
|---|---|---|---|
| Quadrant | BADHDUFLAG | Total packets | Discarded packets |
| A | 0 | 130 | 0 |
| B | 0 | 130 | 0 |
| C | 0 | 130 | 0 |
| D | 0 | 130 | 0 |
| Mode M9 | |||
|---|---|---|---|
| Quadrant | BADHDUFLAG | Total packets | Discarded packets |
| A | 0 | 15 | 0 |
| B | 0 | 15 | 0 |
| C | 0 | 15 | 0 |
| D | 0 | 16 | 0 |
| Mode M0 | |||
|---|---|---|---|
| Quadrant | BADHDUFLAG | Total packets | Discarded packets |
| A | 0 | 14884 | 3 |
| B | 0 | 13553 | 2 |
| C | 0 | 13529 | 2 |
| D | 0 | 13961 | 2 |
| Quadrant | Total seconds | Saturated seconds | Saturation percentage |
|---|---|---|---|
| A | 6451 | 137 | 2.123702% |
| B | 6451 | 76 | 1.178112% |
| C | 6451 | 59 | 0.914587% |
| D | 6451 | 89 | 1.379631% |
Noise dominated data is calculated using 1-second bins in cleaned event files. If a bin has >2000 counts, and if more than 50% of those come from <1% of pixels, then it is considered to be noise-dominated and hence unusable.
| Quadrant | # 1 sec bins | Bins with >0 counts | Bins with >2000 counts | High rate bins dominated by noise | Noise dominated (total time) | Noise dominated (detector-on time) | Marked lightcurve |
|---|---|---|---|---|---|---|---|
| A | 7711 | 6451 | 54 | 54 | 0.70% | 0.84% | 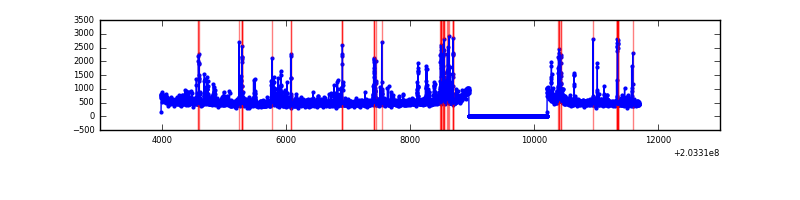 |
| B | 7711 | 6451 | 0 | 0 | 0.00% | 0.00% | 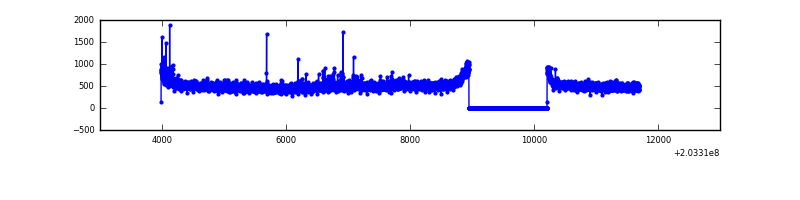 |
| C | 7711 | 6452 | 6 | 6 | 0.08% | 0.09% | 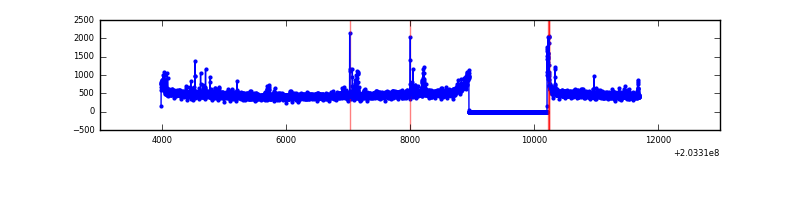 |
| D | 7711 | 6452 | 43 | 43 | 0.56% | 0.67% | 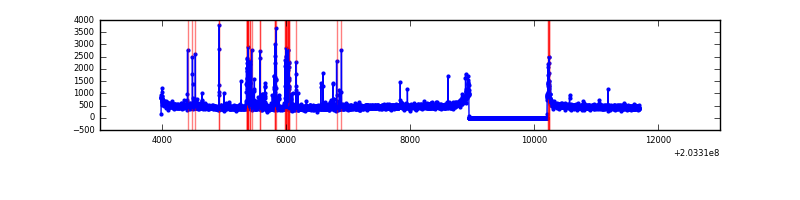 |
Top three noisy pixels from each quadrant. If the there are fewer than three noisy pixels in the level2.evt file, extra rows are filled as -1
| Pixel properties | Quadrant properties | ||||||
|---|---|---|---|---|---|---|---|
| Quadrant | DetID | PixID | Counts | Sigma | Mean | Median | Sigma |
| A | 13 | 251 | 339246 | 2077.17 | 811 | 798 | 162.9 |
| A | 0 | 50 | 151488 | 924.84 | 811 | 798 | 162.9 |
| A | 0 | 118 | 26872 | 160.02 | 811 | 798 | 162.9 |
| B | 0 | 173 | 39890 | 249.27 | 817 | 799 | 156.8 |
| B | 14 | 167 | 34286 | 213.54 | 817 | 799 | 156.8 |
| B | 15 | 204 | 30387 | 188.67 | 817 | 799 | 156.8 |
| C | 2 | 53 | 55839 | 306.65 | 770 | 774 | 179.6 |
| C | 0 | 239 | 20052 | 107.36 | 770 | 774 | 179.6 |
| C | 9 | 247 | 19967 | 106.88 | 770 | 774 | 179.6 |
| D | 13 | 223 | 129512 | 697.21 | 773 | 753 | 184.7 |
| D | 2 | 32 | 59911 | 320.33 | 773 | 753 | 184.7 |
| D | 13 | 239 | 28737 | 151.53 | 773 | 753 | 184.7 |
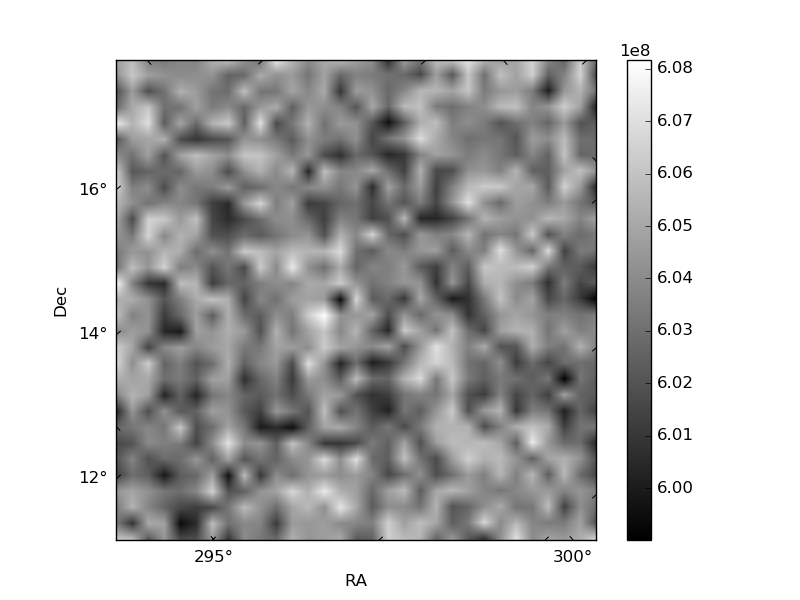
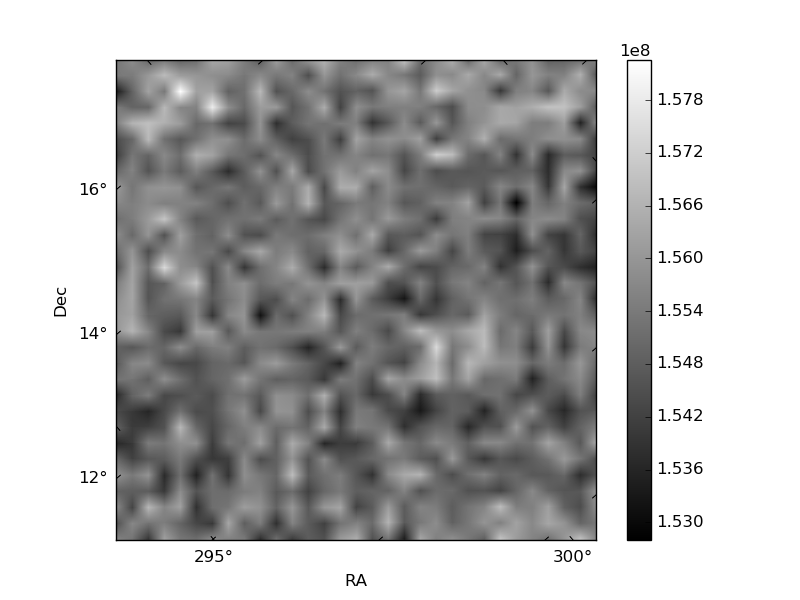
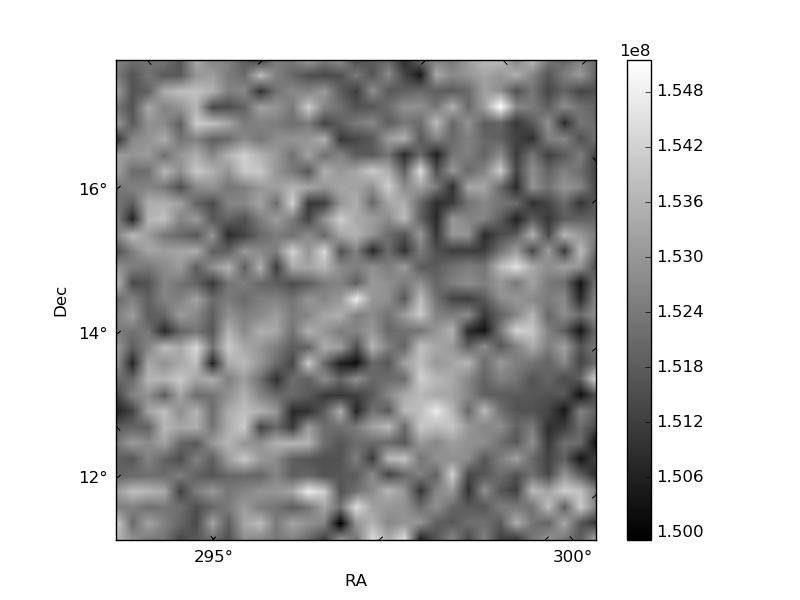
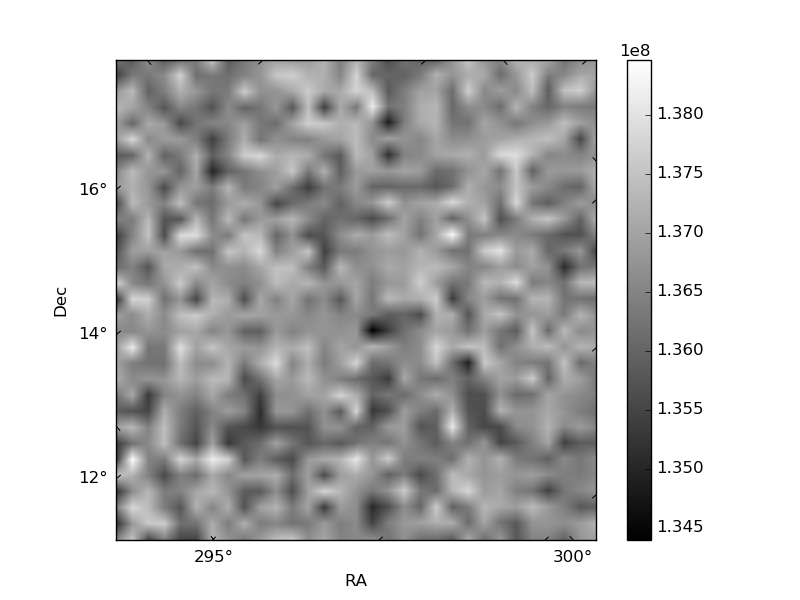
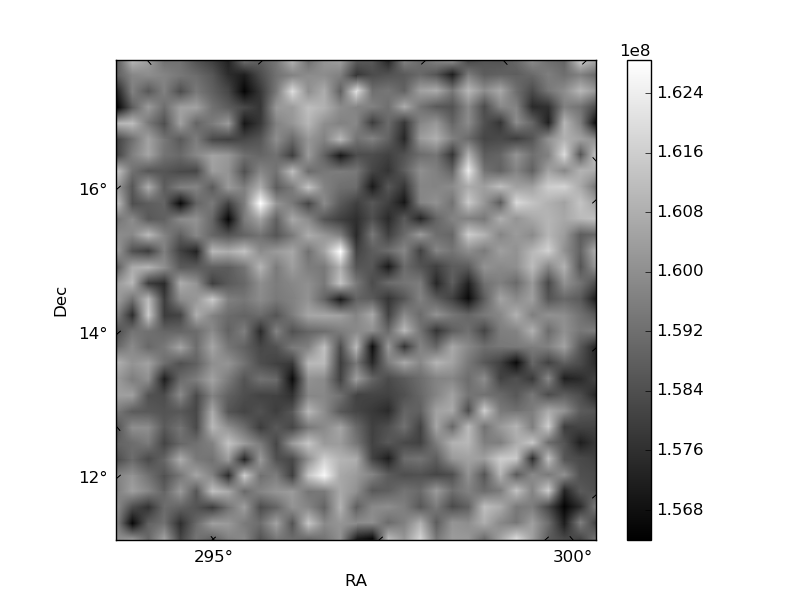
Histogram calculated using DETX and DETY for each event in the final _common_clean file
| Quadrant A | 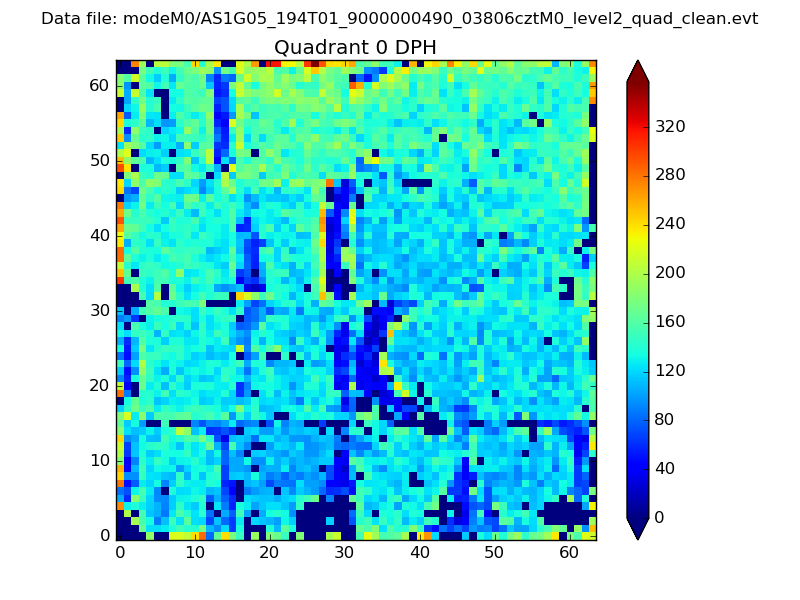 |
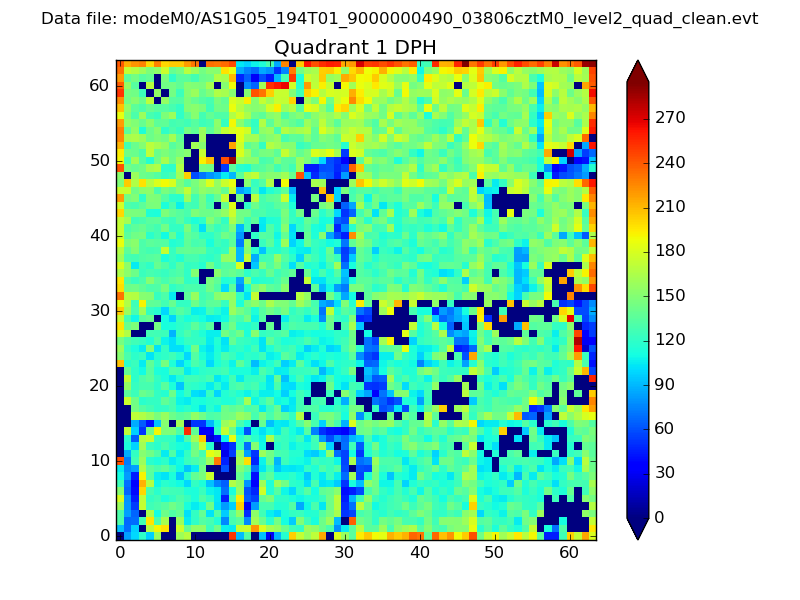 |
Quadrant B |
|---|---|---|---|
| Quadrant D | 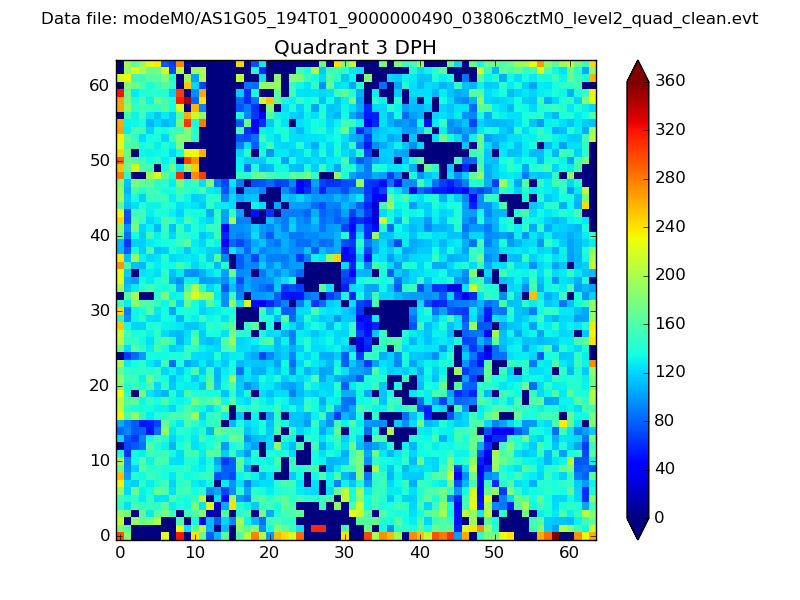 |
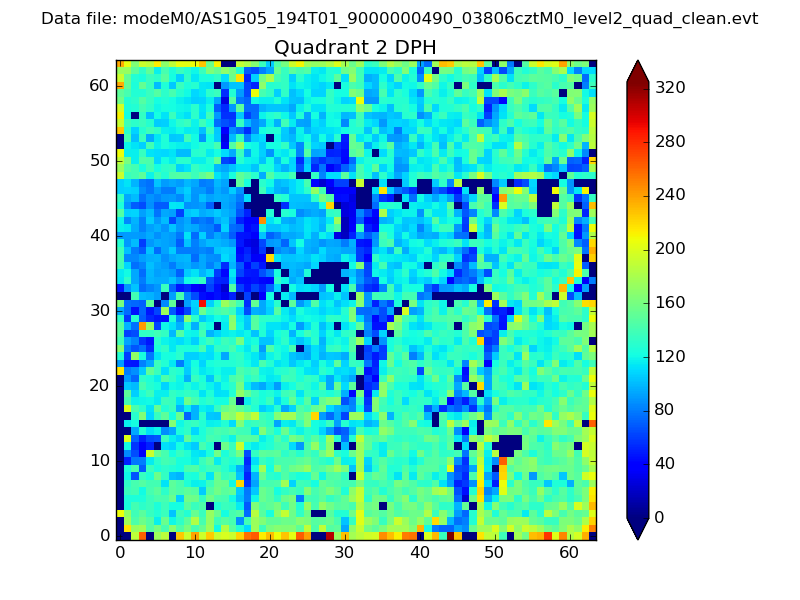 |
Quadrant C |
| Plot type | Count rate plots | Images |
|---|---|---|
| Comparison with Poisson distribution Blue bars denote a histogram of data divided into 1 sec bins. Red curve is a Poisson curve with rate = median count rate of data. |
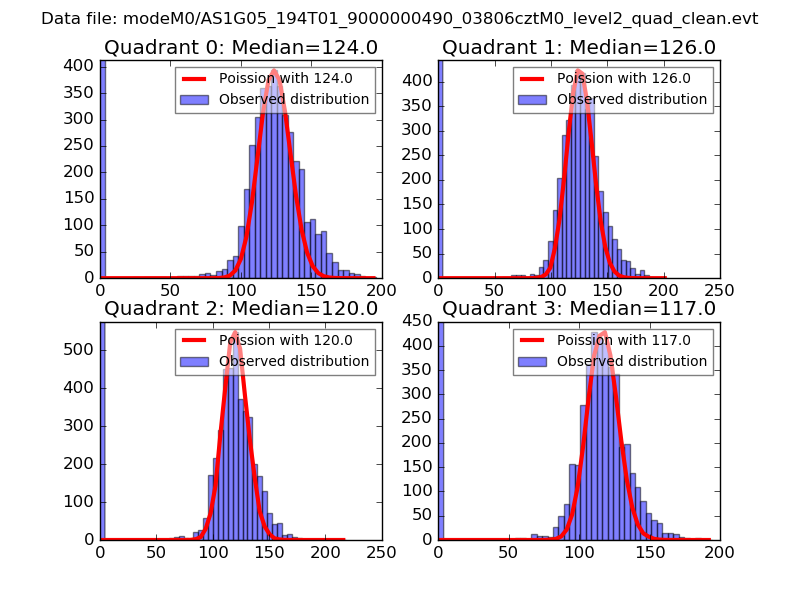 |
 |
| Quadrant-wise count rates Data is divided into 100 sec bins |
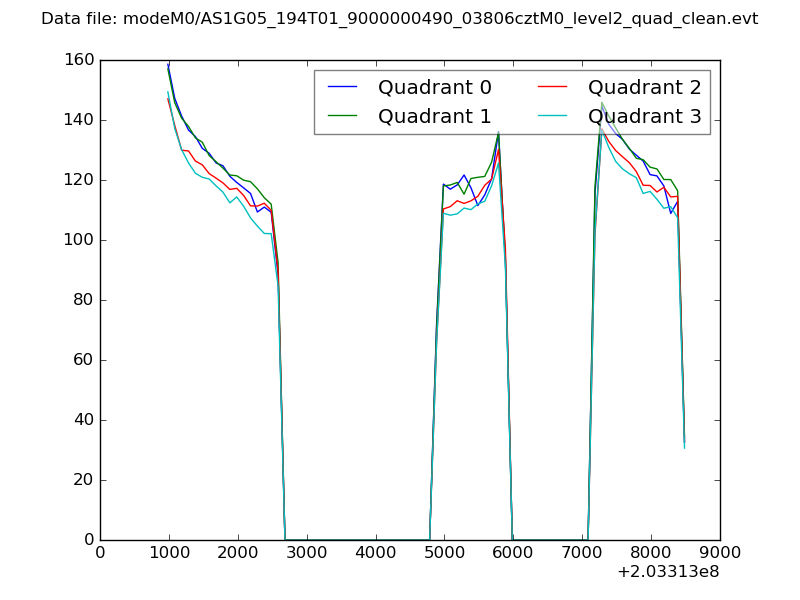 |
|
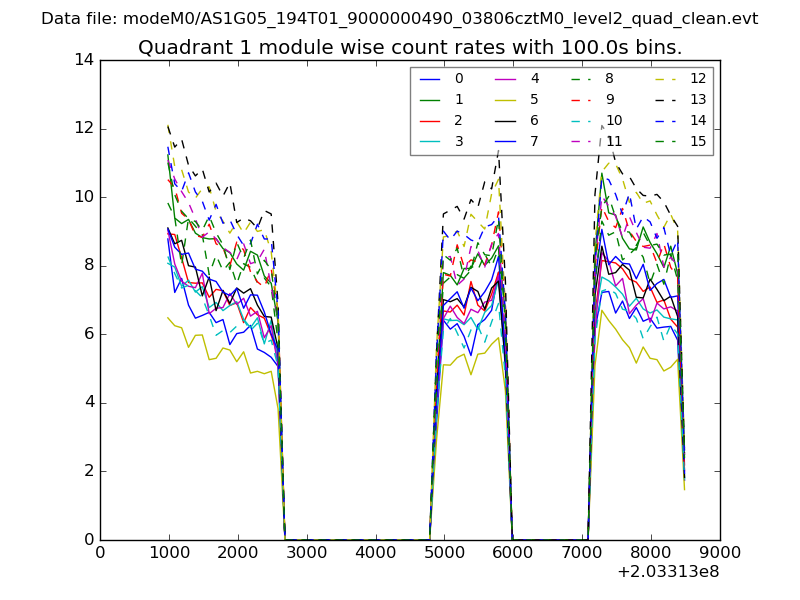
| Module-wise count rates for Quadrant A Data is divided into 100 sec bins |
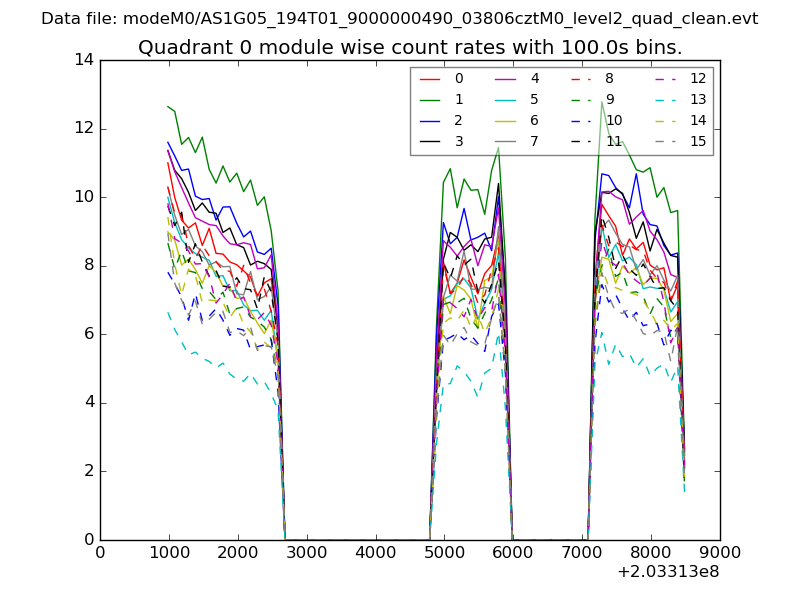 |
 |
| Module-wise count rates for Quadrant B Data is divided into 100 sec bins |
 |
 |
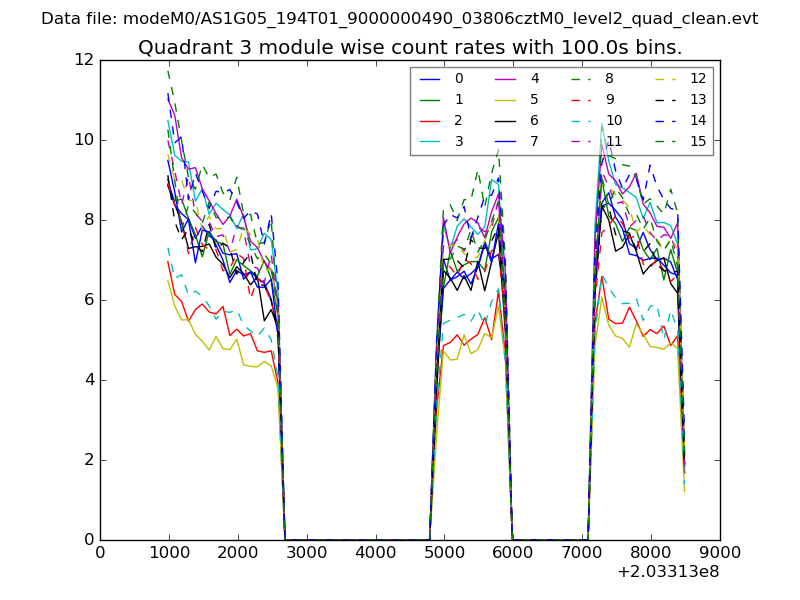
| Module-wise count rates for Quadrant C Data is divided into 100 sec bins |
 |
 |
| Module-wise count rates for Quadrant D Data is divided into 100 sec bins |
 |
 |
| Parameter | Plot |
|---|---|
| CZT HV Monitor | 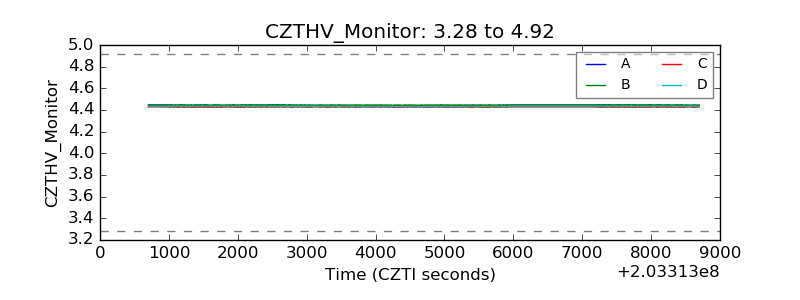 |
| D_VDD | 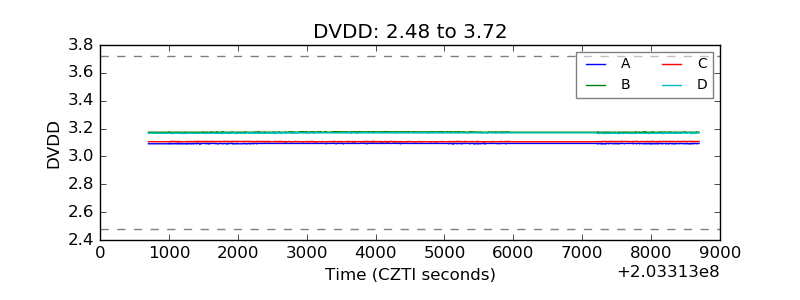 |
| Temperature 1 | 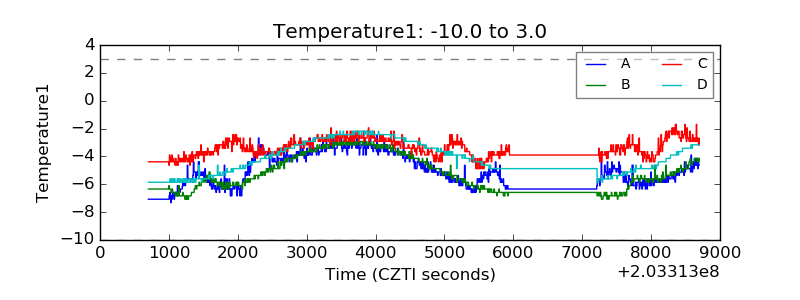 |
| Veto HV Monitor | 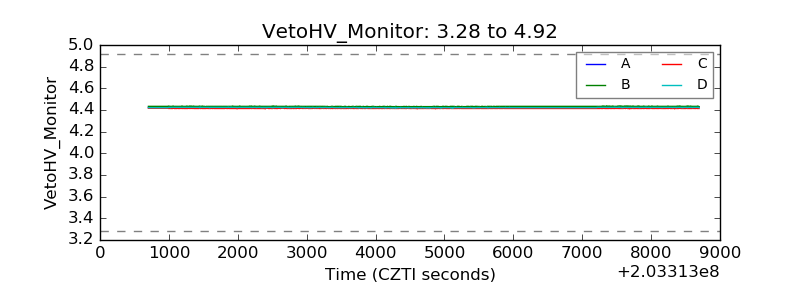 |
| Veto LLD | 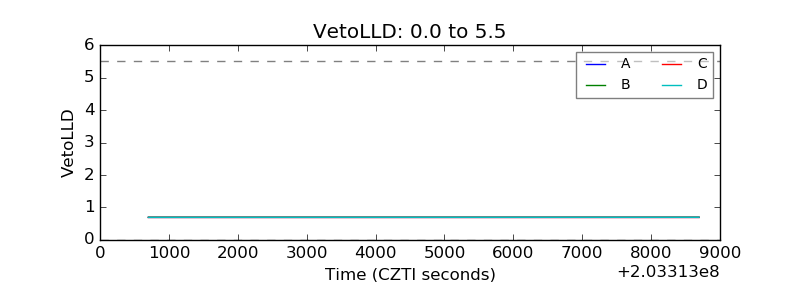 |
| Alpha Counter | 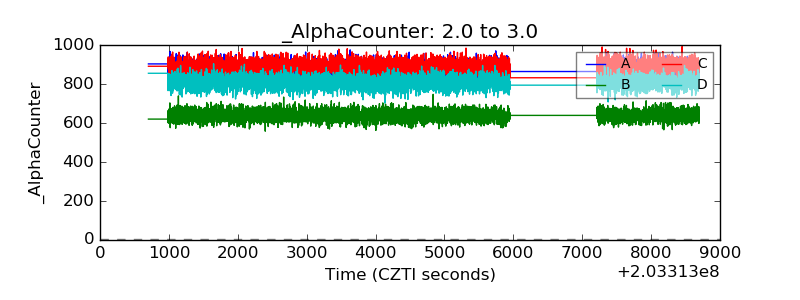 |
| _CPM_Rate | 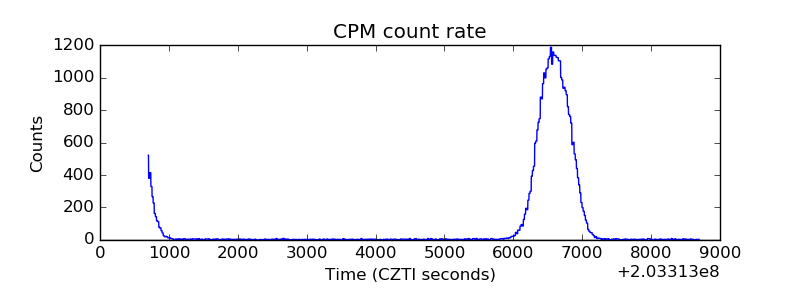 |
| CZT Counter | 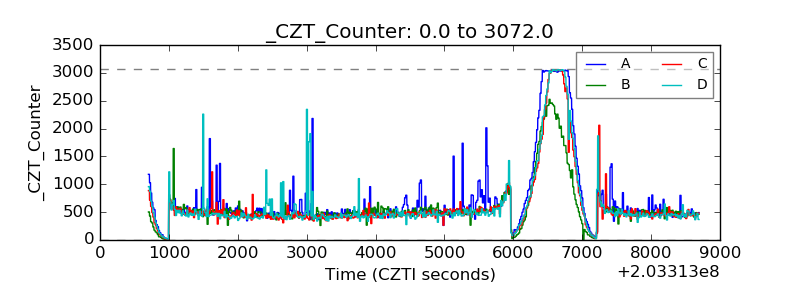 |
| +2.5 Volts monitor |  |
| +5 Volts monitor |  |
| Veto Counter | 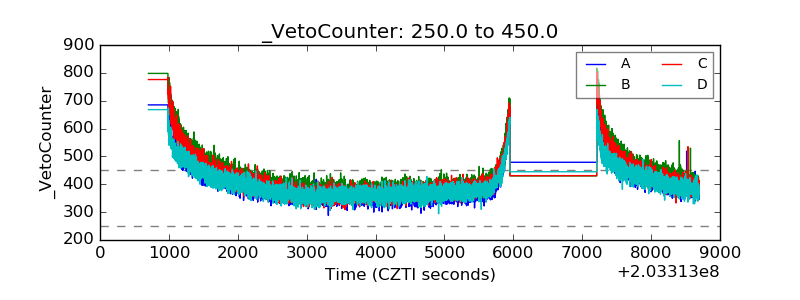 |