| Param | Original file | Final file |
|---|---|---|
| Filename | modeM0/AS1G05_194T01_9000000490_03807cztM0_level2.evt | modeM0/AS1G05_194T01_9000000490_03807cztM0_level2_quad_clean.evt |
| Size (bytes) | 448,392,960 | 70,032,960 |
| Size | 427.6 MB | 66.8 MB |
| Events in quadrant A | 3,366,298 | 427,707 |
| Events in quadrant B | 3,338,698 | 430,110 |
| Events in quadrant C | 3,400,247 | 414,712 |
| Events in quadrant D | 3,036,695 | 398,693 |
| Mode SS | |||
|---|---|---|---|
| Quadrant | BADHDUFLAG | Total packets | Discarded packets |
| A | 0 | 130 | 0 |
| B | 0 | 130 | 0 |
| C | 0 | 130 | 0 |
| D | 0 | 130 | 0 |
| Mode M9 | |||
|---|---|---|---|
| Quadrant | BADHDUFLAG | Total packets | Discarded packets |
| A | 0 | 13 | 0 |
| B | 0 | 13 | 0 |
| C | 0 | 13 | 0 |
| D | 0 | 13 | 0 |
| Mode M0 | |||
|---|---|---|---|
| Quadrant | BADHDUFLAG | Total packets | Discarded packets |
| A | 0 | 13976 | 2 |
| B | 0 | 13656 | 1 |
| C | 0 | 14353 | 1 |
| D | 0 | 13460 | 1 |
| Quadrant | Total seconds | Saturated seconds | Saturation percentage |
|---|---|---|---|
| A | 6442 | 91 | 1.412605% |
| B | 6442 | 77 | 1.195281% |
| C | 6442 | 63 | 0.977957% |
| D | 6442 | 50 | 0.776156% |
Noise dominated data is calculated using 1-second bins in cleaned event files. If a bin has >2000 counts, and if more than 50% of those come from <1% of pixels, then it is considered to be noise-dominated and hence unusable.
| Quadrant | # 1 sec bins | Bins with >0 counts | Bins with >2000 counts | High rate bins dominated by noise | Noise dominated (total time) | Noise dominated (detector-on time) | Marked lightcurve |
|---|---|---|---|---|---|---|---|
| A | 7702 | 6443 | 25 | 25 | 0.32% | 0.39% |  |
| B | 7702 | 6442 | 7 | 7 | 0.09% | 0.11% | 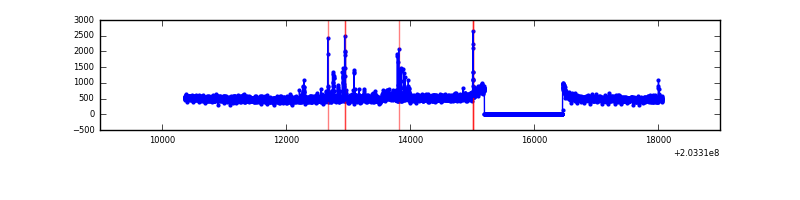 |
| C | 7702 | 6443 | 65 | 65 | 0.84% | 1.01% | 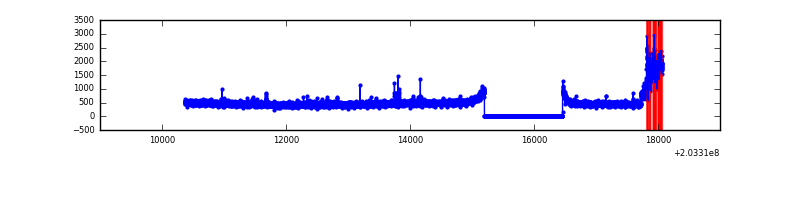 |
| D | 7702 | 6442 | 17 | 17 | 0.22% | 0.26% |  |
Top three noisy pixels from each quadrant. If the there are fewer than three noisy pixels in the level2.evt file, extra rows are filled as -1
| Pixel properties | Quadrant properties | ||||||
|---|---|---|---|---|---|---|---|
| Quadrant | DetID | PixID | Counts | Sigma | Mean | Median | Sigma |
| A | 13 | 251 | 122213 | 742.15 | 801 | 787 | 163.6 |
| A | 0 | 50 | 73556 | 444.76 | 801 | 787 | 163.6 |
| A | 0 | 118 | 49629 | 298.52 | 801 | 787 | 163.6 |
| B | 15 | 204 | 119427 | 759.94 | 805 | 789 | 156.1 |
| B | 14 | 167 | 70279 | 445.12 | 805 | 789 | 156.1 |
| B | 4 | 81 | 13058 | 78.59 | 805 | 789 | 156.1 |
| C | 2 | 53 | 403223 | 2272.79 | 760 | 765 | 177.1 |
| C | 12 | 4 | 10374 | 54.26 | 760 | 765 | 177.1 |
| C | 10 | 65 | 9757 | 50.78 | 760 | 765 | 177.1 |
| D | 2 | 14 | 32182 | 170.24 | 765 | 744 | 184.7 |
| D | 2 | 31 | 25541 | 134.28 | 765 | 744 | 184.7 |
| D | 2 | 32 | 21559 | 112.72 | 765 | 744 | 184.7 |
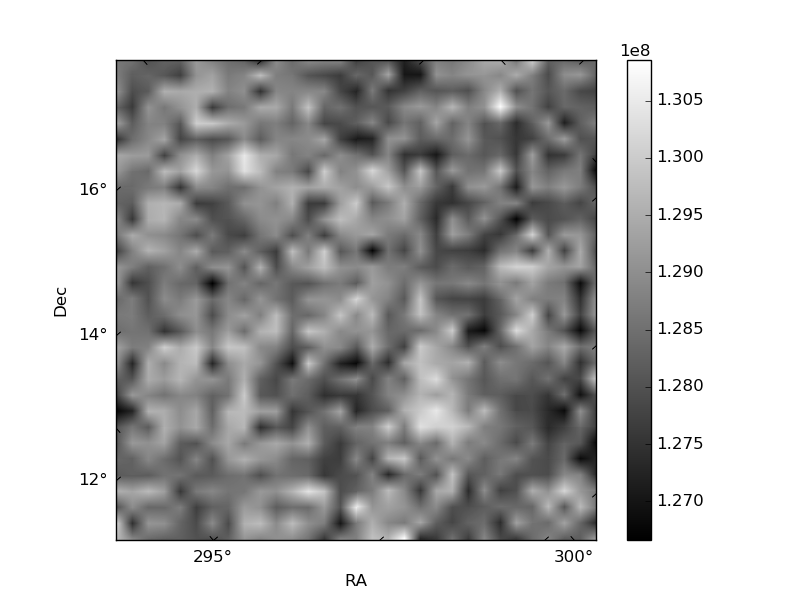
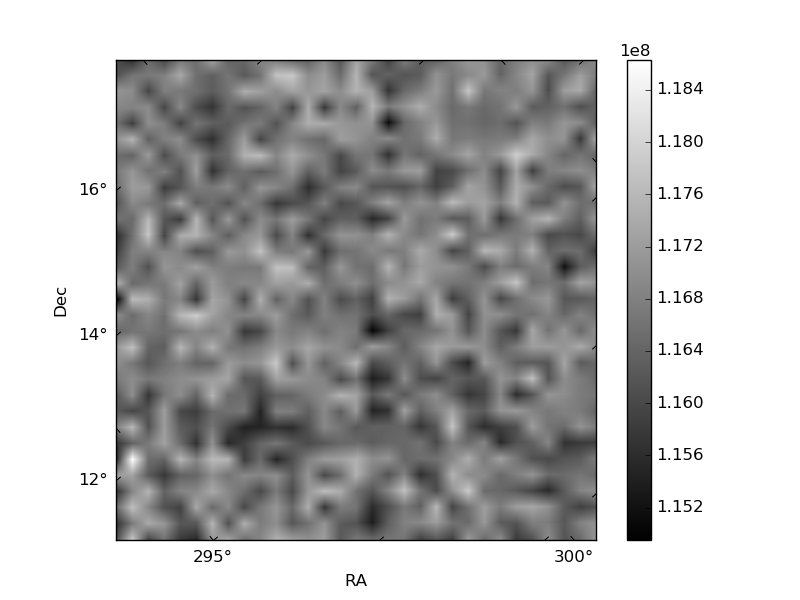
Histogram calculated using DETX and DETY for each event in the final _common_clean file
| Quadrant A | 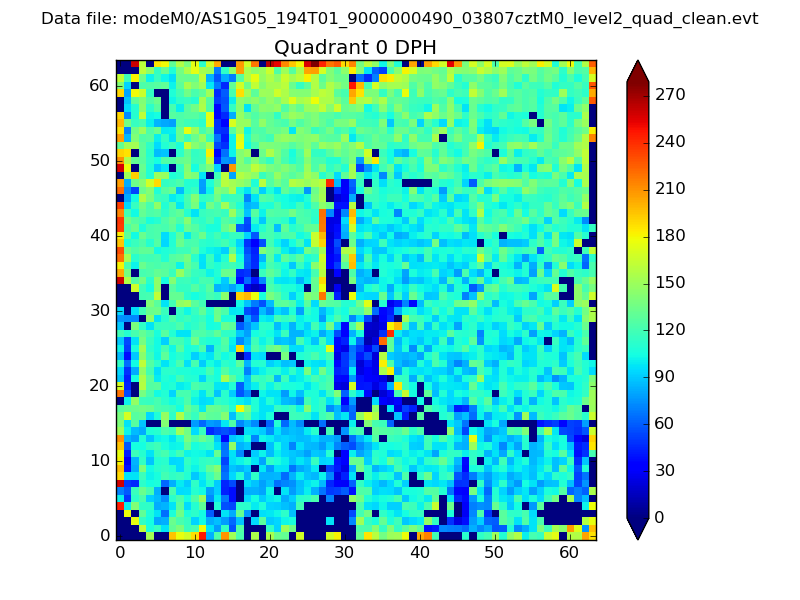 |
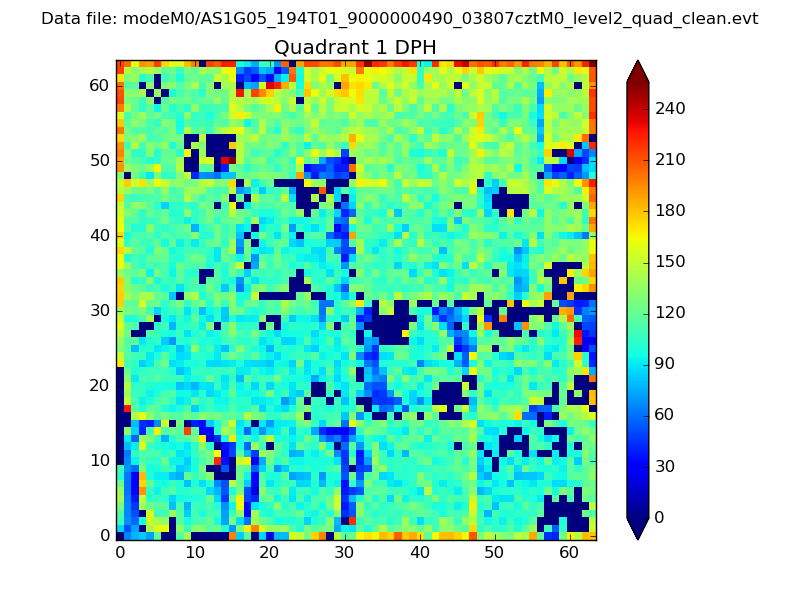 |
Quadrant B |
|---|---|---|---|
| Quadrant D | 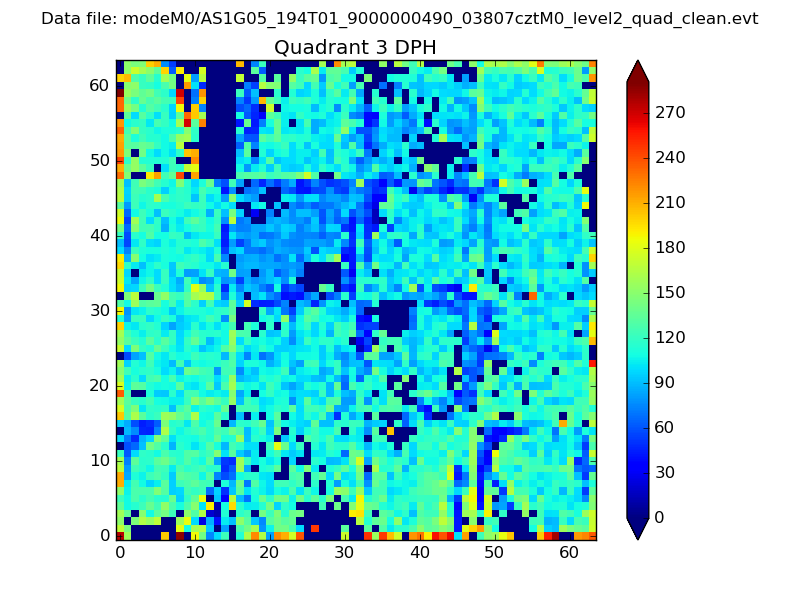 |
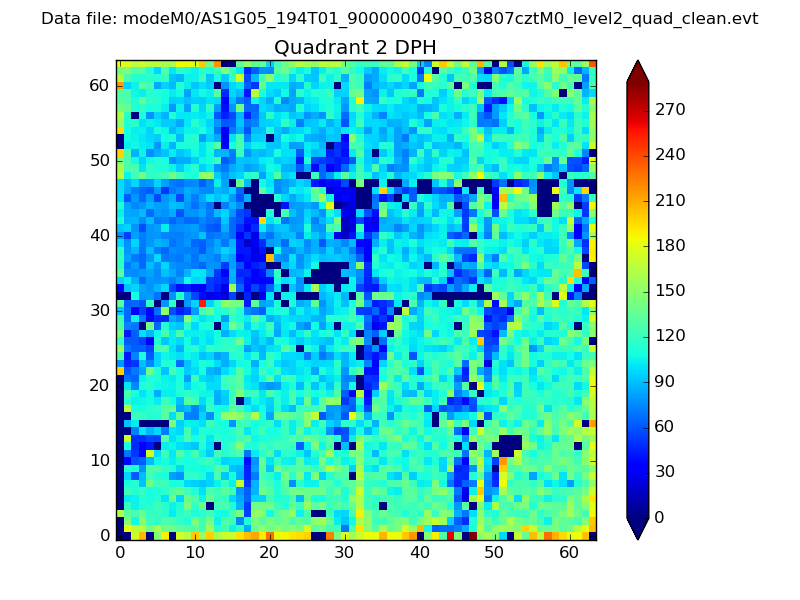 |
Quadrant C |
| Plot type | Count rate plots | Images |
|---|---|---|
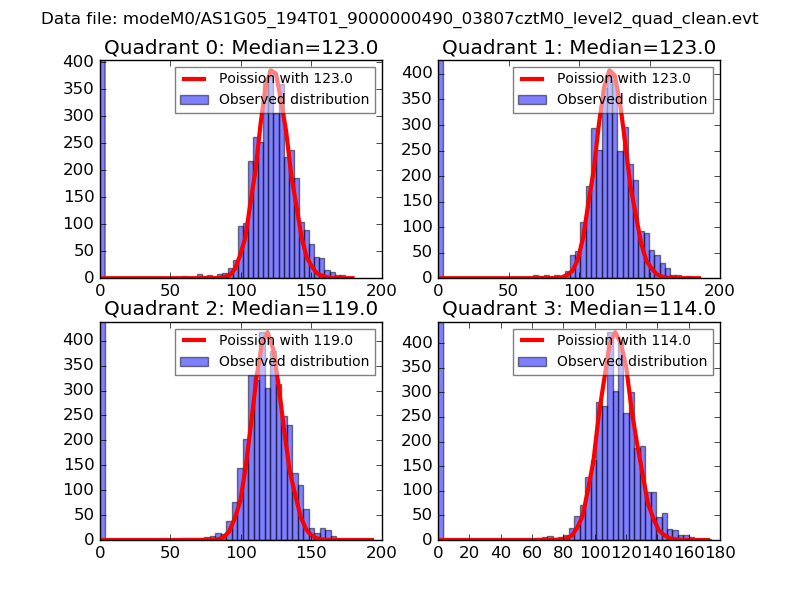
| Comparison with Poisson distribution Blue bars denote a histogram of data divided into 1 sec bins. Red curve is a Poisson curve with rate = median count rate of data. |
 |
 |
| Quadrant-wise count rates Data is divided into 100 sec bins |
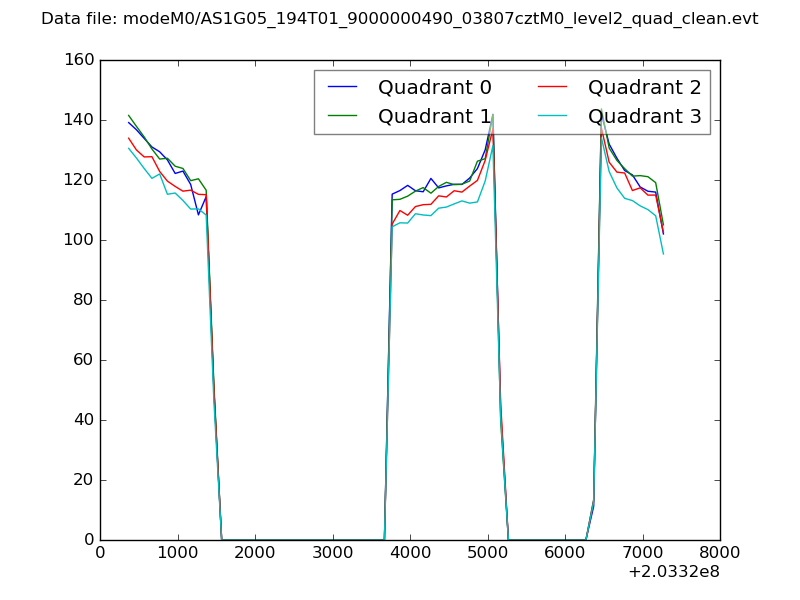 |
|
| Module-wise count rates for Quadrant A Data is divided into 100 sec bins |
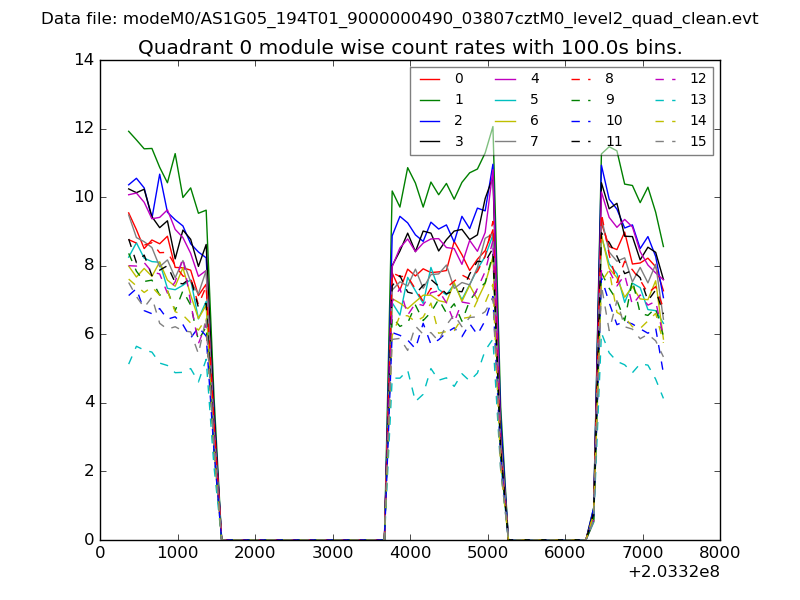 |
 |
| Module-wise count rates for Quadrant B Data is divided into 100 sec bins |
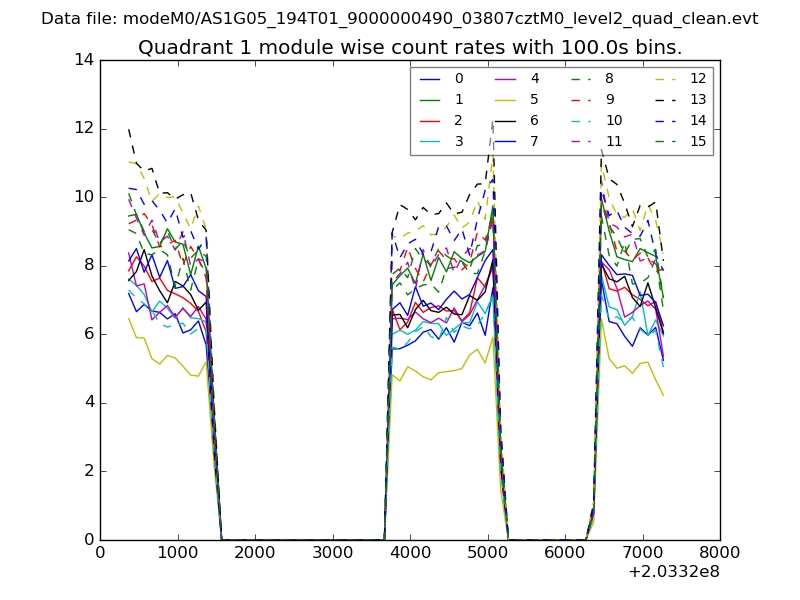 |
 |
| Module-wise count rates for Quadrant C Data is divided into 100 sec bins |
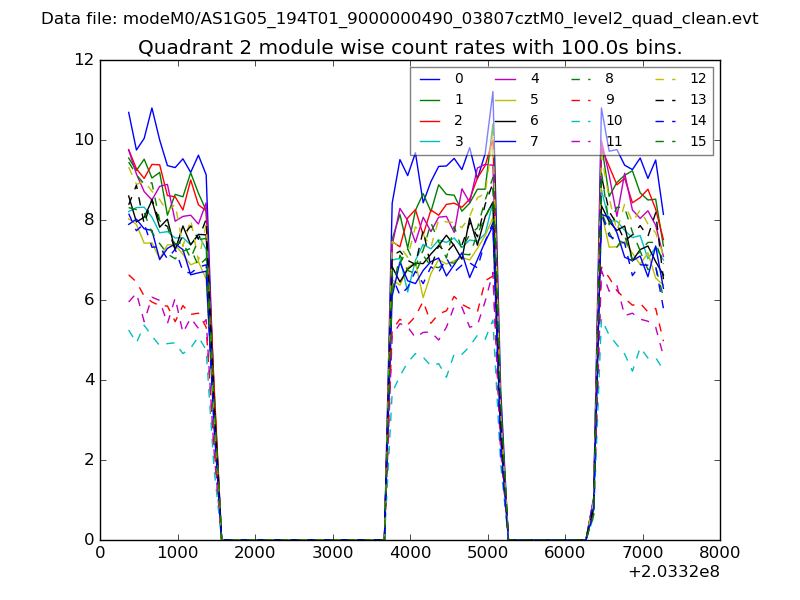 |
 |
| Module-wise count rates for Quadrant D Data is divided into 100 sec bins |
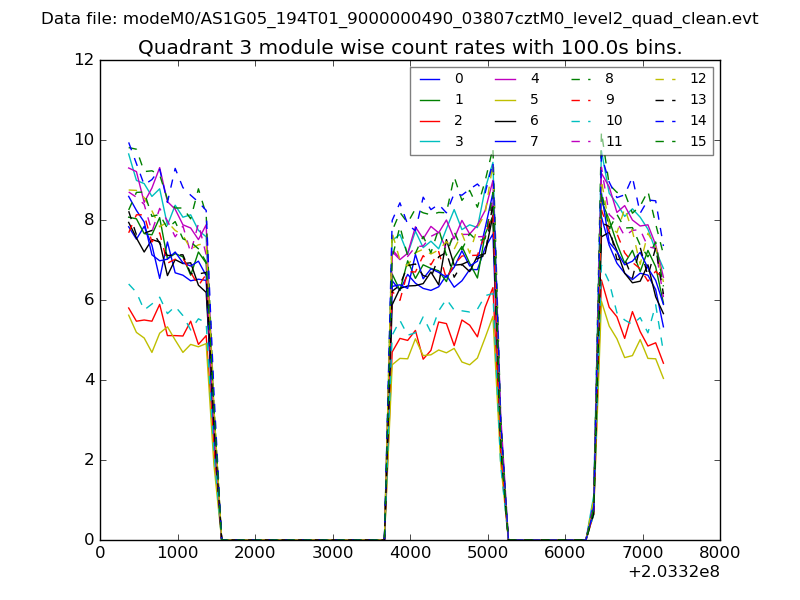 |
 |
| Parameter | Plot |
|---|---|
| CZT HV Monitor | 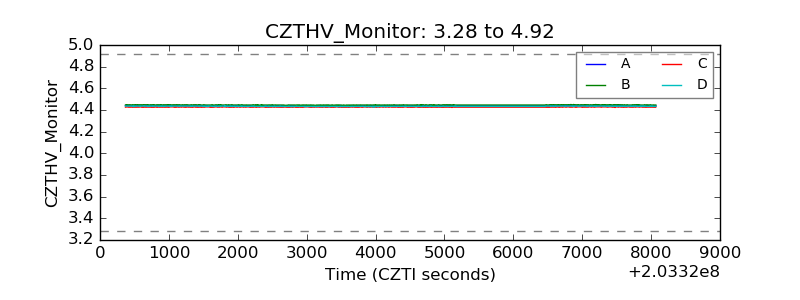 |
| D_VDD | 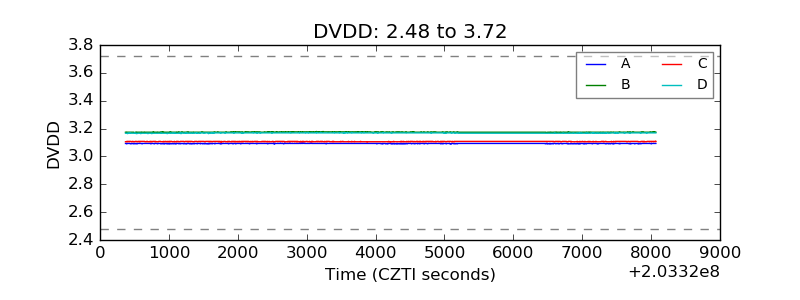 |
| Temperature 1 | 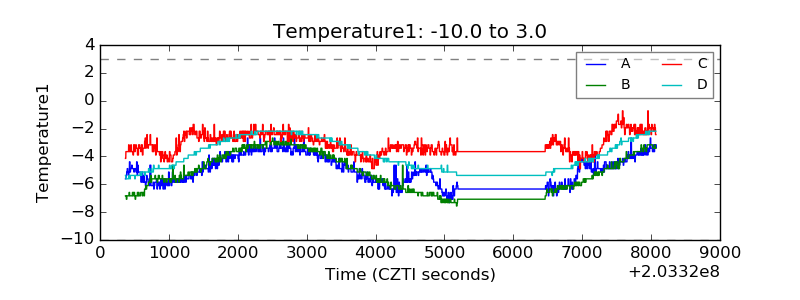 |
| Veto HV Monitor | 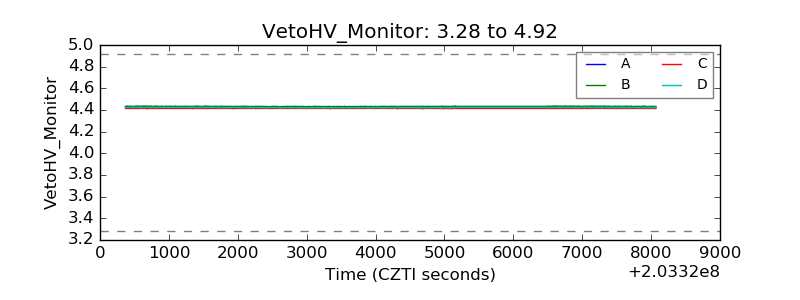 |
| Veto LLD |  |
| Alpha Counter | 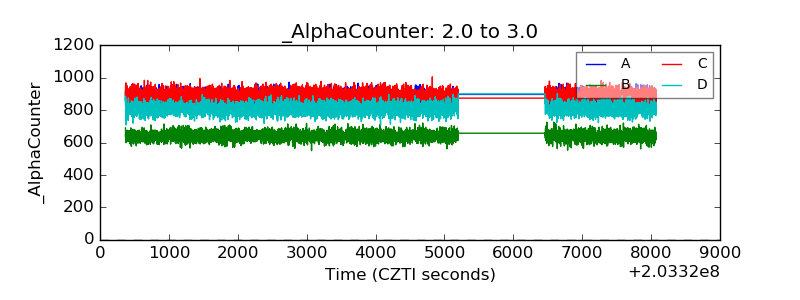 |
| _CPM_Rate | 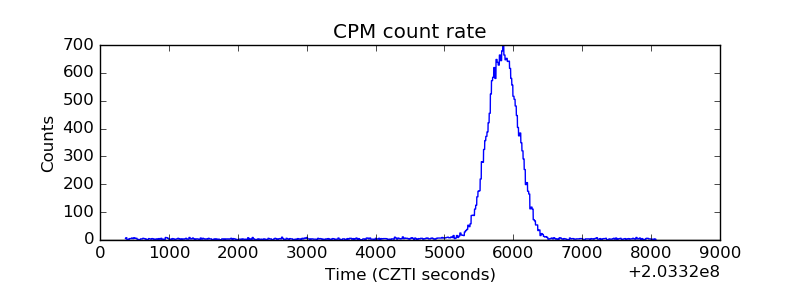 |
| CZT Counter | 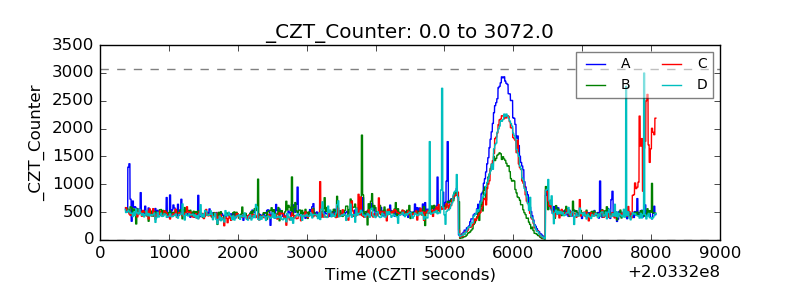 |
| +2.5 Volts monitor |  |
| +5 Volts monitor |  |
| Veto Counter | 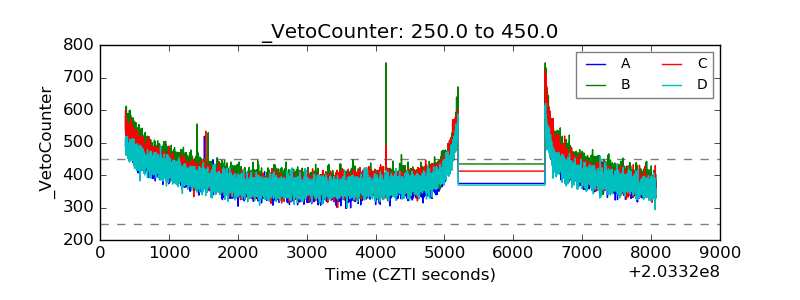 |