| Param | Original file | Final file |
|---|---|---|
| Filename | modeM0/AS1G05_194T01_9000000490_03808cztM0_level2.evt | modeM0/AS1G05_194T01_9000000490_03808cztM0_level2_quad_clean.evt |
| Size (bytes) | 509,955,840 | 59,051,520 |
| Size | 486.3 MB | 56.3 MB |
| Events in quadrant A | 3,284,592 | 343,083 |
| Events in quadrant B | 3,438,745 | 348,429 |
| Events in quadrant C | 5,009,702 | 328,287 |
| Events in quadrant D | 3,282,841 | 327,283 |
| Mode SS | |||
|---|---|---|---|
| Quadrant | BADHDUFLAG | Total packets | Discarded packets |
| A | 0 | 128 | 0 |
| B | 0 | 128 | 0 |
| C | 0 | 128 | 0 |
| D | 0 | 128 | 0 |
| Mode M9 | |||
|---|---|---|---|
| Quadrant | BADHDUFLAG | Total packets | Discarded packets |
| A | 0 | 11 | 0 |
| B | 0 | 11 | 0 |
| C | 0 | 11 | 0 |
| D | 0 | 11 | 0 |
| Mode M0 | |||
|---|---|---|---|
| Quadrant | BADHDUFLAG | Total packets | Discarded packets |
| A | 0 | 13804 | 2 |
| B | 0 | 14044 | 1 |
| C | 0 | 19006 | 1 |
| D | 0 | 14167 | 1 |
| Quadrant | Total seconds | Saturated seconds | Saturation percentage |
|---|---|---|---|
| A | 6311 | 173 | 2.741245% |
| B | 6311 | 120 | 1.901442% |
| C | 6311 | 359 | 5.688480% |
| D | 6311 | 200 | 3.169070% |
Noise dominated data is calculated using 1-second bins in cleaned event files. If a bin has >2000 counts, and if more than 50% of those come from <1% of pixels, then it is considered to be noise-dominated and hence unusable.
| Quadrant | # 1 sec bins | Bins with >0 counts | Bins with >2000 counts | High rate bins dominated by noise | Noise dominated (total time) | Noise dominated (detector-on time) | Marked lightcurve |
|---|---|---|---|---|---|---|---|
| A | 7411 | 6311 | 57 | 57 | 0.77% | 0.90% |  |
| B | 7411 | 6311 | 4 | 4 | 0.05% | 0.06% |  |
| C | 7411 | 6311 | 279 | 279 | 3.76% | 4.42% | 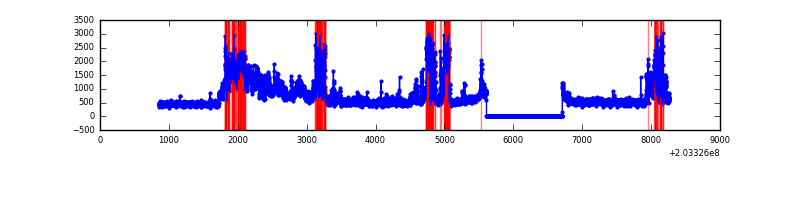 |
| D | 7411 | 6311 | 92 | 92 | 1.24% | 1.46% |  |
Top three noisy pixels from each quadrant. If the there are fewer than three noisy pixels in the level2.evt file, extra rows are filled as -1
| Pixel properties | Quadrant properties | ||||||
|---|---|---|---|---|---|---|---|
| Quadrant | DetID | PixID | Counts | Sigma | Mean | Median | Sigma |
| A | 0 | 50 | 167070 | 1063.07 | 766 | 751 | 156.5 |
| A | 13 | 251 | 108456 | 688.42 | 766 | 751 | 156.5 |
| A | 0 | 118 | 24910 | 154.42 | 766 | 751 | 156.5 |
| B | 15 | 204 | 127532 | 837.42 | 775 | 758 | 151.4 |
| B | 14 | 167 | 113554 | 745.09 | 775 | 758 | 151.4 |
| B | 0 | 173 | 106701 | 699.82 | 775 | 758 | 151.4 |
| C | 2 | 53 | 2165490 | 12802.29 | 723 | 726 | 169.1 |
| C | 13 | 61 | 5882 | 30.49 | 723 | 726 | 169.1 |
| C | 9 | 247 | 5752 | 29.72 | 723 | 726 | 169.1 |
| D | 2 | 32 | 385043 | 2167.82 | 729 | 707 | 177.3 |
| D | 13 | 239 | 32577 | 179.76 | 729 | 707 | 177.3 |
| D | 13 | 223 | 31921 | 176.06 | 729 | 707 | 177.3 |
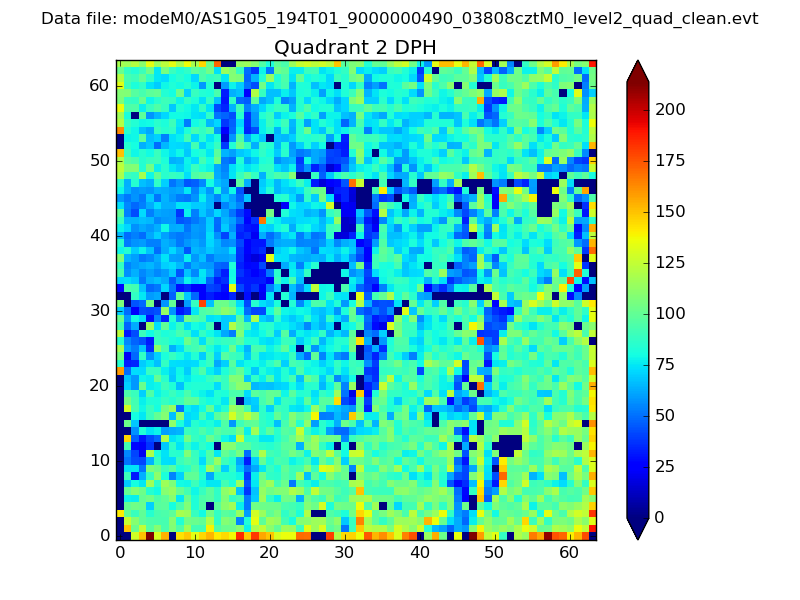
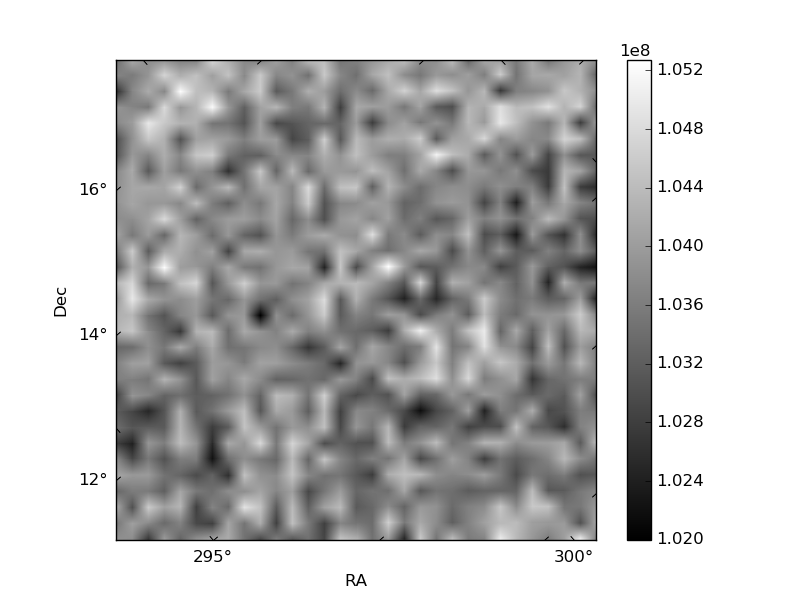
Histogram calculated using DETX and DETY for each event in the final _common_clean file
| Quadrant A | 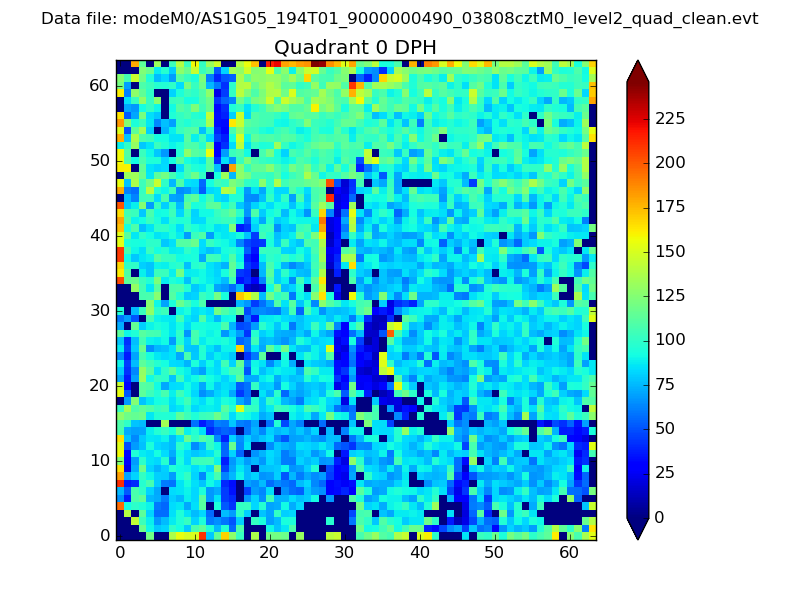 |
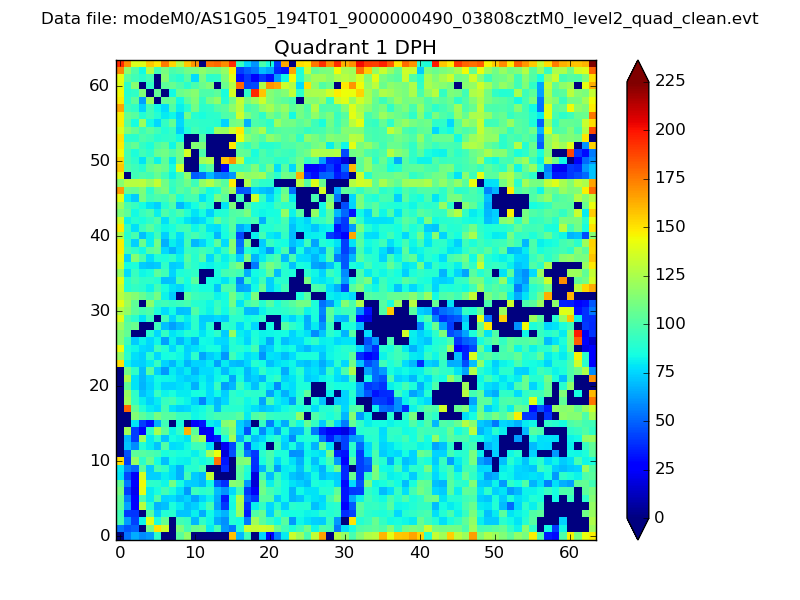 |
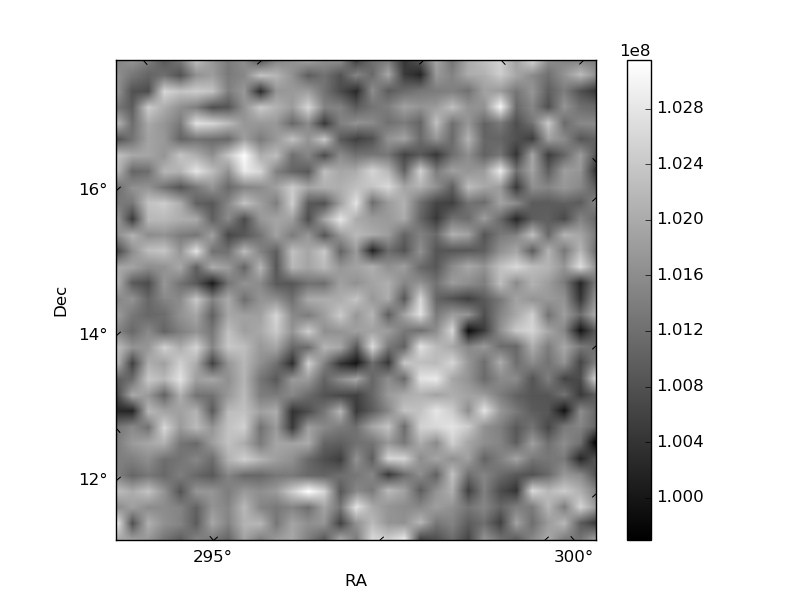
Quadrant B |
|---|---|---|---|
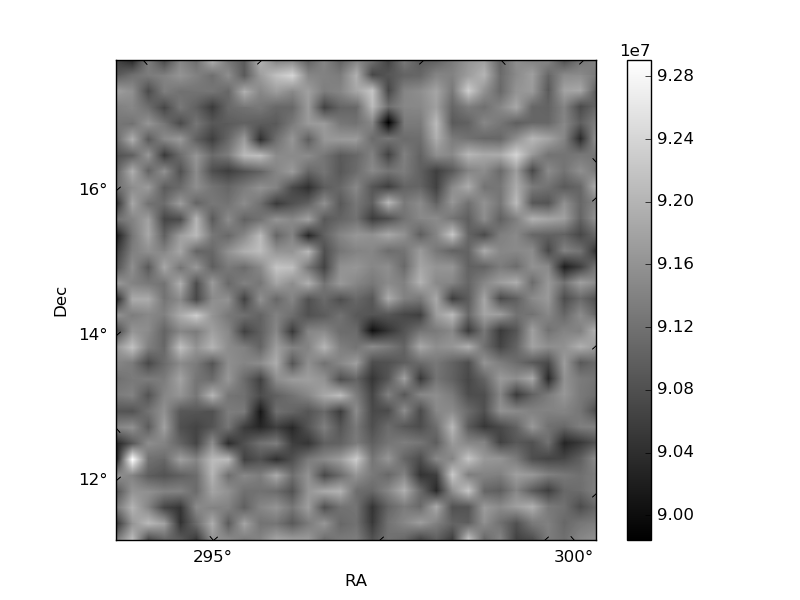
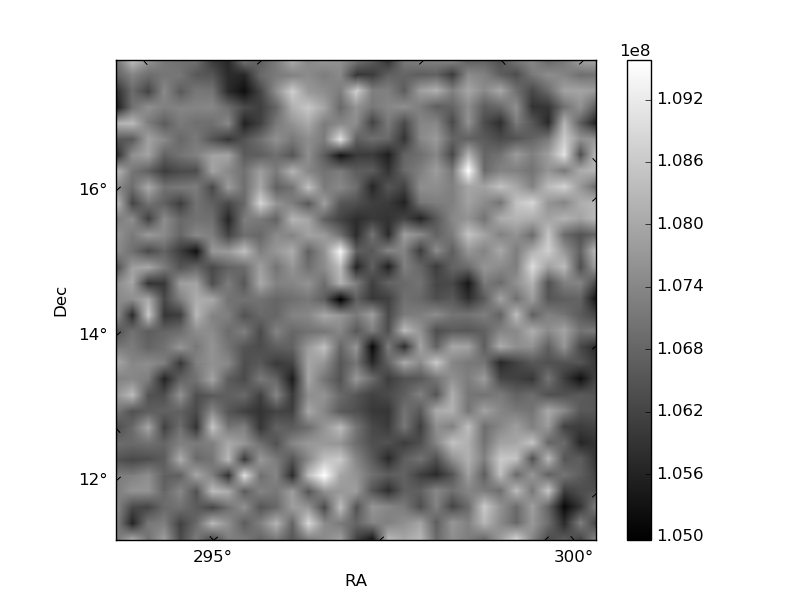
| Quadrant D | 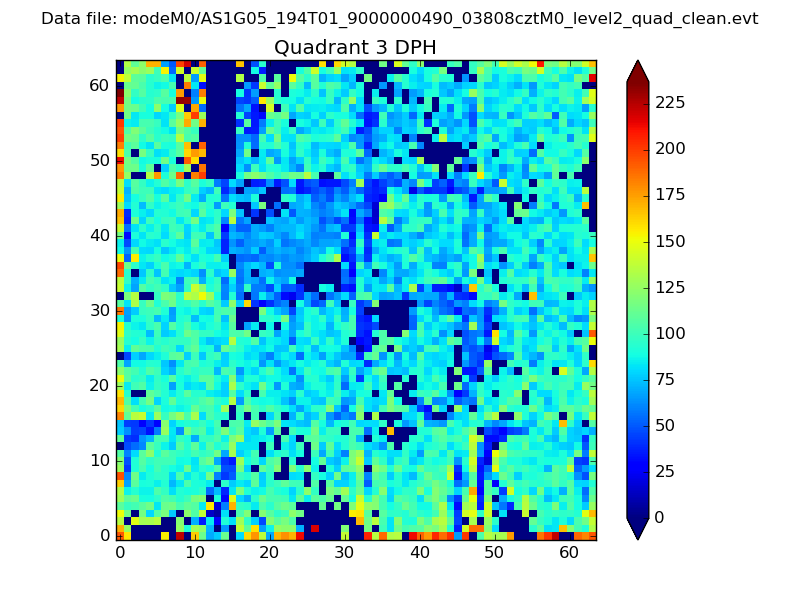 |
 |
Quadrant C |
| Plot type | Count rate plots | Images |
|---|---|---|
| Comparison with Poisson distribution Blue bars denote a histogram of data divided into 1 sec bins. Red curve is a Poisson curve with rate = median count rate of data. |
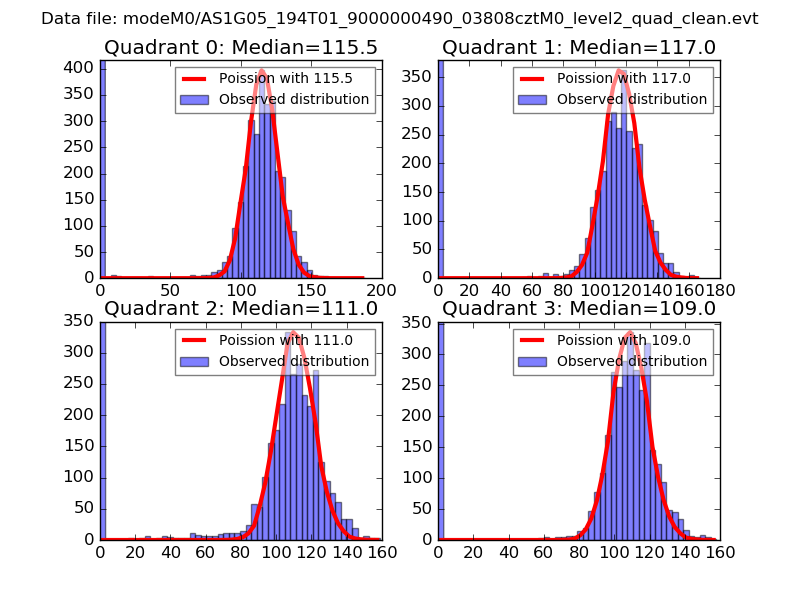 |
 |
| Quadrant-wise count rates Data is divided into 100 sec bins |
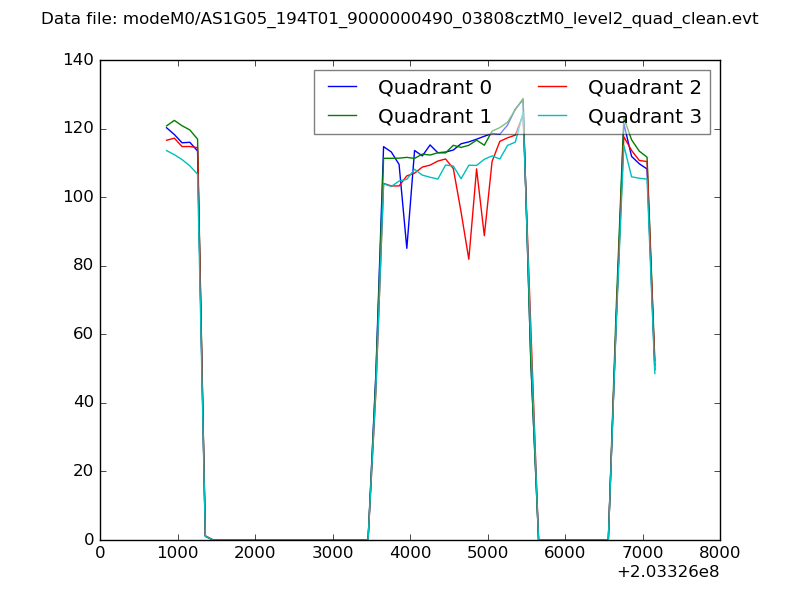 |
|
| Module-wise count rates for Quadrant A Data is divided into 100 sec bins |
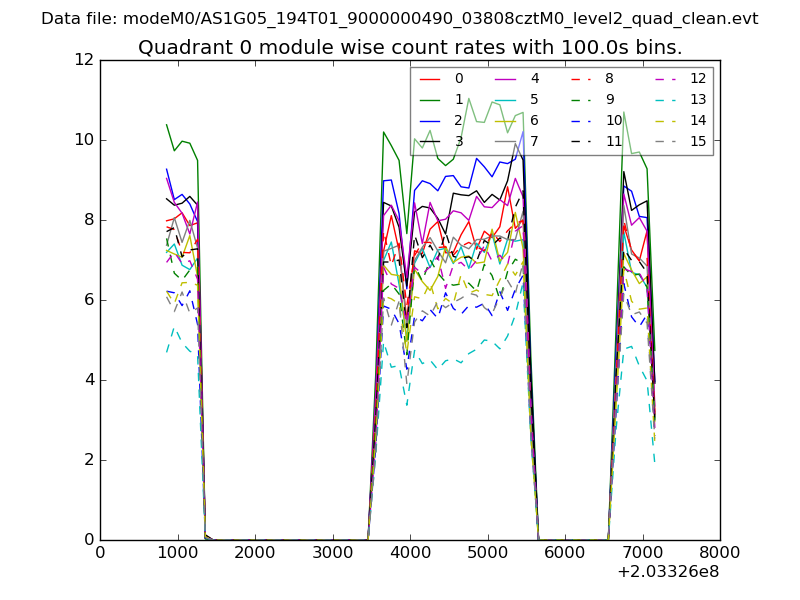 |
 |
| Module-wise count rates for Quadrant B Data is divided into 100 sec bins |
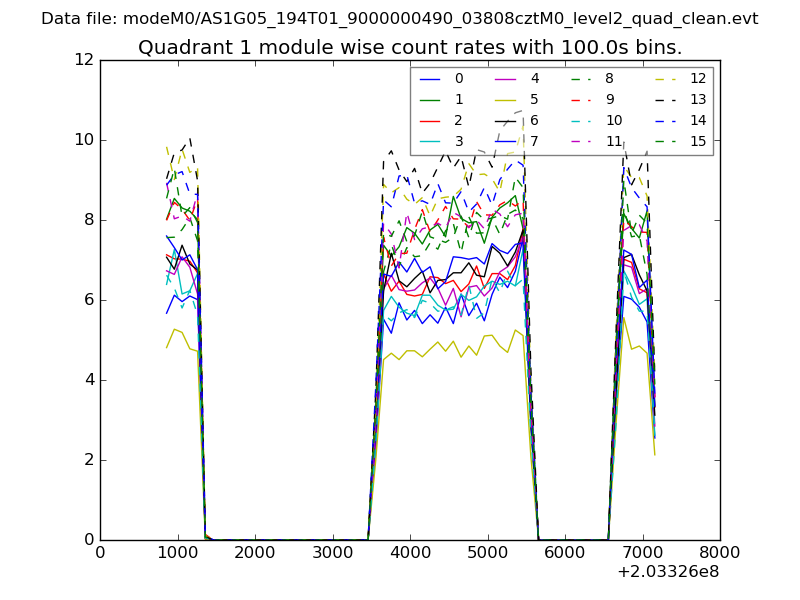 |
 |
| Module-wise count rates for Quadrant C Data is divided into 100 sec bins |
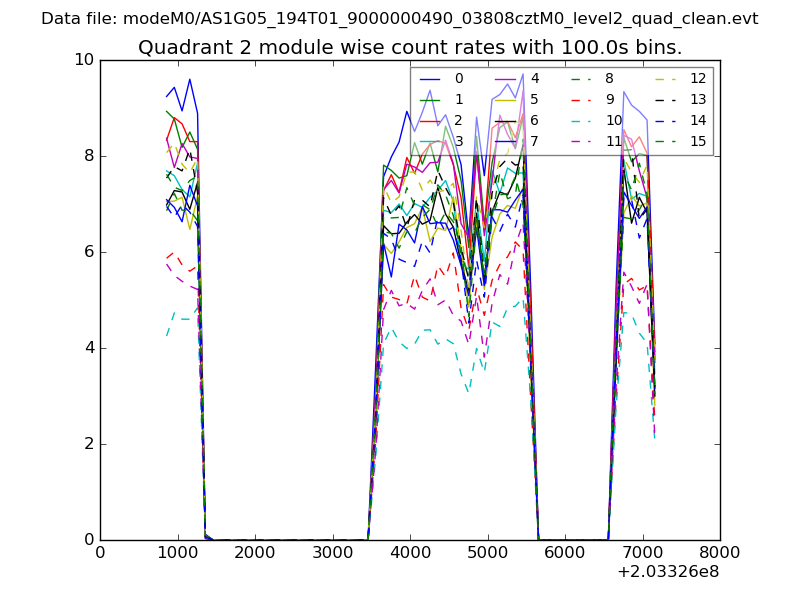 |
 |
| Module-wise count rates for Quadrant D Data is divided into 100 sec bins |
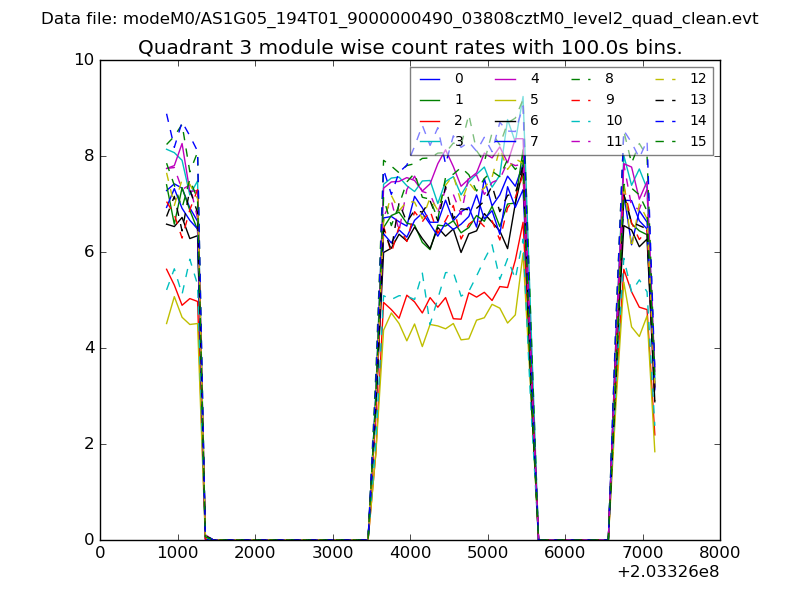 |
 |
| Parameter | Plot |
|---|---|
| CZT HV Monitor | 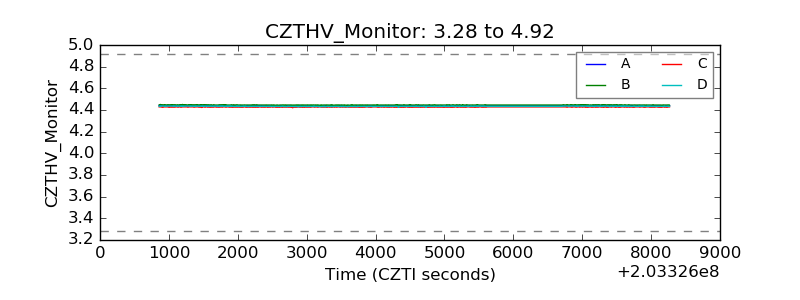 |
| D_VDD | 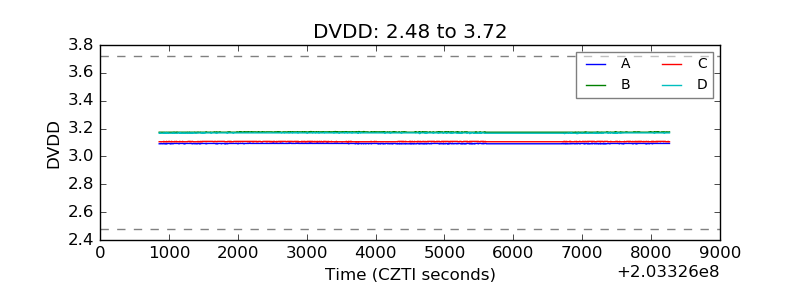 |
| Temperature 1 |  |
| Veto HV Monitor | 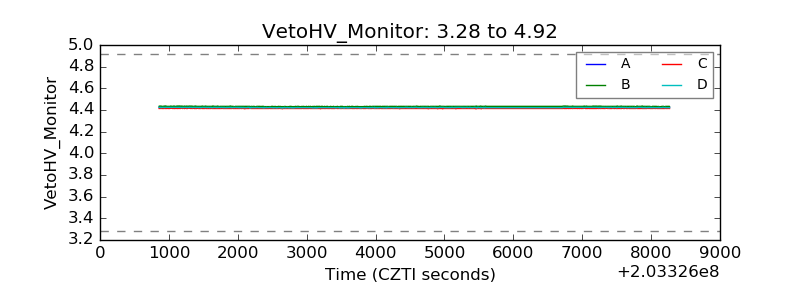 |
| Veto LLD | 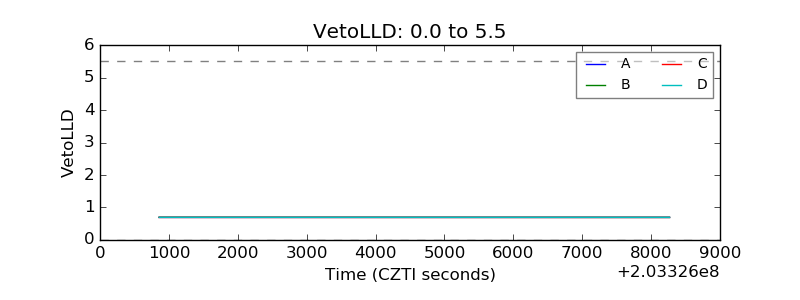 |
| Alpha Counter | 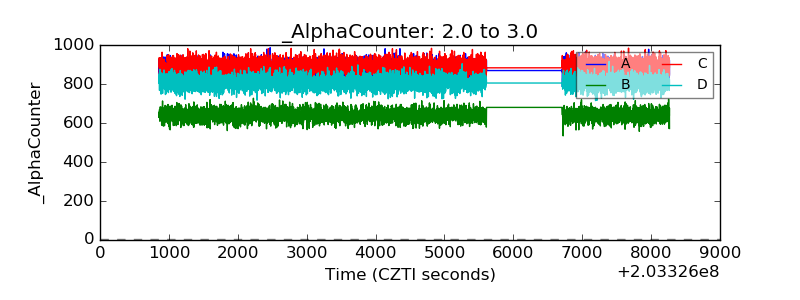 |
| _CPM_Rate | 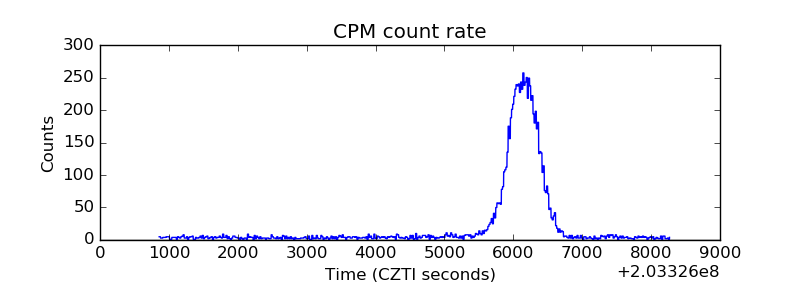 |
| CZT Counter | 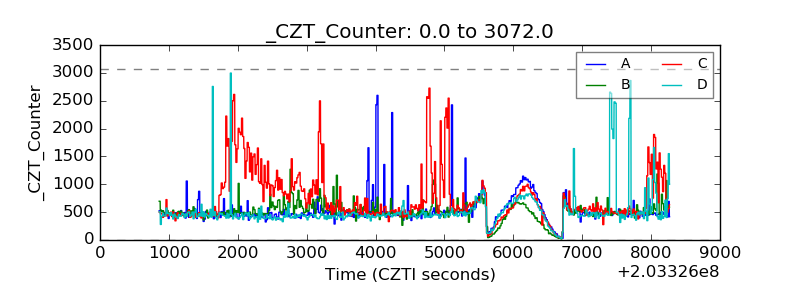 |
| +2.5 Volts monitor |  |
| +5 Volts monitor |  |
| Veto Counter | 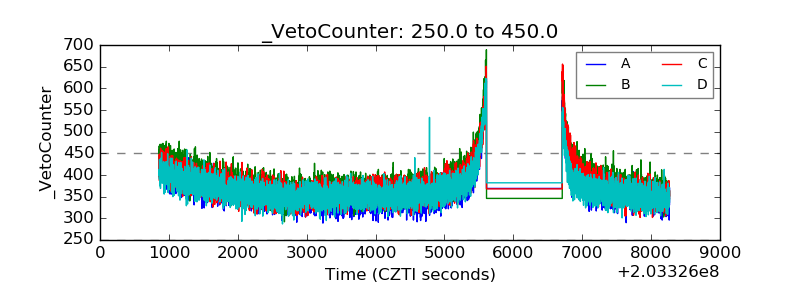 |