| Param | Original file | Final file |
|---|---|---|
| Filename | modeM0/AS1G05_194T01_9000000490_03809cztM0_level2.evt | modeM0/AS1G05_194T01_9000000490_03809cztM0_level2_quad_clean.evt |
| Size (bytes) | 607,268,160 | 63,921,600 |
| Size | 579.1 MB | 61.0 MB |
| Events in quadrant A | 3,660,371 | 373,417 |
| Events in quadrant B | 4,002,897 | 370,258 |
| Events in quadrant C | 5,572,204 | 354,482 |
| Events in quadrant D | 4,679,379 | 346,934 |
| Mode SS | |||
|---|---|---|---|
| Quadrant | BADHDUFLAG | Total packets | Discarded packets |
| A | 0 | 142 | 0 |
| B | 0 | 142 | 0 |
| C | 0 | 142 | 0 |
| D | 0 | 142 | 0 |
| Mode M9 | |||
|---|---|---|---|
| Quadrant | BADHDUFLAG | Total packets | Discarded packets |
| A | 0 | 11 | 0 |
| B | 0 | 11 | 0 |
| C | 0 | 11 | 0 |
| D | 0 | 12 | 0 |
| Mode M0 | |||
|---|---|---|---|
| Quadrant | BADHDUFLAG | Total packets | Discarded packets |
| A | 0 | 15386 | 3 |
| B | 0 | 16136 | 2 |
| C | 0 | 21442 | 2 |
| D | 0 | 18788 | 2 |
| Quadrant | Total seconds | Saturated seconds | Saturation percentage |
|---|---|---|---|
| A | 7039 | 117 | 1.662168% |
| B | 7039 | 124 | 1.761614% |
| C | 7039 | 249 | 3.537434% |
| D | 7039 | 455 | 6.463986% |
Noise dominated data is calculated using 1-second bins in cleaned event files. If a bin has >2000 counts, and if more than 50% of those come from <1% of pixels, then it is considered to be noise-dominated and hence unusable.
| Quadrant | # 1 sec bins | Bins with >0 counts | Bins with >2000 counts | High rate bins dominated by noise | Noise dominated (total time) | Noise dominated (detector-on time) | Marked lightcurve |
|---|---|---|---|---|---|---|---|
| A | 7829 | 7039 | 2 | 2 | 0.03% | 0.03% | 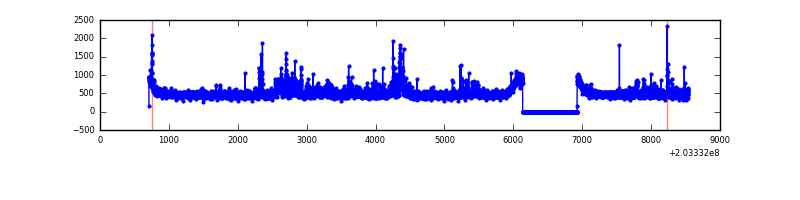 |
| B | 7829 | 7039 | 10 | 10 | 0.13% | 0.14% | 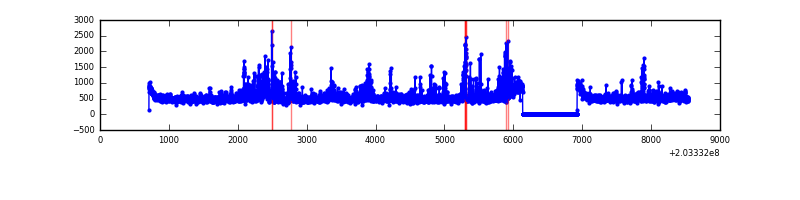 |
| C | 7829 | 7039 | 132 | 132 | 1.69% | 1.88% | 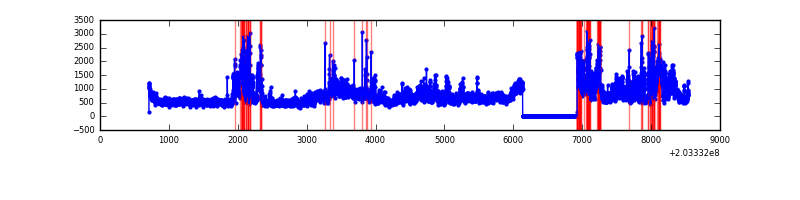 |
| D | 7829 | 7039 | 340 | 340 | 4.34% | 4.83% | 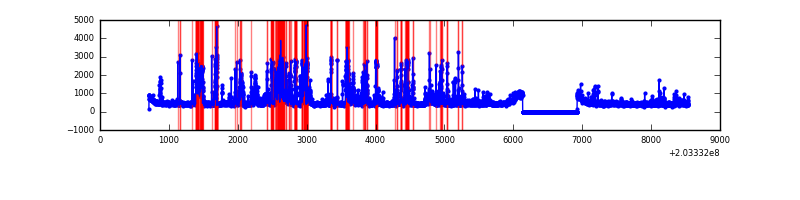 |
Top three noisy pixels from each quadrant. If the there are fewer than three noisy pixels in the level2.evt file, extra rows are filled as -1
| Pixel properties | Quadrant properties | ||||||
|---|---|---|---|---|---|---|---|
| Quadrant | DetID | PixID | Counts | Sigma | Mean | Median | Sigma |
| A | 13 | 251 | 290391 | 1659.14 | 851 | 834 | 174.5 |
| A | 0 | 50 | 47324 | 266.38 | 851 | 834 | 174.5 |
| A | 0 | 118 | 29767 | 165.78 | 851 | 834 | 174.5 |
| B | 14 | 167 | 421253 | 2498.93 | 855 | 833 | 168.2 |
| B | 0 | 173 | 119040 | 702.61 | 855 | 833 | 168.2 |
| B | 15 | 204 | 106644 | 628.93 | 855 | 833 | 168.2 |
| C | 2 | 53 | 2376653 | 12605.52 | 804 | 805 | 188.5 |
| C | 9 | 247 | 40150 | 208.75 | 804 | 805 | 188.5 |
| C | 7 | 254 | 10801 | 53.04 | 804 | 805 | 188.5 |
| D | 2 | 32 | 1486431 | 7594.89 | 797 | 773 | 195.6 |
| D | 13 | 223 | 55686 | 280.72 | 797 | 773 | 195.6 |
| D | 13 | 239 | 42334 | 212.47 | 797 | 773 | 195.6 |
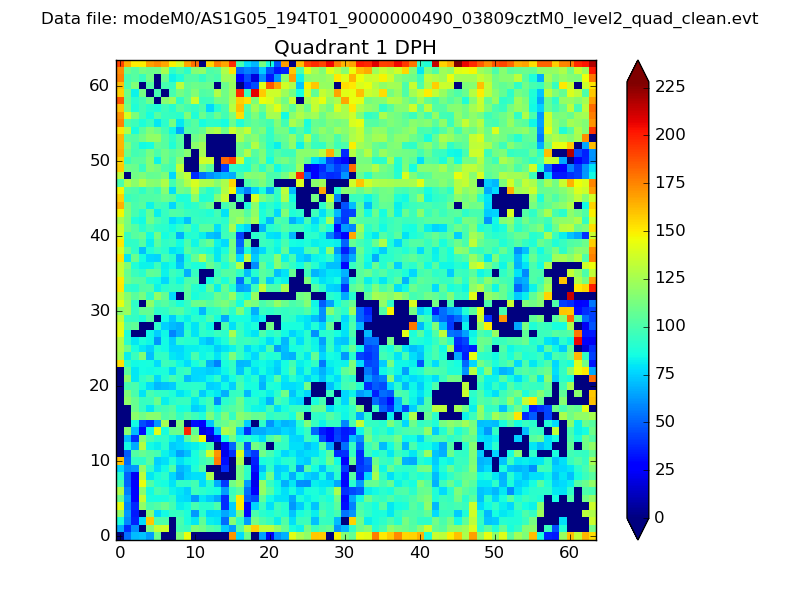
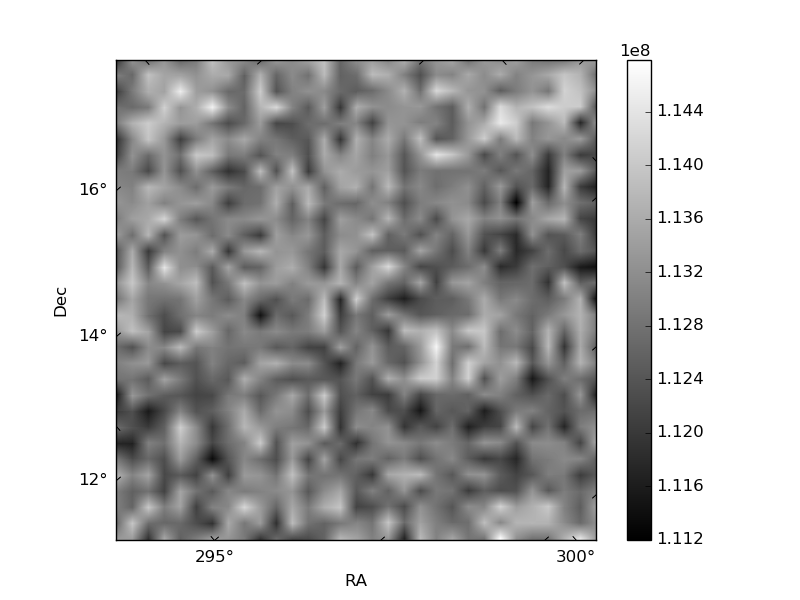
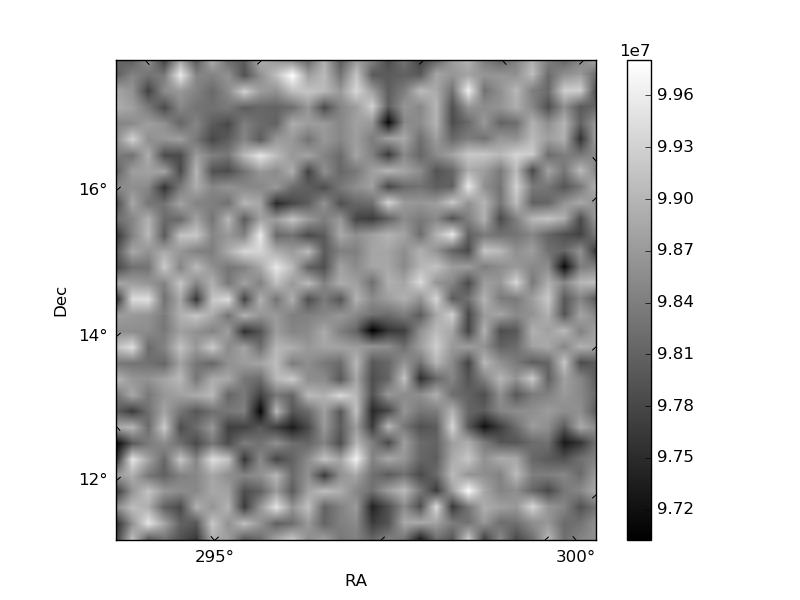
Histogram calculated using DETX and DETY for each event in the final _common_clean file
| Quadrant A |  |
 |
Quadrant B |
|---|---|---|---|
| Quadrant D | 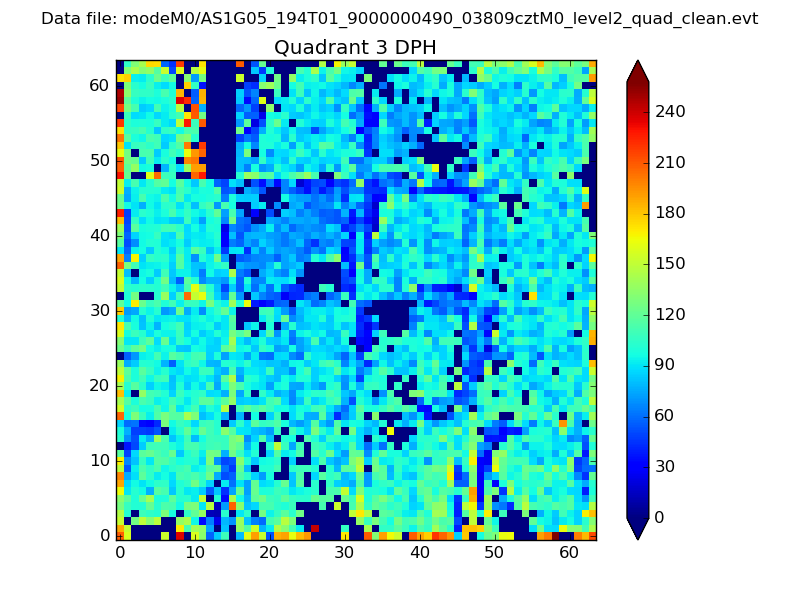 |
 |
Quadrant C |
| Plot type | Count rate plots | Images |
|---|---|---|
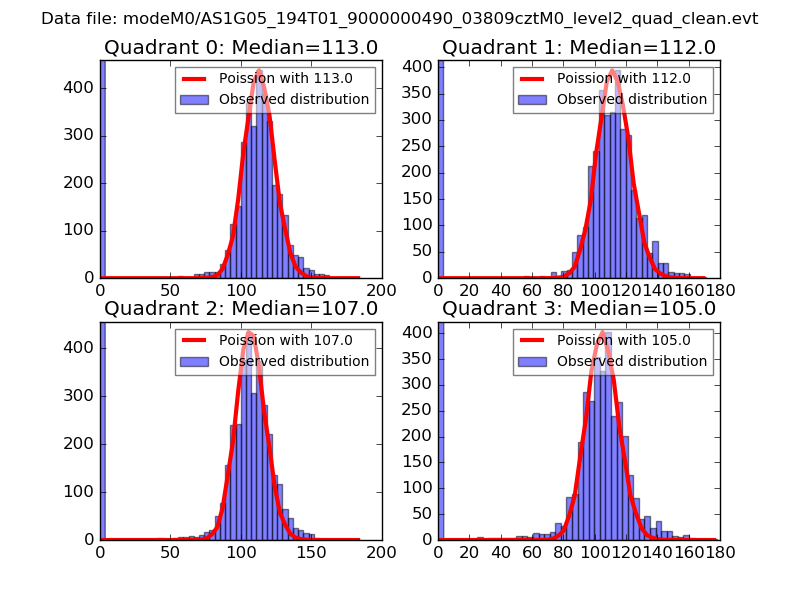
| Comparison with Poisson distribution Blue bars denote a histogram of data divided into 1 sec bins. Red curve is a Poisson curve with rate = median count rate of data. |
 |
 |
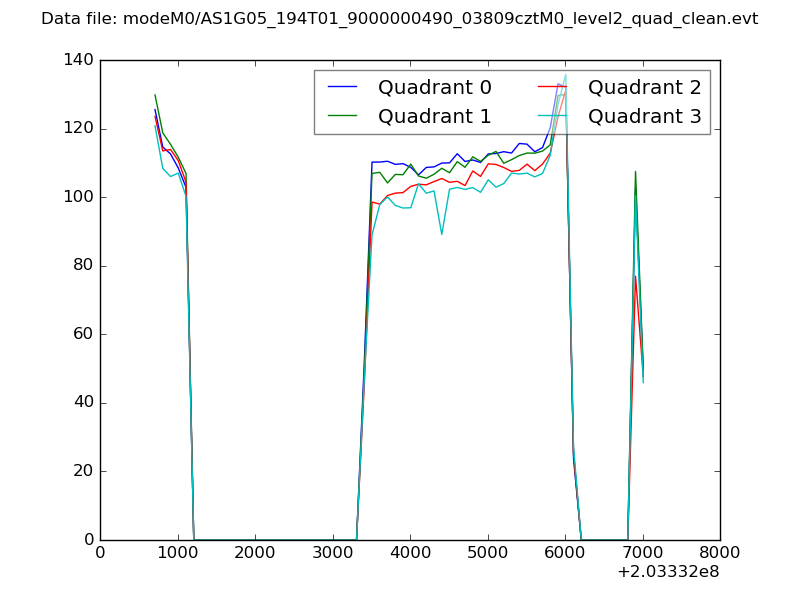
| Quadrant-wise count rates Data is divided into 100 sec bins |
 |
|
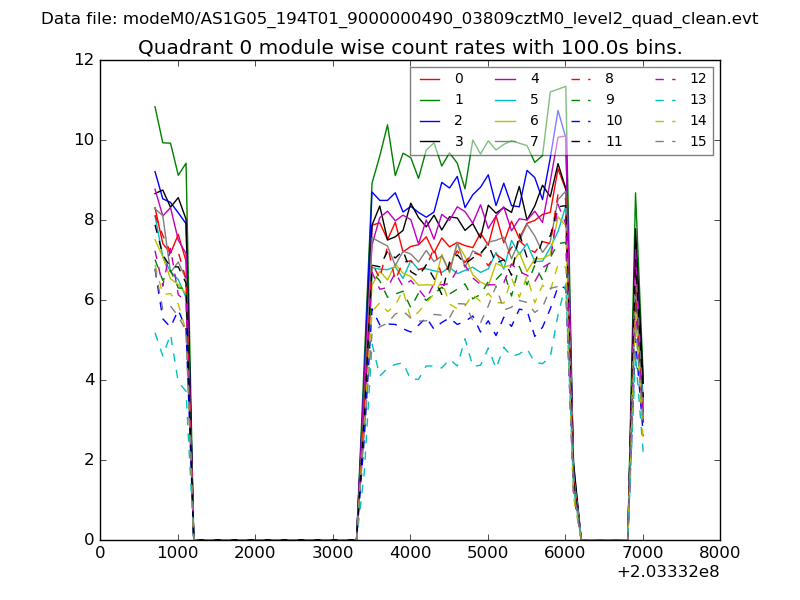
| Module-wise count rates for Quadrant A Data is divided into 100 sec bins |
 |
 |
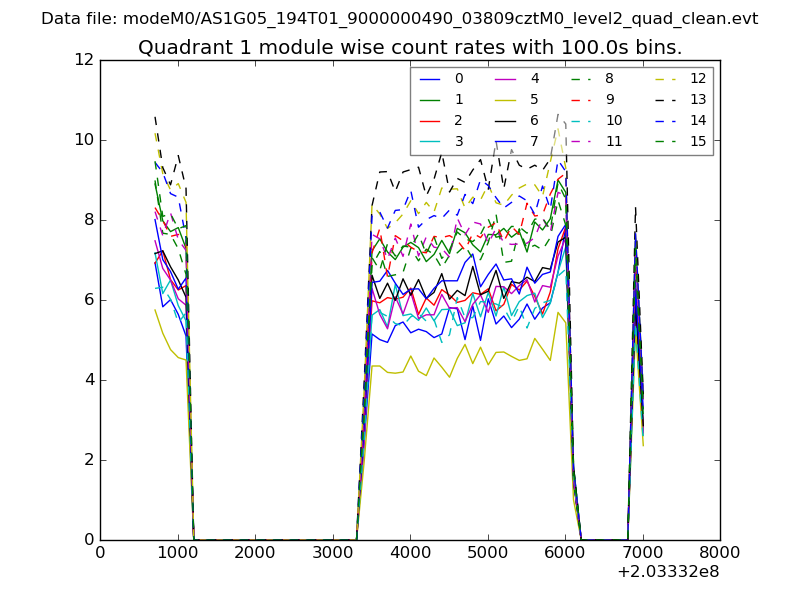
| Module-wise count rates for Quadrant B Data is divided into 100 sec bins |
 |
 |
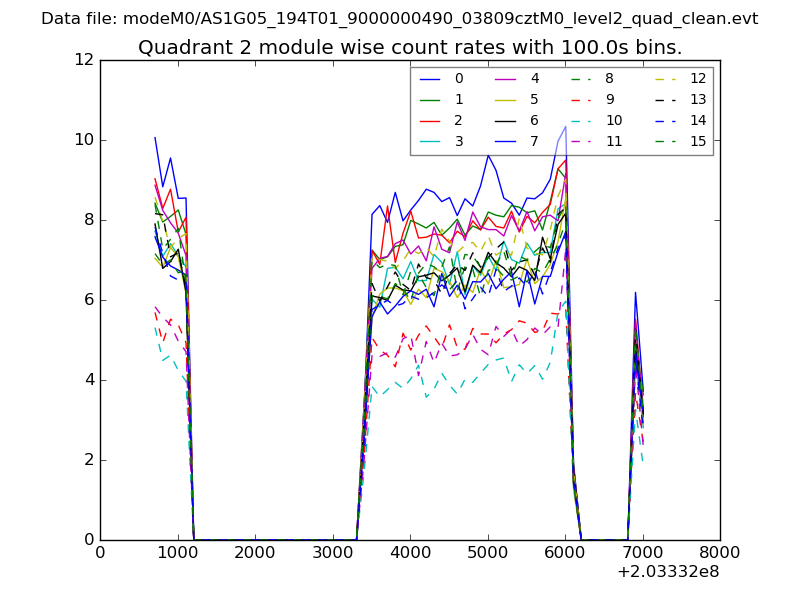
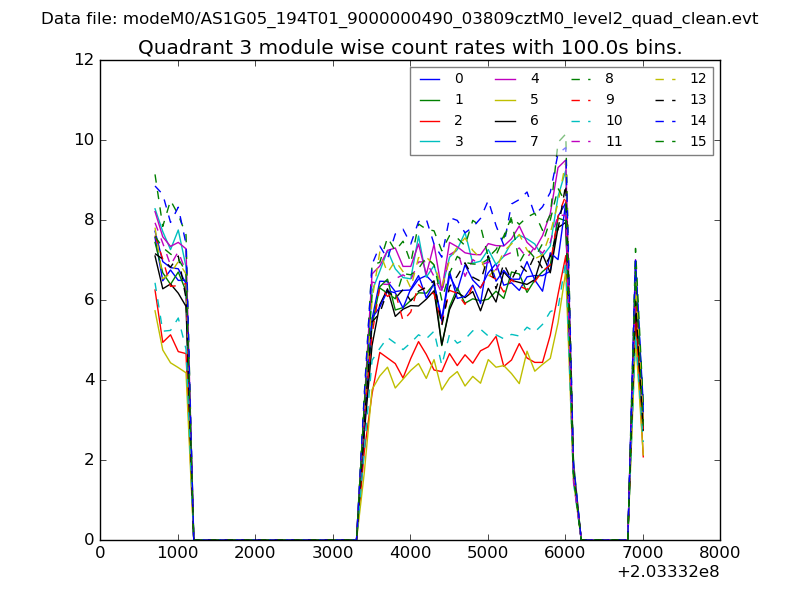
| Module-wise count rates for Quadrant C Data is divided into 100 sec bins |
 |
 |
| Module-wise count rates for Quadrant D Data is divided into 100 sec bins |
 |
 |
| Parameter | Plot |
|---|---|
| CZT HV Monitor | 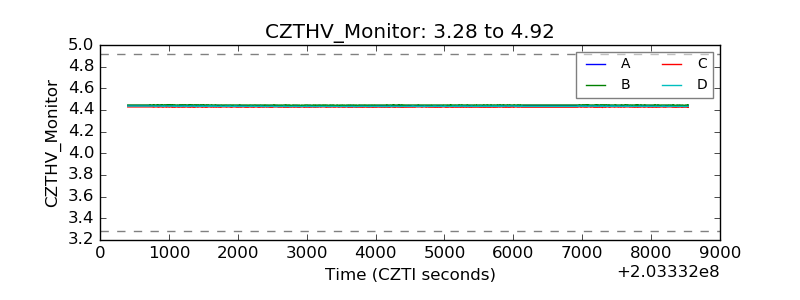 |
| D_VDD | 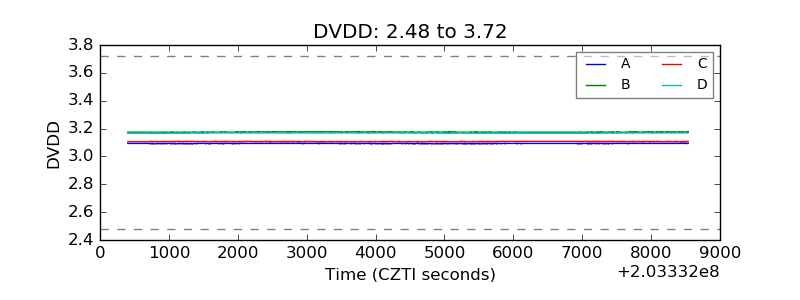 |
| Temperature 1 | 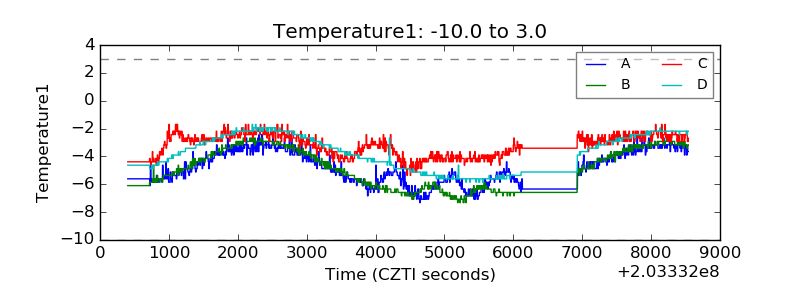 |
| Veto HV Monitor | 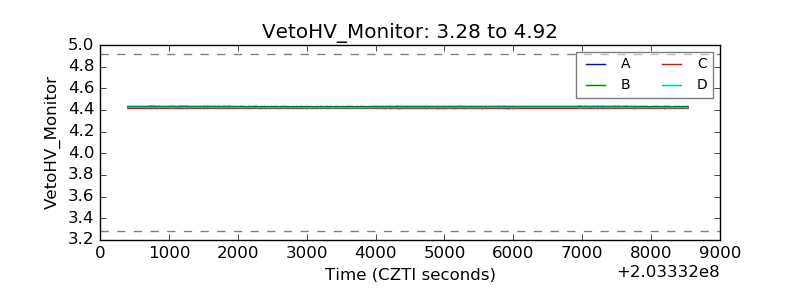 |
| Veto LLD | 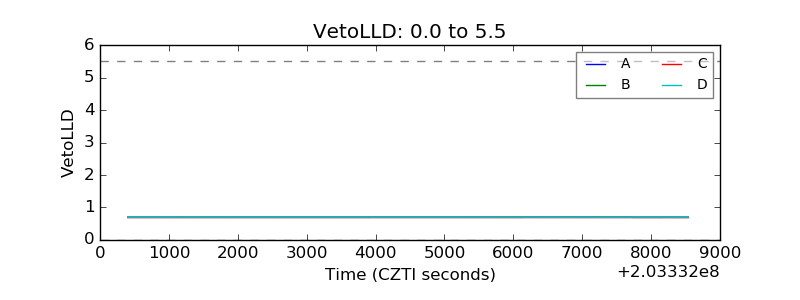 |
| Alpha Counter | 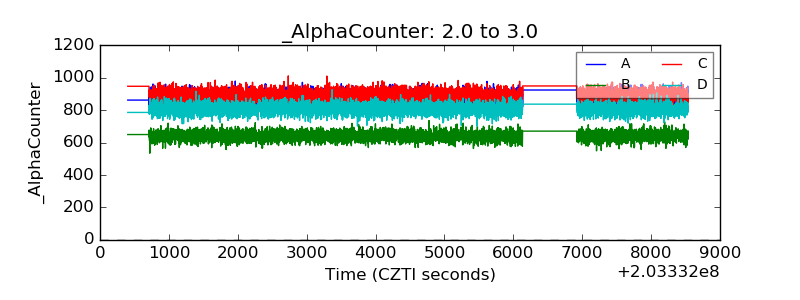 |
| _CPM_Rate | 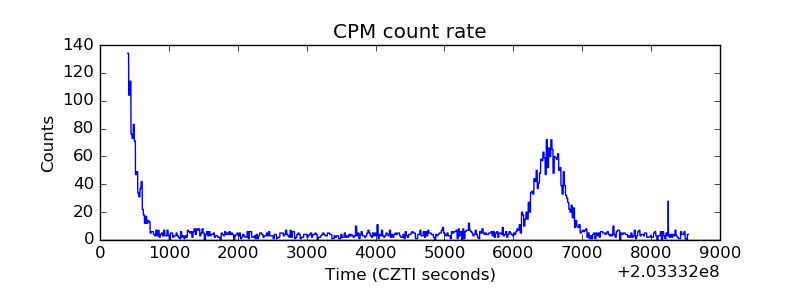 |
| CZT Counter | 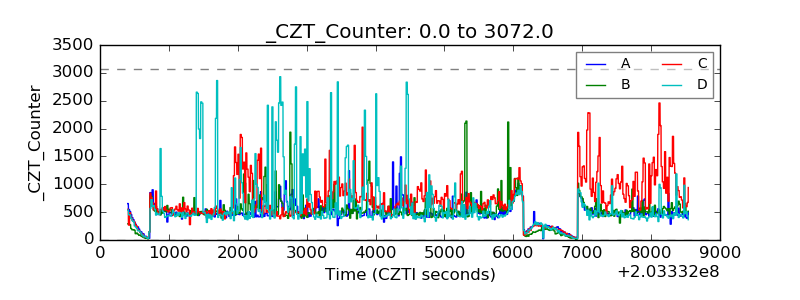 |
| +2.5 Volts monitor |  |
| +5 Volts monitor | 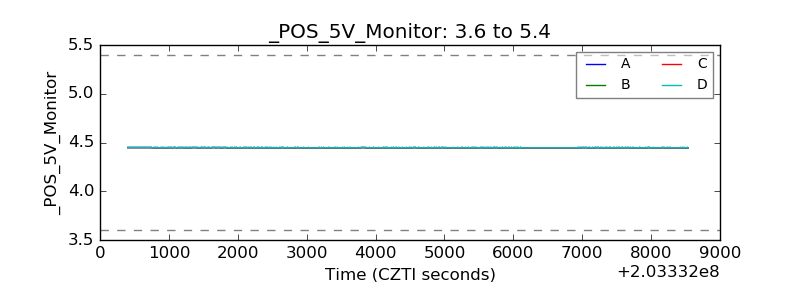 |
| Veto Counter | 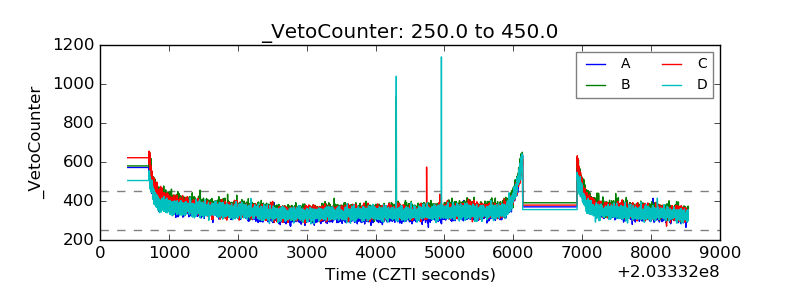 |