| Param | Original file | Final file |
|---|---|---|
| Filename | modeM0/AS1SLEW_01234_9000000489_03798cztM0_level2.evt | modeM0/AS1SLEW_01234_9000000489_03798cztM0_level2_quad_clean.evt |
| Size (bytes) | 75,251,520 | 15,958,080 |
| Size | 71.8 MB | 15.2 MB |
| Events in quadrant A | 748,668 | 99,730 |
| Events in quadrant B | 528,197 | 100,789 |
| Events in quadrant C | 397,892 | 102,386 |
| Events in quadrant D | 529,869 | 99,604 |
| Mode M0 | |||
|---|---|---|---|
| Quadrant | BADHDUFLAG | Total packets | Discarded packets |
| A | 0 | 2920 | 0 |
| B | 0 | 2311 | 2 |
| C | 0 | 2099 | 0 |
| D | 0 | 2422 | 0 |
| Mode SS | |||
|---|---|---|---|
| Quadrant | BADHDUFLAG | Total packets | Discarded packets |
| A | 0 | 20 | 0 |
| B | 0 | 20 | 0 |
| C | 0 | 20 | 0 |
| D | 0 | 20 | 0 |
| Quadrant | Total seconds | Saturated seconds | Saturation percentage |
|---|---|---|---|
| A | 1049 | 19 | 1.811249% |
| B | 1048 | 4 | 0.381679% |
| C | 1049 | 0 | 0.000000% |
| D | 1049 | 4 | 0.381316% |
Noise dominated data is calculated using 1-second bins in cleaned event files. If a bin has >2000 counts, and if more than 50% of those come from <1% of pixels, then it is considered to be noise-dominated and hence unusable.
| Quadrant | # 1 sec bins | Bins with >0 counts | Bins with >2000 counts | High rate bins dominated by noise | Noise dominated (total time) | Noise dominated (detector-on time) | Marked lightcurve |
|---|---|---|---|---|---|---|---|
| A | 1049 | 1049 | 16 | 16 | 1.53% | 1.53% | 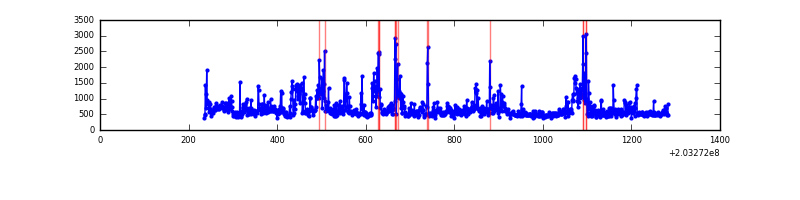 |
| B | 1049 | 1049 | 6 | 6 | 0.57% | 0.57% | 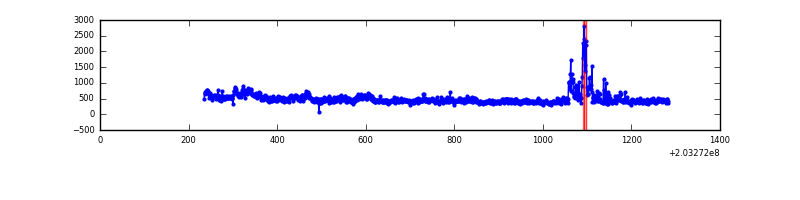 |
| C | 1049 | 1049 | 0 | 0 | 0.00% | 0.00% | 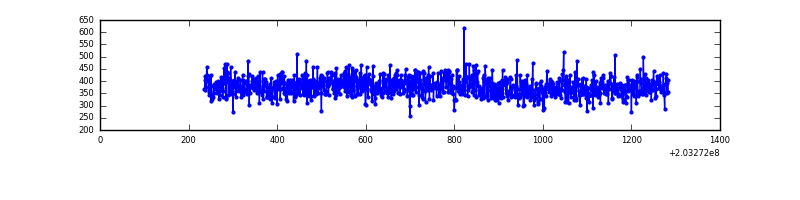 |
| D | 1049 | 1049 | 5 | 5 | 0.48% | 0.48% | 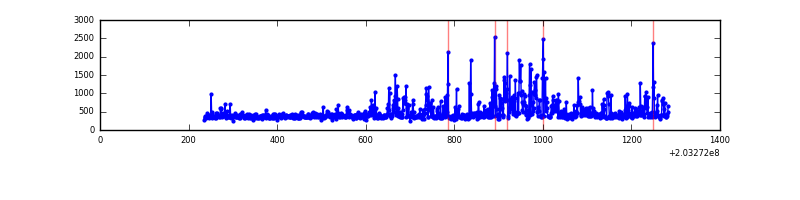 |
Top three noisy pixels from each quadrant. If the there are fewer than three noisy pixels in the level2.evt file, extra rows are filled as -1
| Pixel properties | Quadrant properties | ||||||
|---|---|---|---|---|---|---|---|
| Quadrant | DetID | PixID | Counts | Sigma | Mean | Median | Sigma |
| A | 13 | 251 | 266004 | 11375.15 | 101 | 98 | 23.4 |
| A | 0 | 118 | 52198 | 2228.78 | 101 | 98 | 23.4 |
| A | 0 | 50 | 31703 | 1352.03 | 101 | 98 | 23.4 |
| B | 14 | 167 | 89992 | 3930.07 | 105 | 102 | 22.9 |
| B | 15 | 204 | 30826 | 1343.28 | 105 | 102 | 22.9 |
| B | 12 | 111 | 1450 | 58.94 | 105 | 102 | 22.9 |
| C | 10 | 65 | 809 | 27.69 | 101 | 101 | 25.5 |
| C | 13 | 61 | 800 | 27.34 | 101 | 101 | 25.5 |
| C | 7 | 247 | 552 | 17.63 | 101 | 101 | 25.5 |
| D | 2 | 63 | 88774 | 3373.85 | 99 | 96 | 26.3 |
| D | 13 | 239 | 36369 | 1380.05 | 99 | 96 | 26.3 |
| D | 8 | 112 | 10443 | 393.66 | 99 | 96 | 26.3 |
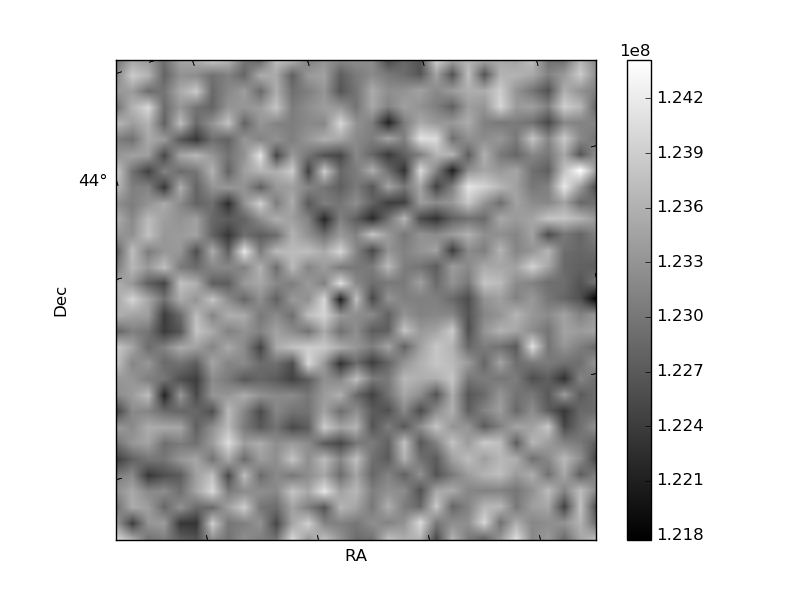
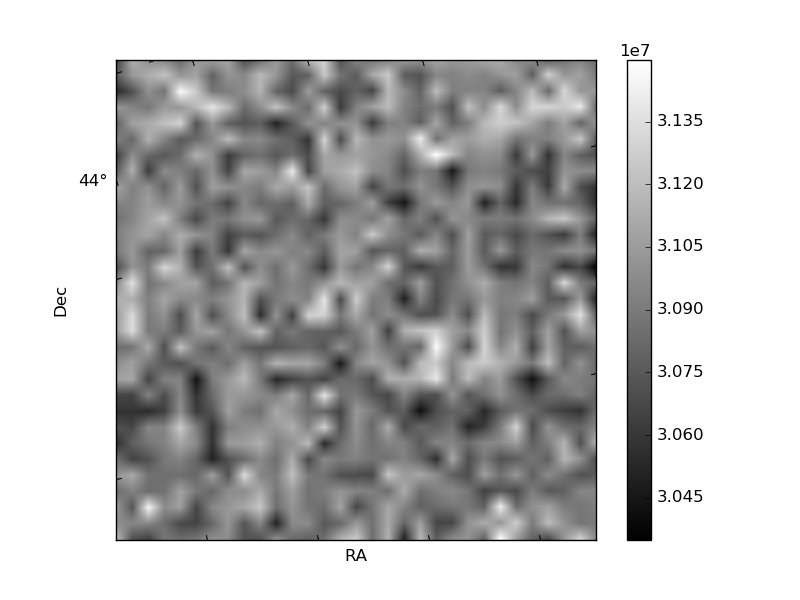
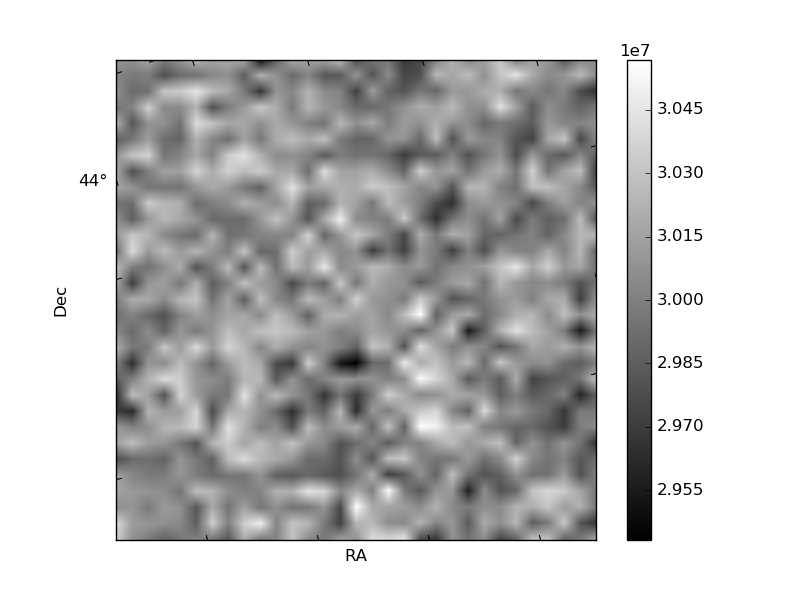
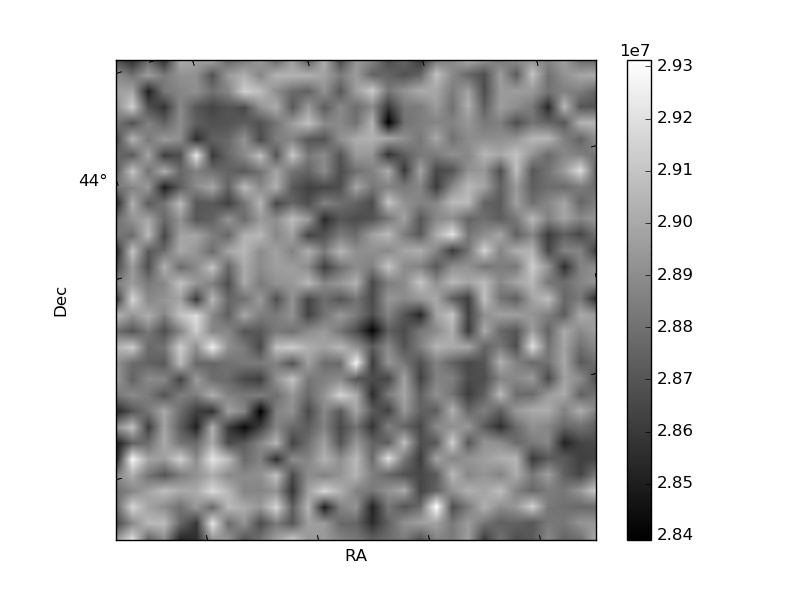
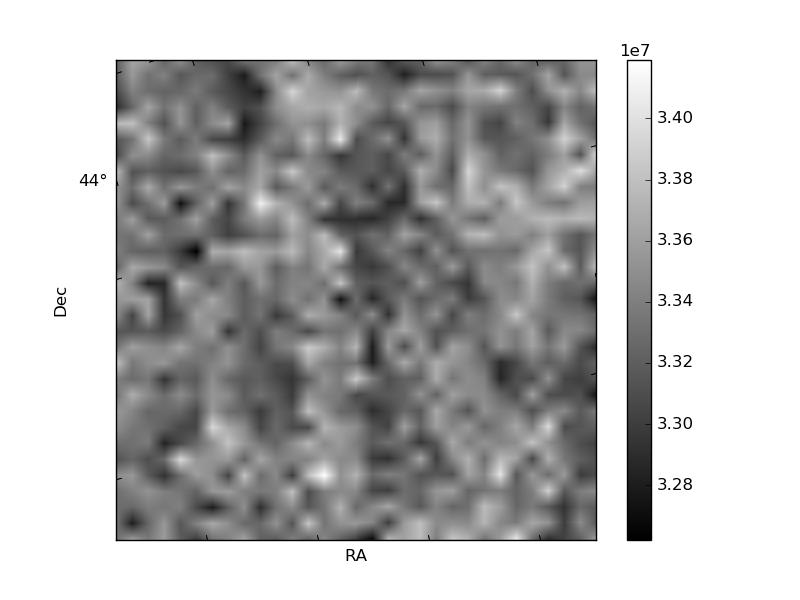
Histogram calculated using DETX and DETY for each event in the final _common_clean file
| Quadrant A | 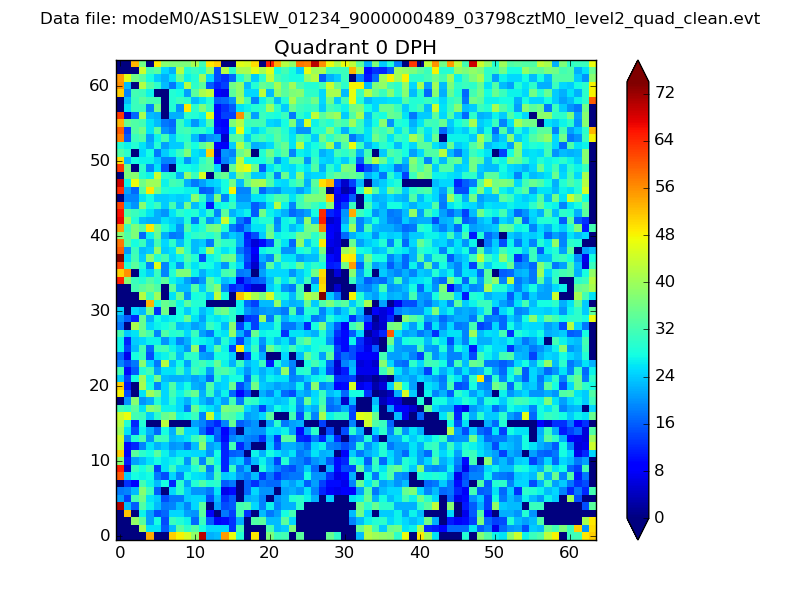 |
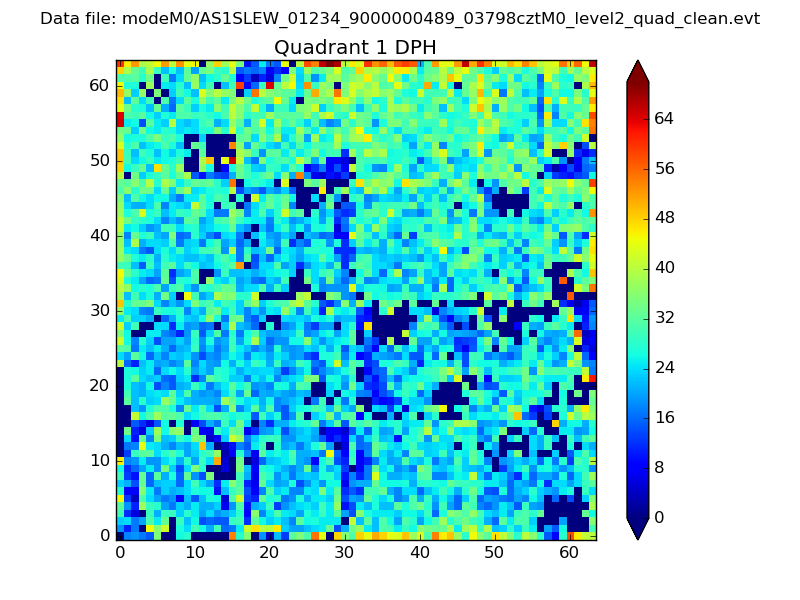 |
Quadrant B |
|---|---|---|---|
| Quadrant D | 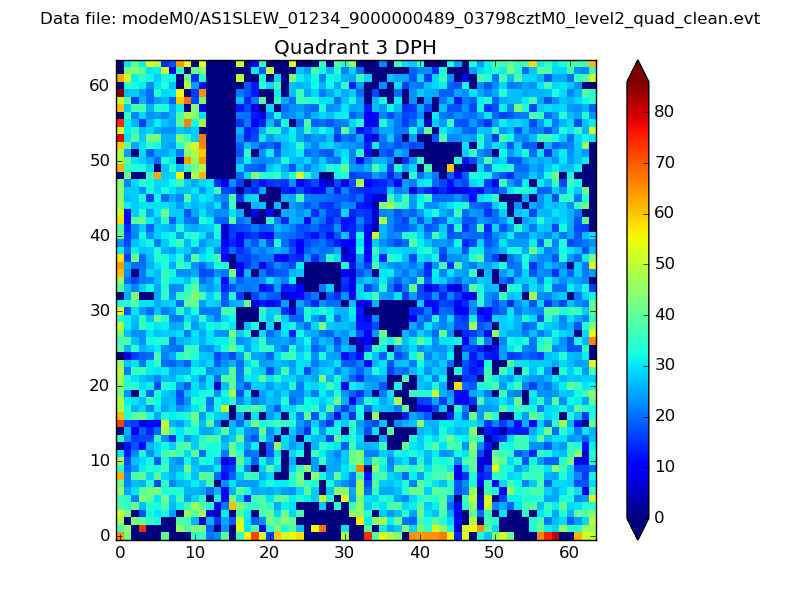 |
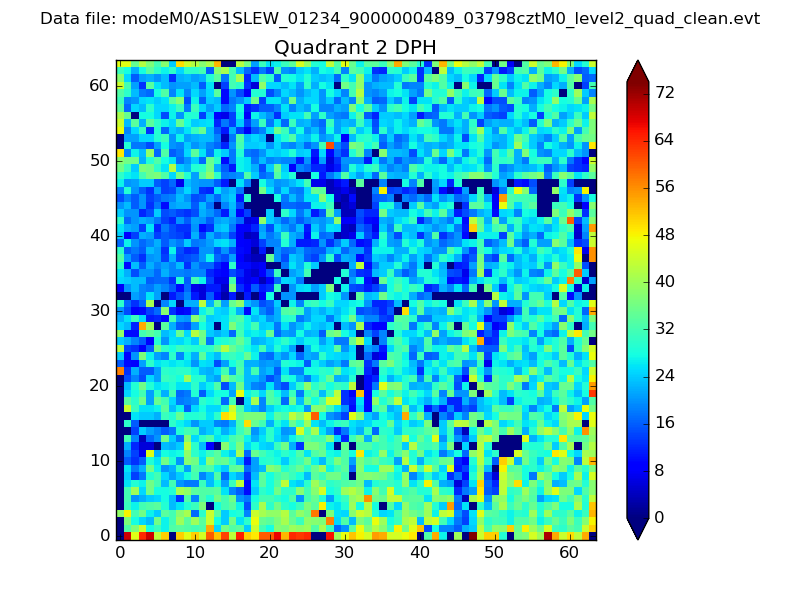 |
Quadrant C |
| Plot type | Count rate plots | Images |
|---|---|---|
| Comparison with Poisson distribution Blue bars denote a histogram of data divided into 1 sec bins. Red curve is a Poisson curve with rate = median count rate of data. |
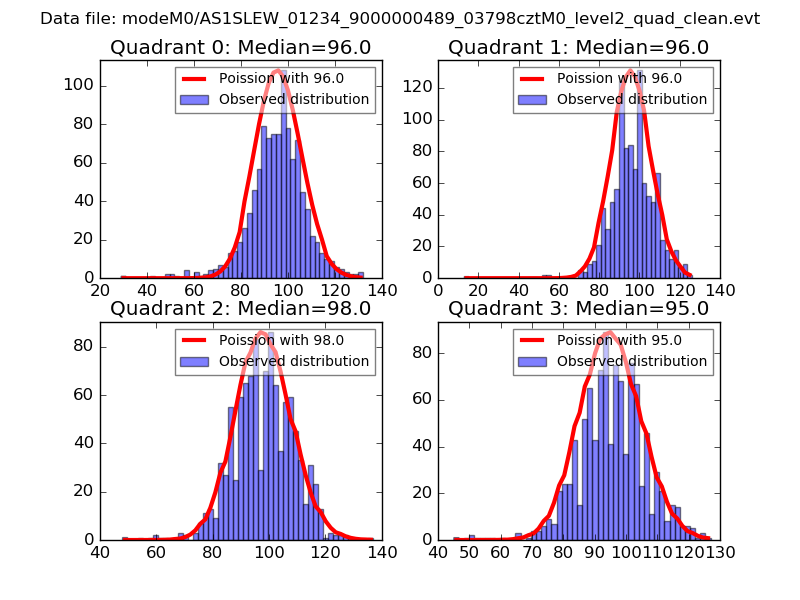 |
 |
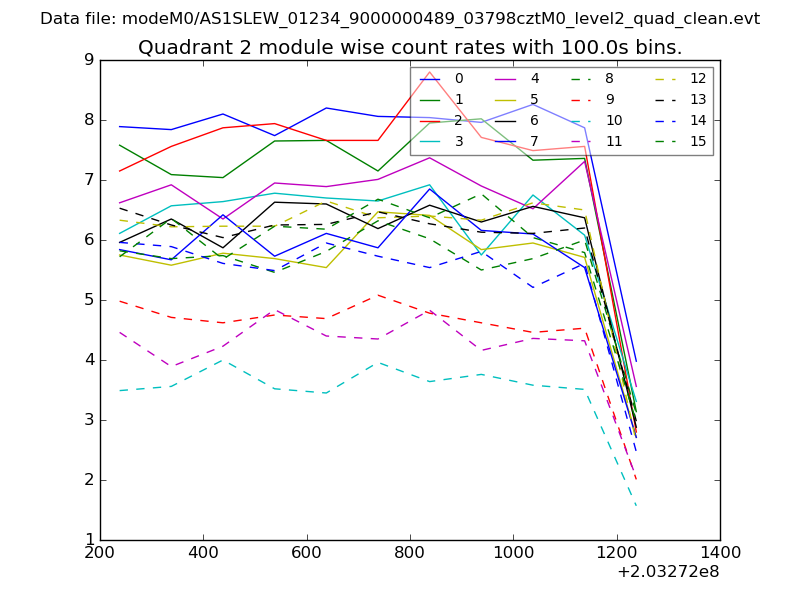
| Quadrant-wise count rates Data is divided into 100 sec bins |
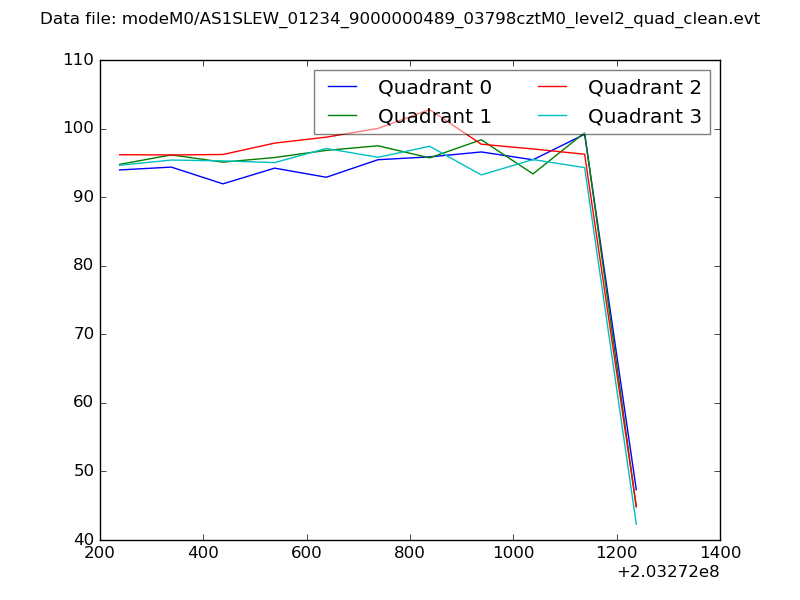 |
|
| Module-wise count rates for Quadrant A Data is divided into 100 sec bins |
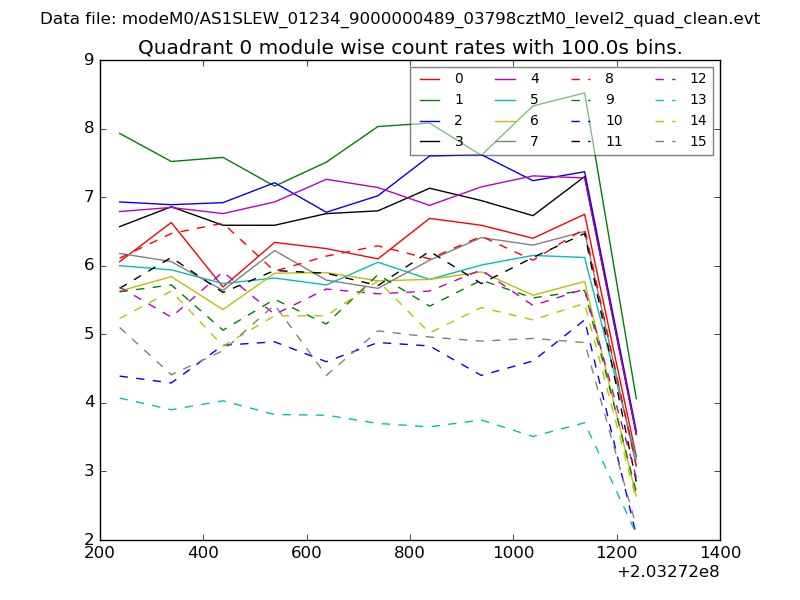 |
 |
| Module-wise count rates for Quadrant B Data is divided into 100 sec bins |
 |
 |
| Module-wise count rates for Quadrant C Data is divided into 100 sec bins |
 |
 |
| Module-wise count rates for Quadrant D Data is divided into 100 sec bins |
 |
 |
| Parameter | Plot |
|---|---|
| CZT HV Monitor | 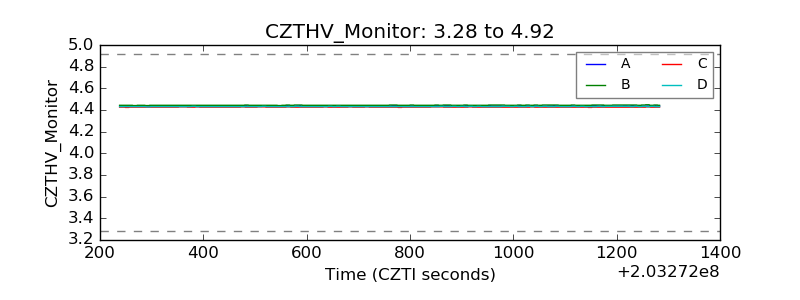 |
| D_VDD | 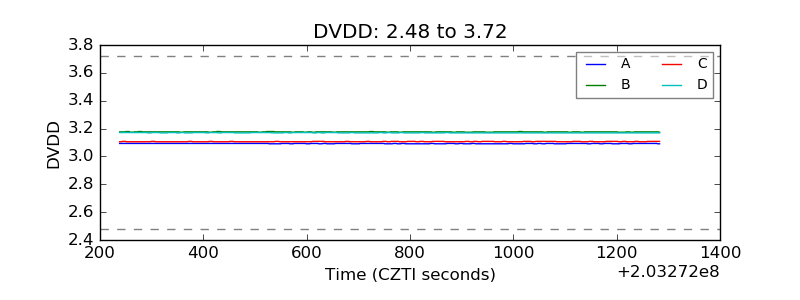 |
| Temperature 1 | 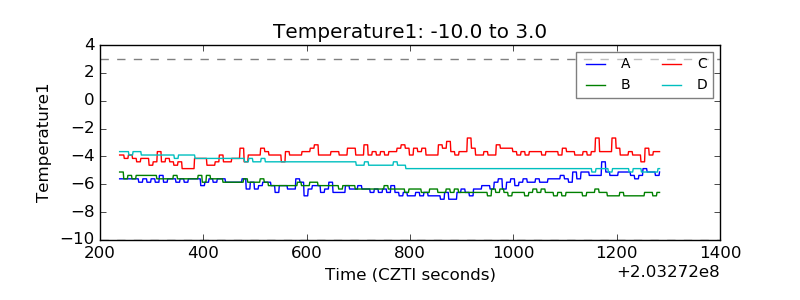 |
| Veto HV Monitor | 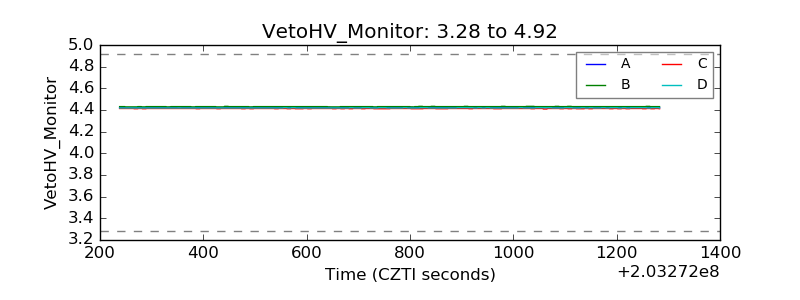 |
| Veto LLD | 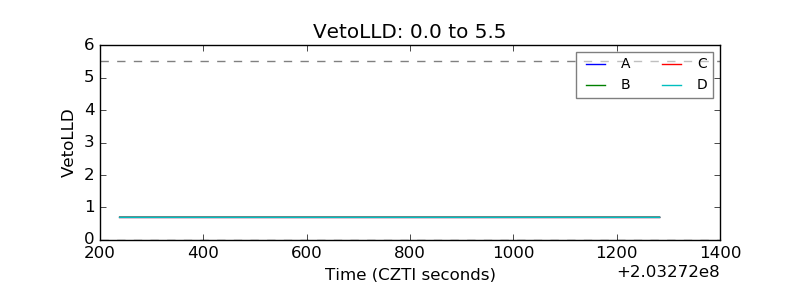 |
| Alpha Counter |  |
| _CPM_Rate | 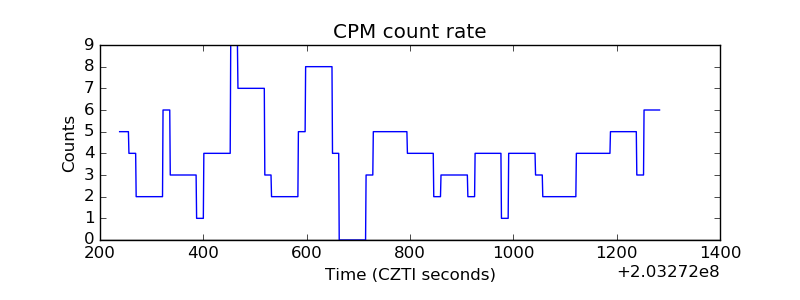 |
| CZT Counter | 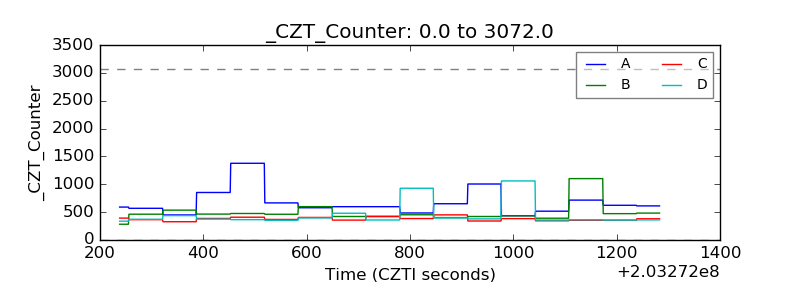 |
| +2.5 Volts monitor |  |
| +5 Volts monitor |  |
| Veto Counter | 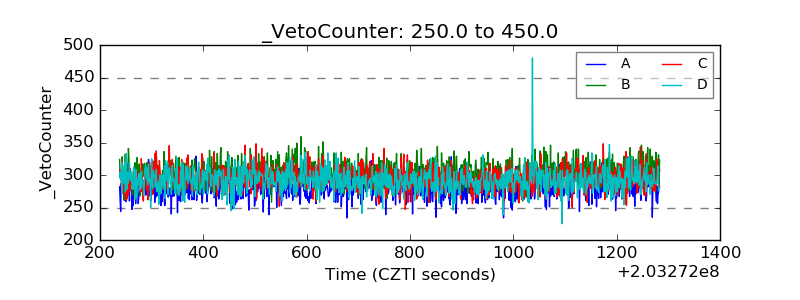 |