| Param | Original file | Final file |
|---|---|---|
| Filename | modeM0/AS1G05_189T01_9000000492_03816cztM0_level2.evt | modeM0/AS1G05_189T01_9000000492_03816cztM0_level2_quad_clean.evt |
| Size (bytes) | 380,992,320 | 64,987,200 |
| Size | 363.3 MB | 62.0 MB |
| Events in quadrant A | 2,857,160 | 394,268 |
| Events in quadrant B | 2,847,236 | 395,391 |
| Events in quadrant C | 2,626,127 | 388,649 |
| Events in quadrant D | 2,803,179 | 374,214 |
| Mode M0 | |||
|---|---|---|---|
| Quadrant | BADHDUFLAG | Total packets | Discarded packets |
| A | 0 | 12792 | 2 |
| B | 0 | 12523 | 1 |
| C | 0 | 12181 | 1 |
| D | 0 | 12970 | 1 |
| Mode M9 | |||
|---|---|---|---|
| Quadrant | BADHDUFLAG | Total packets | Discarded packets |
| A | 0 | 10 | 0 |
| B | 0 | 10 | 0 |
| C | 0 | 10 | 0 |
| D | 0 | 10 | 0 |
| Mode SS | |||
|---|---|---|---|
| Quadrant | BADHDUFLAG | Total packets | Discarded packets |
| A | 0 | 120 | 0 |
| B | 0 | 120 | 0 |
| C | 0 | 120 | 0 |
| D | 0 | 120 | 0 |
| Quadrant | Total seconds | Saturated seconds | Saturation percentage |
|---|---|---|---|
| A | 5945 | 51 | 0.857864% |
| B | 5945 | 47 | 0.790580% |
| C | 5945 | 34 | 0.571909% |
| D | 5945 | 88 | 1.480235% |
Noise dominated data is calculated using 1-second bins in cleaned event files. If a bin has >2000 counts, and if more than 50% of those come from <1% of pixels, then it is considered to be noise-dominated and hence unusable.
| Quadrant | # 1 sec bins | Bins with >0 counts | Bins with >2000 counts | High rate bins dominated by noise | Noise dominated (total time) | Noise dominated (detector-on time) | Marked lightcurve |
|---|---|---|---|---|---|---|---|
| A | 6944 | 5944 | 3 | 3 | 0.04% | 0.05% | 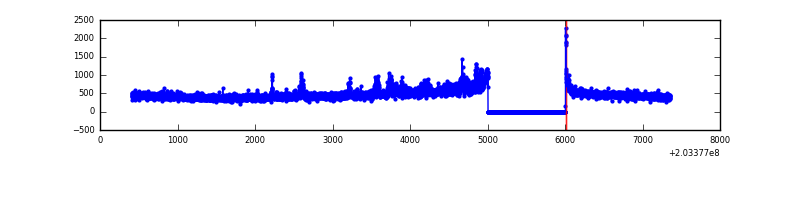 |
| B | 6945 | 5945 | 0 | 0 | 0.00% | 0.00% | 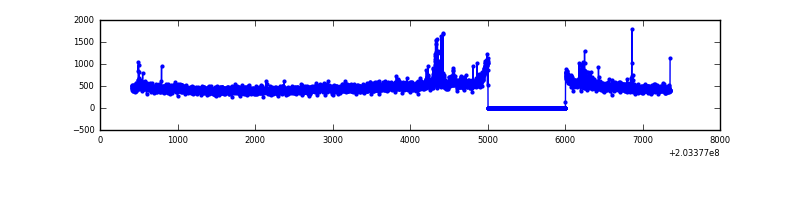 |
| C | 6945 | 5945 | 5 | 5 | 0.07% | 0.08% | 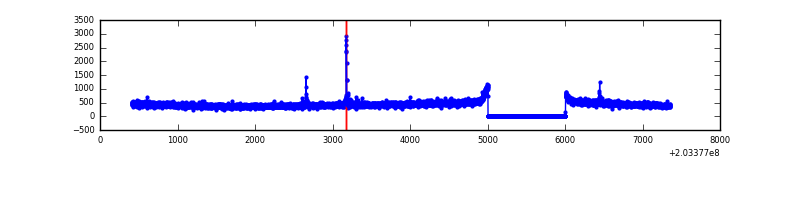 |
| D | 6945 | 5945 | 64 | 64 | 0.92% | 1.08% | 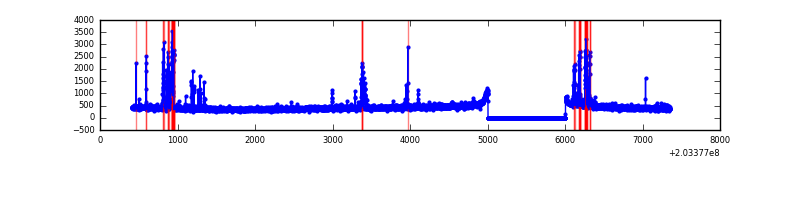 |
Top three noisy pixels from each quadrant. If the there are fewer than three noisy pixels in the level2.evt file, extra rows are filled as -1
| Pixel properties | Quadrant properties | ||||||
|---|---|---|---|---|---|---|---|
| Quadrant | DetID | PixID | Counts | Sigma | Mean | Median | Sigma |
| A | 13 | 251 | 199345 | 1426.9 | 680 | 666 | 139.2 |
| A | 8 | 15 | 21024 | 146.21 | 680 | 666 | 139.2 |
| A | 0 | 199 | 11056 | 74.62 | 680 | 666 | 139.2 |
| B | 15 | 204 | 92134 | 680.99 | 689 | 672 | 134.3 |
| B | 14 | 167 | 56171 | 413.23 | 689 | 672 | 134.3 |
| B | 0 | 173 | 30894 | 225.02 | 689 | 672 | 134.3 |
| C | 12 | 4 | 20154 | 125.75 | 660 | 662 | 155.0 |
| C | 8 | 208 | 11824 | 72.01 | 660 | 662 | 155.0 |
| C | 1 | 16 | 10175 | 61.37 | 660 | 662 | 155.0 |
| D | 13 | 223 | 276022 | 1725.95 | 654 | 635 | 159.6 |
| D | 10 | 85 | 17576 | 106.18 | 654 | 635 | 159.6 |
| D | 2 | 14 | 12311 | 73.18 | 654 | 635 | 159.6 |
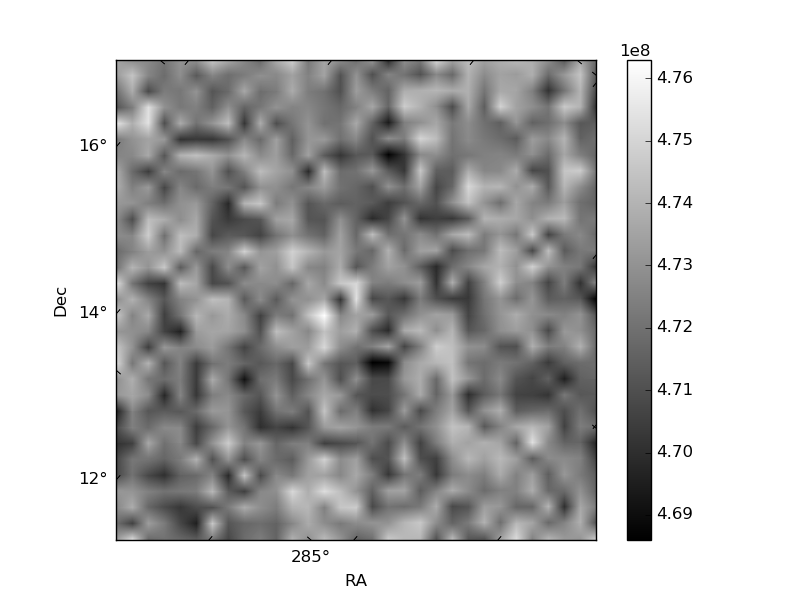
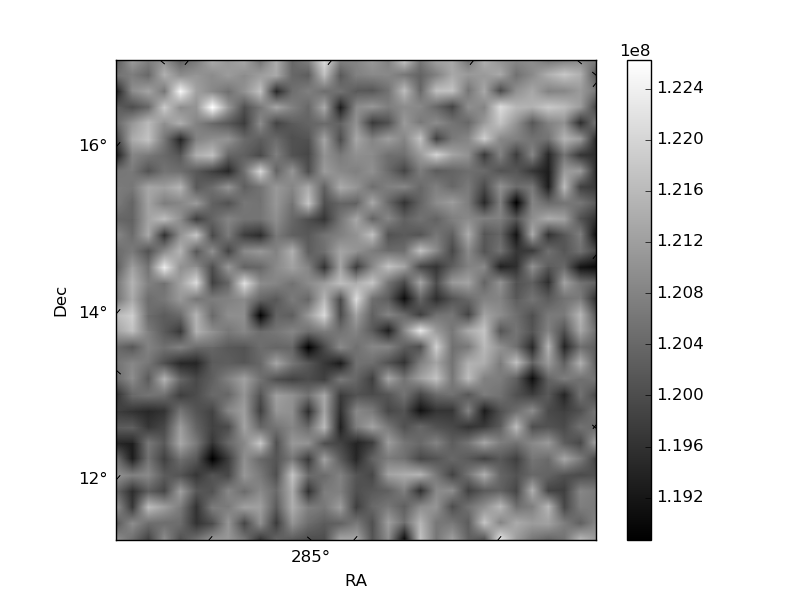
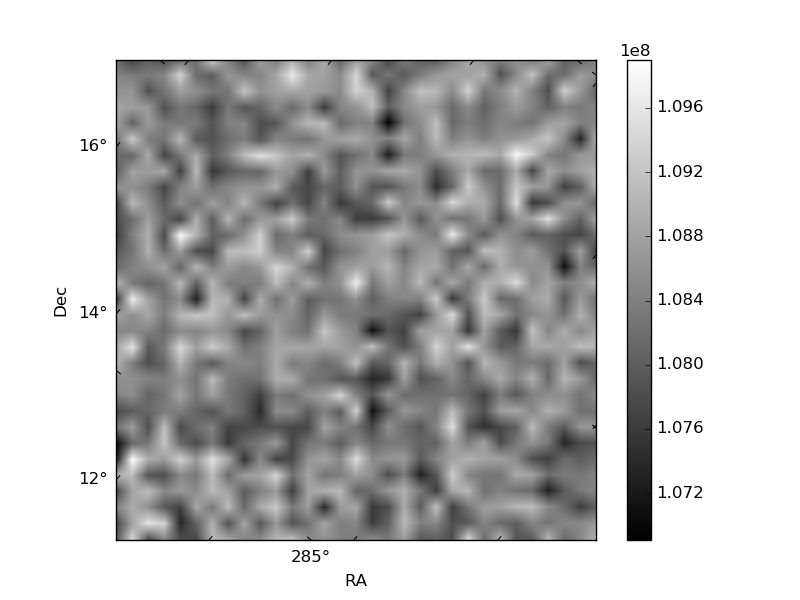
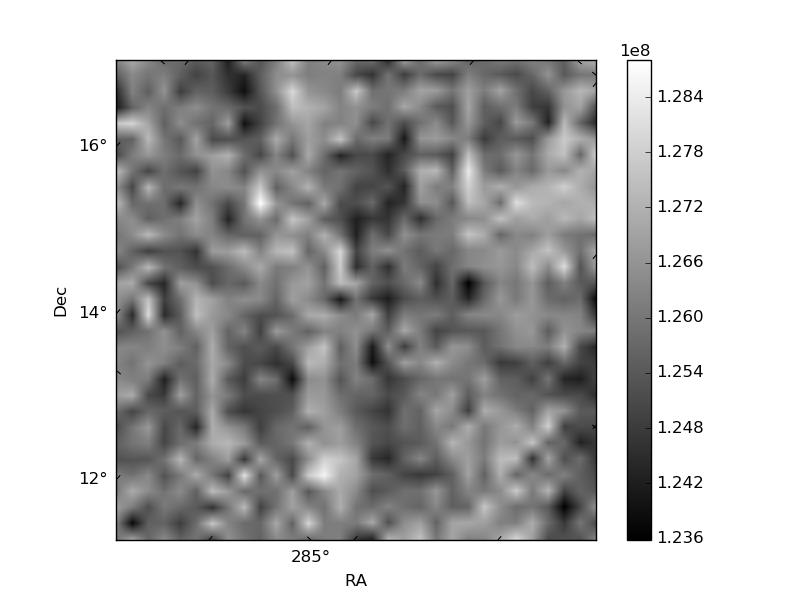
Histogram calculated using DETX and DETY for each event in the final _common_clean file
| Quadrant A | 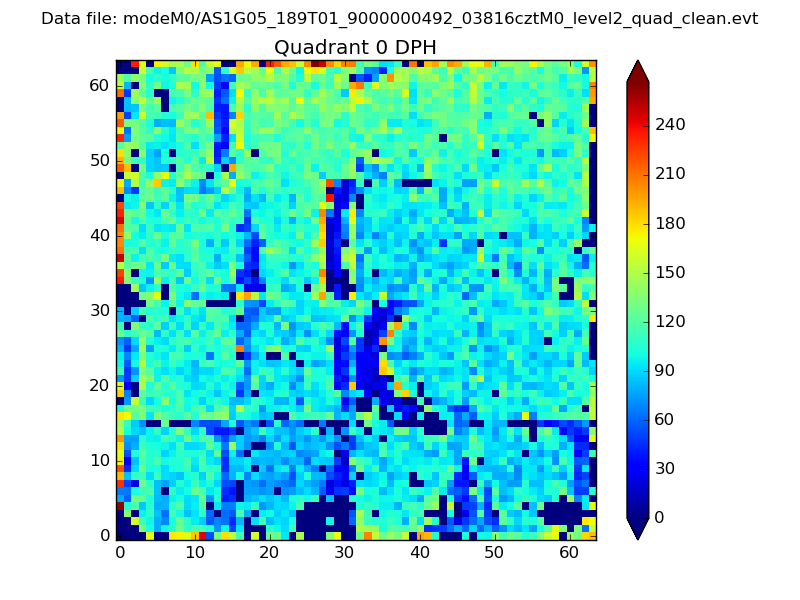 |
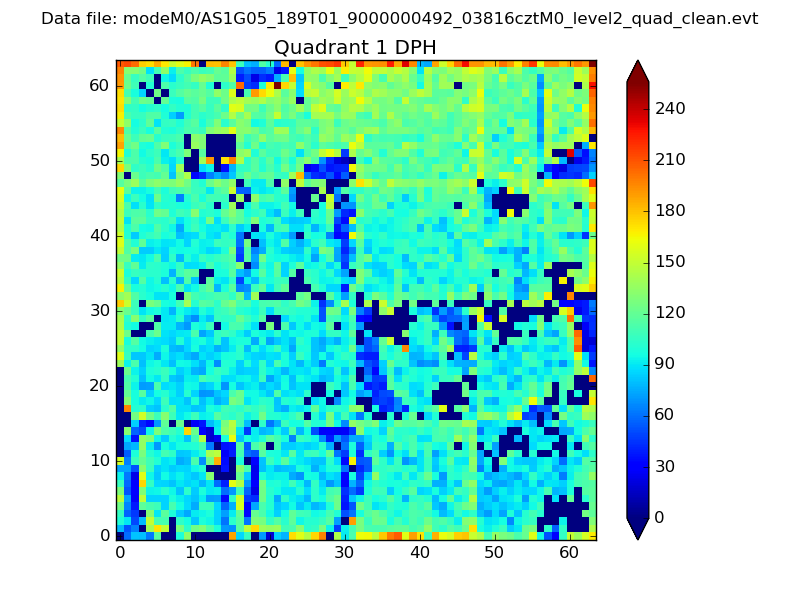 |
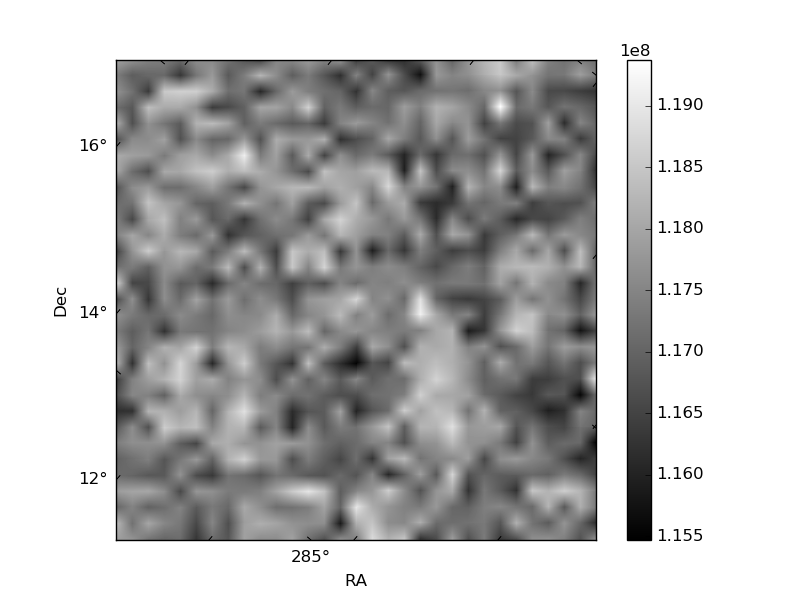
Quadrant B |
|---|---|---|---|
| Quadrant D | 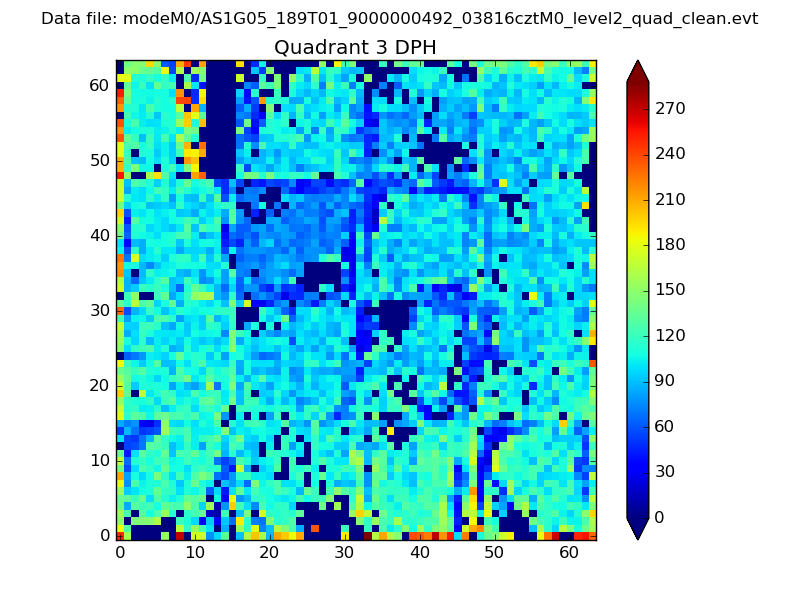 |
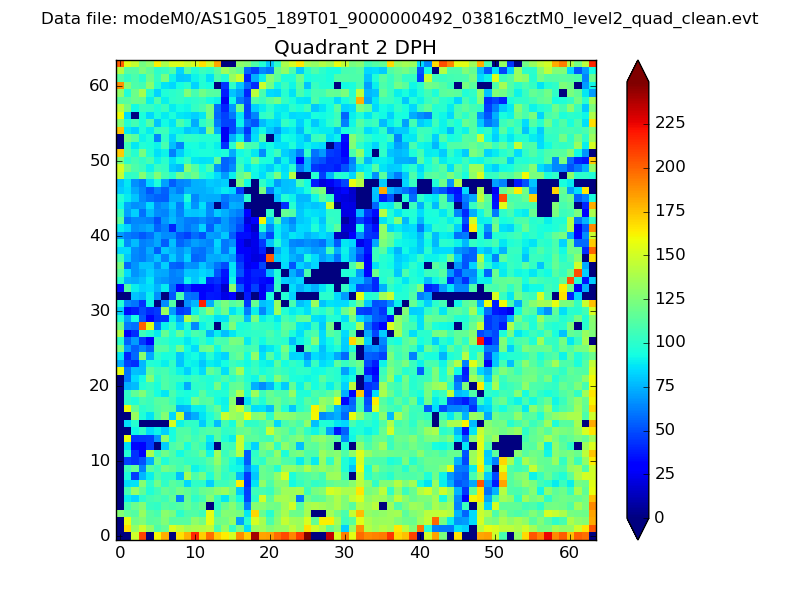 |
Quadrant C |
| Plot type | Count rate plots | Images |
|---|---|---|
| Comparison with Poisson distribution Blue bars denote a histogram of data divided into 1 sec bins. Red curve is a Poisson curve with rate = median count rate of data. |
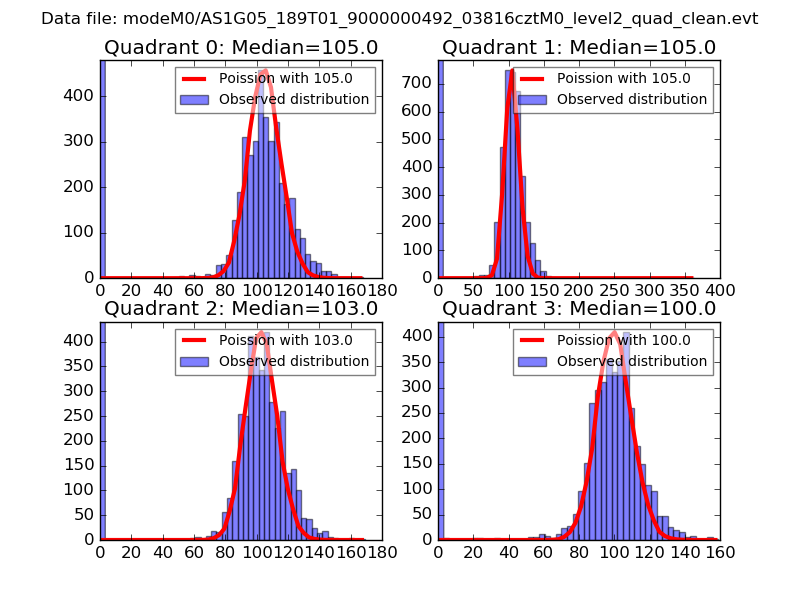 |
 |
| Quadrant-wise count rates Data is divided into 100 sec bins |
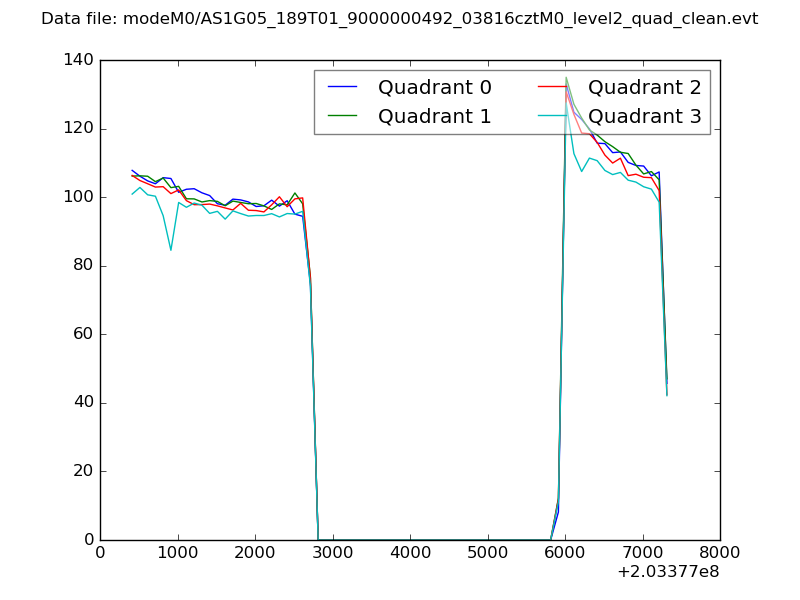 |
|
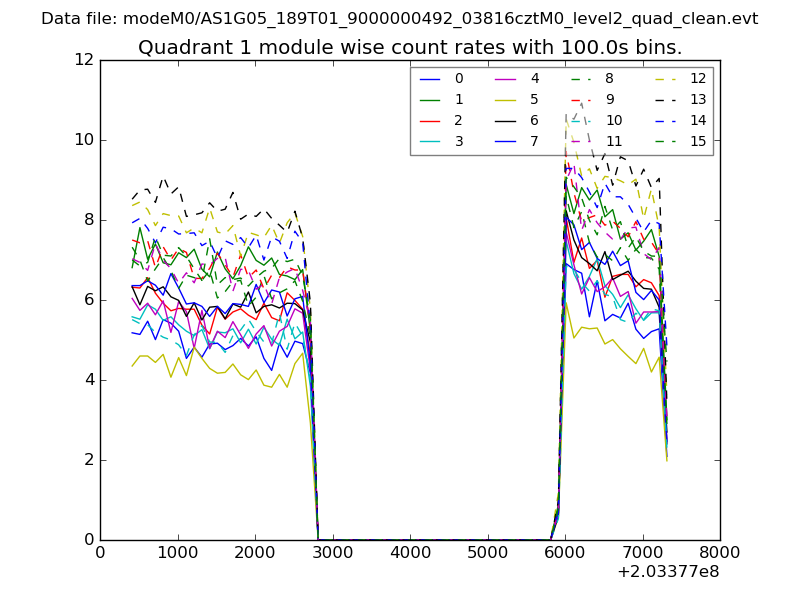
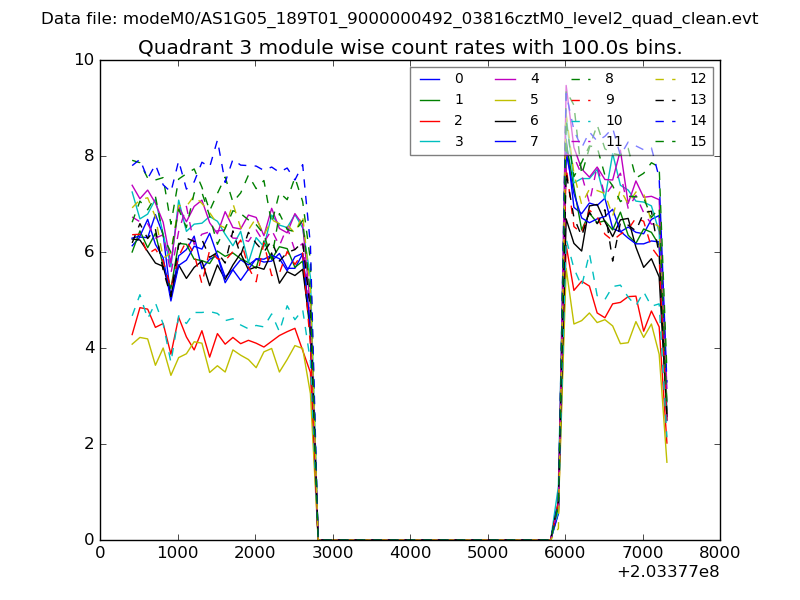
| Module-wise count rates for Quadrant A Data is divided into 100 sec bins |
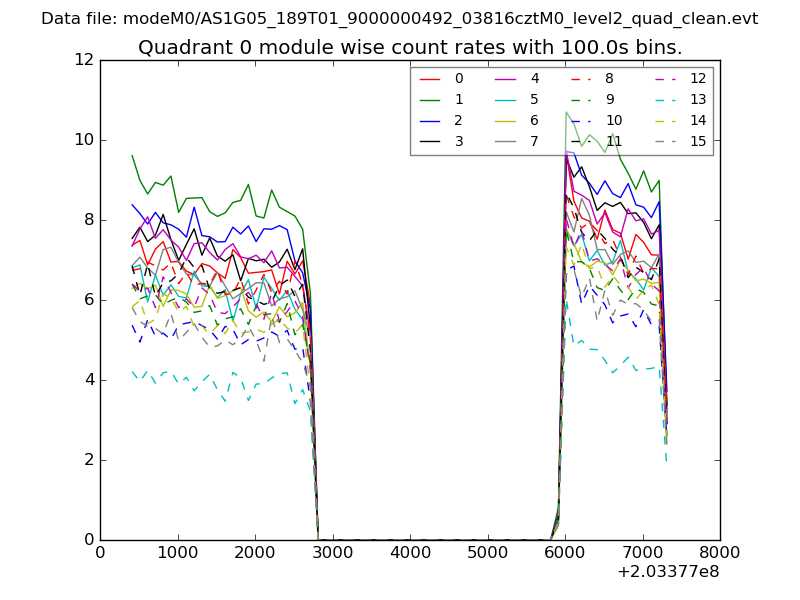 |
 |
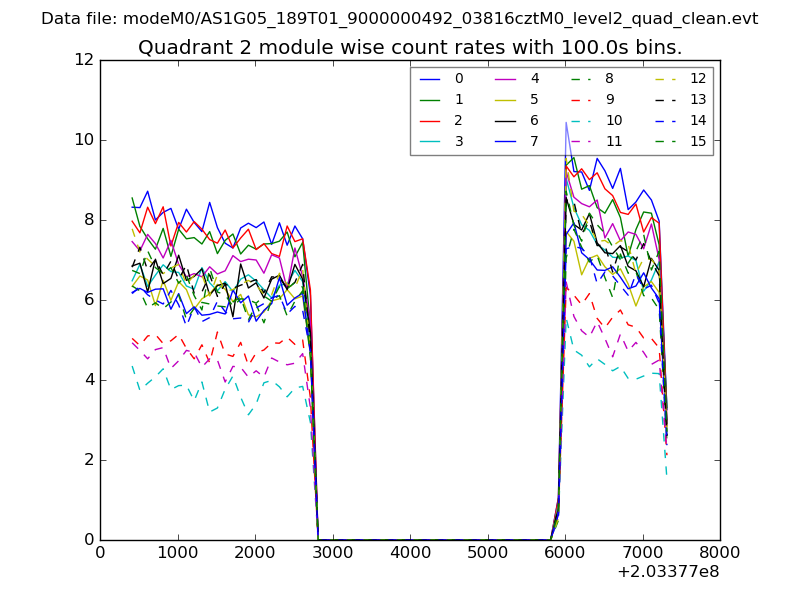
| Module-wise count rates for Quadrant B Data is divided into 100 sec bins |
 |
 |
| Module-wise count rates for Quadrant C Data is divided into 100 sec bins |
 |
 |
| Module-wise count rates for Quadrant D Data is divided into 100 sec bins |
 |
 |
| Parameter | Plot |
|---|---|
| CZT HV Monitor | 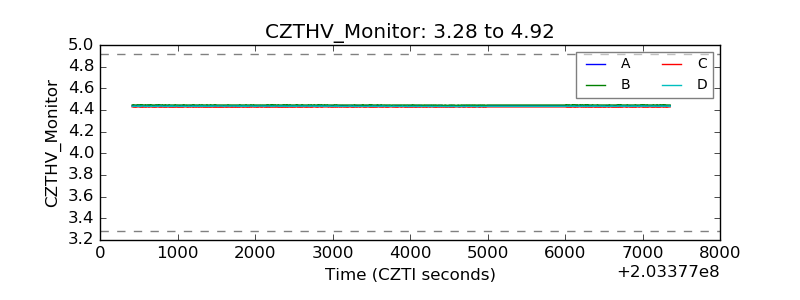 |
| D_VDD | 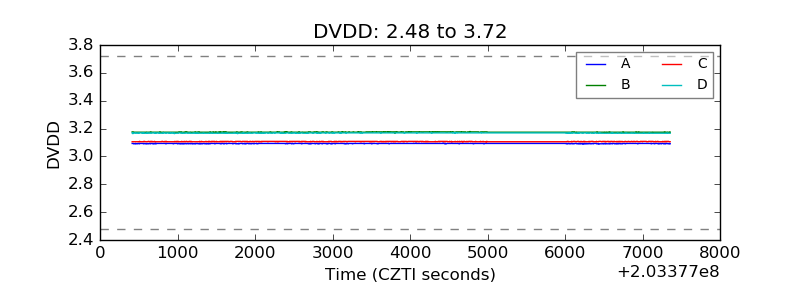 |
| Temperature 1 | 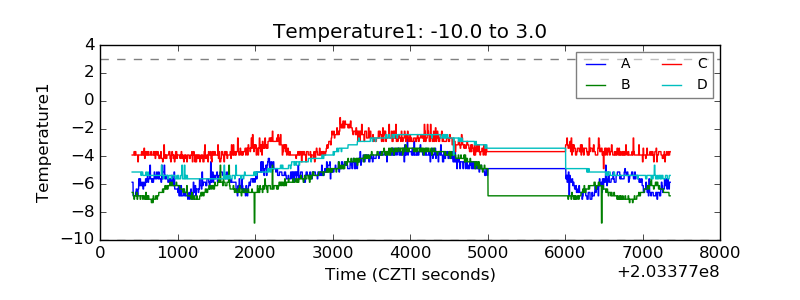 |
| Veto HV Monitor | 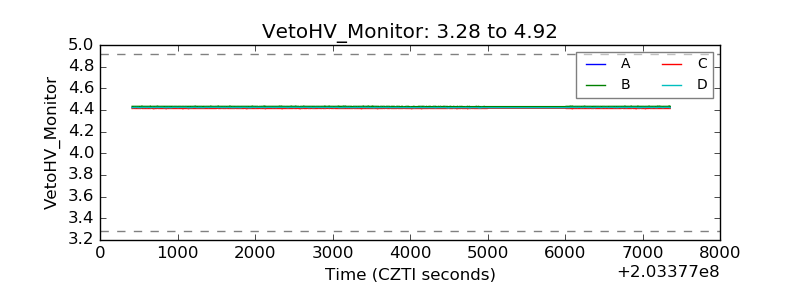 |
| Veto LLD | 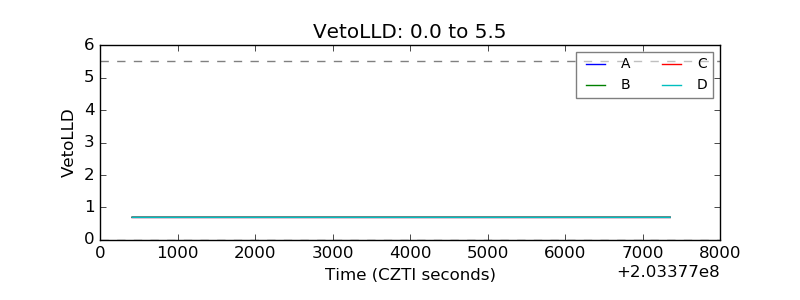 |
| Alpha Counter | 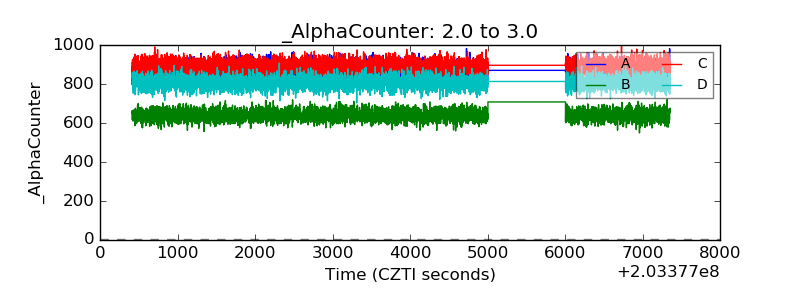 |
| _CPM_Rate | 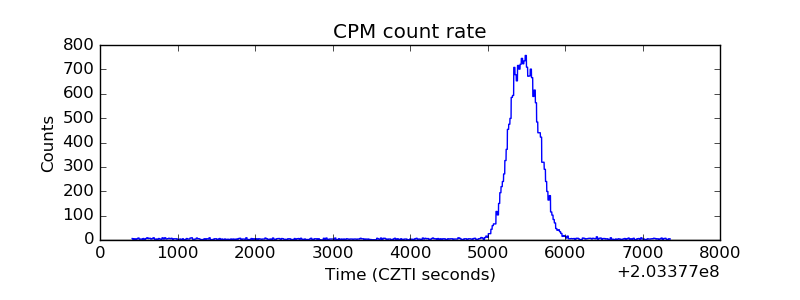 |
| CZT Counter | 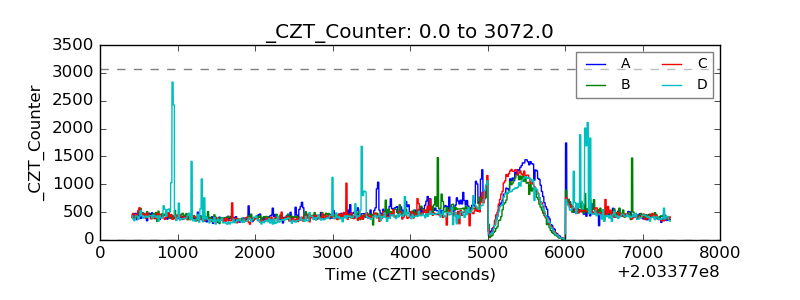 |
| +2.5 Volts monitor |  |
| +5 Volts monitor |  |
| Veto Counter | 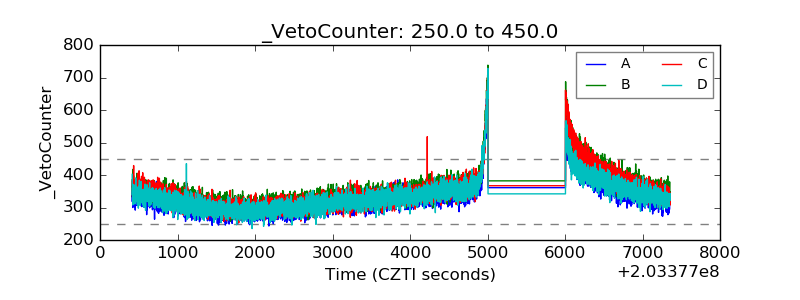 |