| Param | Original file | Final file |
|---|---|---|
| Filename | modeM0/AS1G05_189T01_9000000492_03818cztM0_level2.evt | modeM0/AS1G05_189T01_9000000492_03818cztM0_level2_quad_clean.evt |
| Size (bytes) | 421,680,960 | 68,725,440 |
| Size | 402.1 MB | 65.5 MB |
| Events in quadrant A | 2,904,991 | 423,600 |
| Events in quadrant B | 4,071,450 | 421,477 |
| Events in quadrant C | 2,639,311 | 415,987 |
| Events in quadrant D | 2,750,017 | 404,158 |
| Mode M0 | |||
|---|---|---|---|
| Quadrant | BADHDUFLAG | Total packets | Discarded packets |
| A | 0 | 12711 | 2 |
| B | 0 | 16124 | 1 |
| C | 0 | 12174 | 1 |
| D | 0 | 12582 | 1 |
| Mode M9 | |||
|---|---|---|---|
| Quadrant | BADHDUFLAG | Total packets | Discarded packets |
| A | 0 | 11 | 0 |
| B | 0 | 11 | 0 |
| C | 0 | 11 | 0 |
| D | 0 | 11 | 0 |
| Mode SS | |||
|---|---|---|---|
| Quadrant | BADHDUFLAG | Total packets | Discarded packets |
| A | 0 | 122 | 0 |
| B | 0 | 122 | 0 |
| C | 0 | 122 | 0 |
| D | 0 | 122 | 0 |
| Quadrant | Total seconds | Saturated seconds | Saturation percentage |
|---|---|---|---|
| A | 5947 | 72 | 1.210694% |
| B | 5947 | 380 | 6.389776% |
| C | 5947 | 41 | 0.689423% |
| D | 5947 | 43 | 0.723054% |
Noise dominated data is calculated using 1-second bins in cleaned event files. If a bin has >2000 counts, and if more than 50% of those come from <1% of pixels, then it is considered to be noise-dominated and hence unusable.
| Quadrant | # 1 sec bins | Bins with >0 counts | Bins with >2000 counts | High rate bins dominated by noise | Noise dominated (total time) | Noise dominated (detector-on time) | Marked lightcurve |
|---|---|---|---|---|---|---|---|
| A | 7052 | 5947 | 7 | 7 | 0.10% | 0.12% | 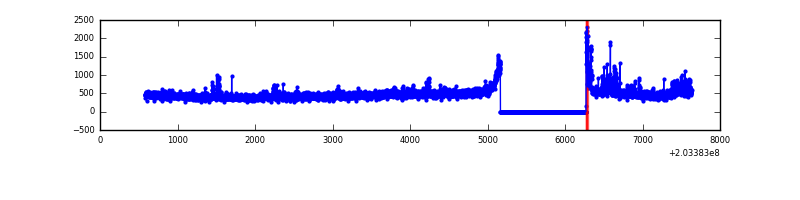 |
| B | 7052 | 5947 | 266 | 266 | 3.77% | 4.47% | 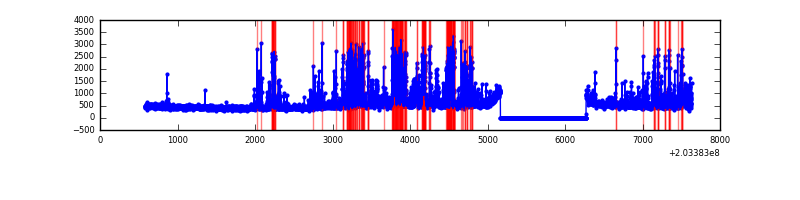 |
| C | 7052 | 5947 | 0 | 0 | 0.00% | 0.00% | 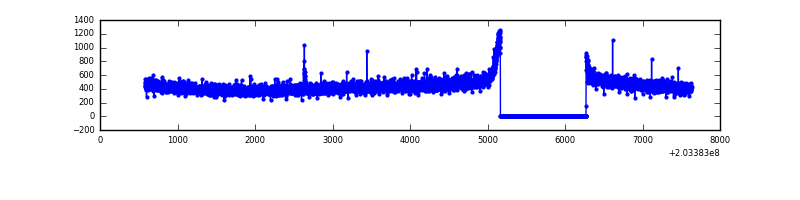 |
| D | 7052 | 5947 | 13 | 13 | 0.18% | 0.22% | 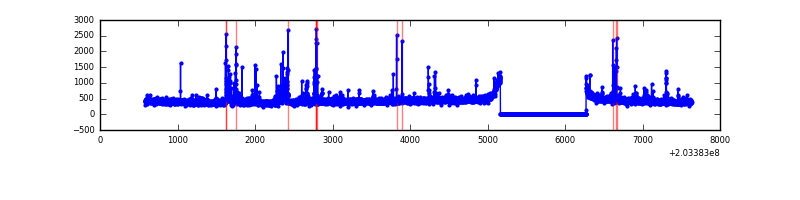 |
Top three noisy pixels from each quadrant. If the there are fewer than three noisy pixels in the level2.evt file, extra rows are filled as -1
| Pixel properties | Quadrant properties | ||||||
|---|---|---|---|---|---|---|---|
| Quadrant | DetID | PixID | Counts | Sigma | Mean | Median | Sigma |
| A | 0 | 199 | 183889 | 1298.9 | 693 | 679 | 141.1 |
| A | 0 | 226 | 22671 | 155.92 | 693 | 679 | 141.1 |
| A | 13 | 251 | 19574 | 133.96 | 693 | 679 | 141.1 |
| B | 14 | 167 | 1261756 | 9500.65 | 689 | 673 | 132.7 |
| B | 15 | 204 | 99743 | 746.37 | 689 | 673 | 132.7 |
| B | 0 | 173 | 32734 | 241.54 | 689 | 673 | 132.7 |
| C | 9 | 247 | 6147 | 34.74 | 672 | 675 | 157.5 |
| C | 13 | 61 | 5602 | 31.28 | 672 | 675 | 157.5 |
| C | 1 | 16 | 5163 | 28.49 | 672 | 675 | 157.5 |
| D | 13 | 223 | 131352 | 814.58 | 667 | 651 | 160.5 |
| D | 12 | 227 | 32006 | 195.42 | 667 | 651 | 160.5 |
| D | 13 | 137 | 14037 | 83.43 | 667 | 651 | 160.5 |
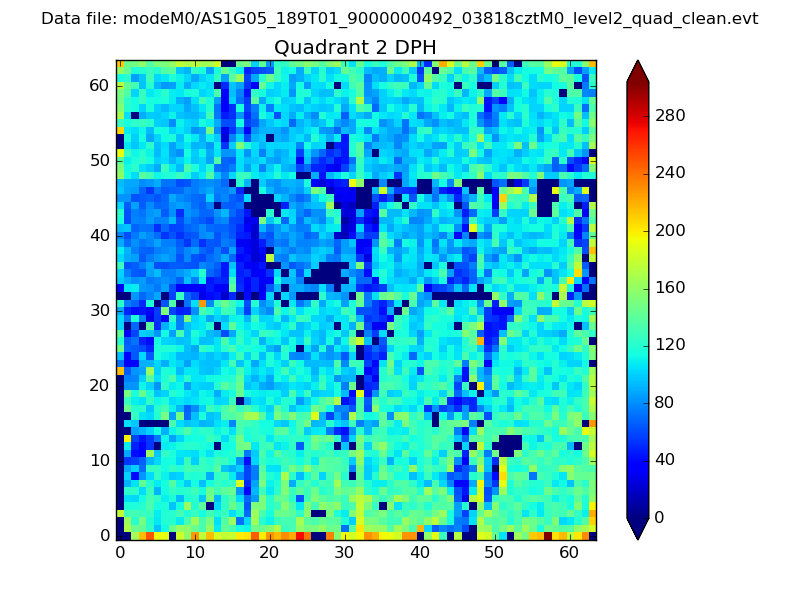
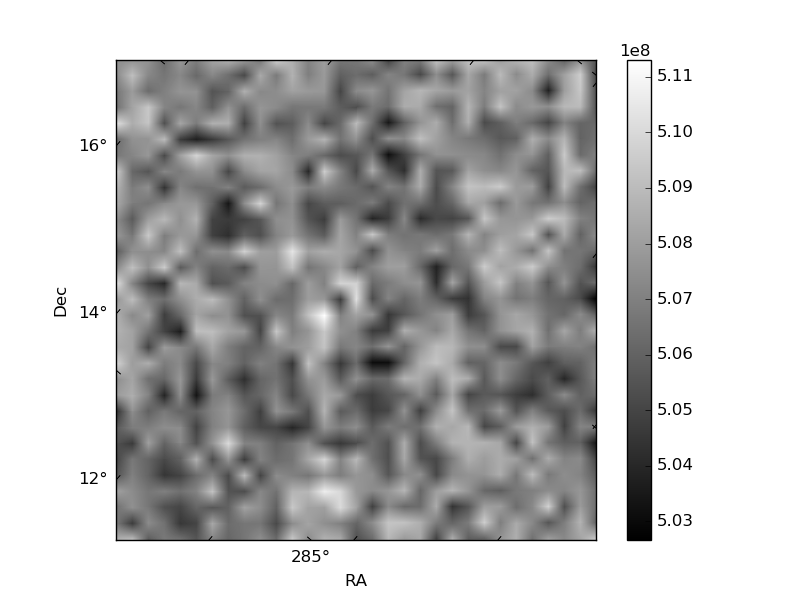
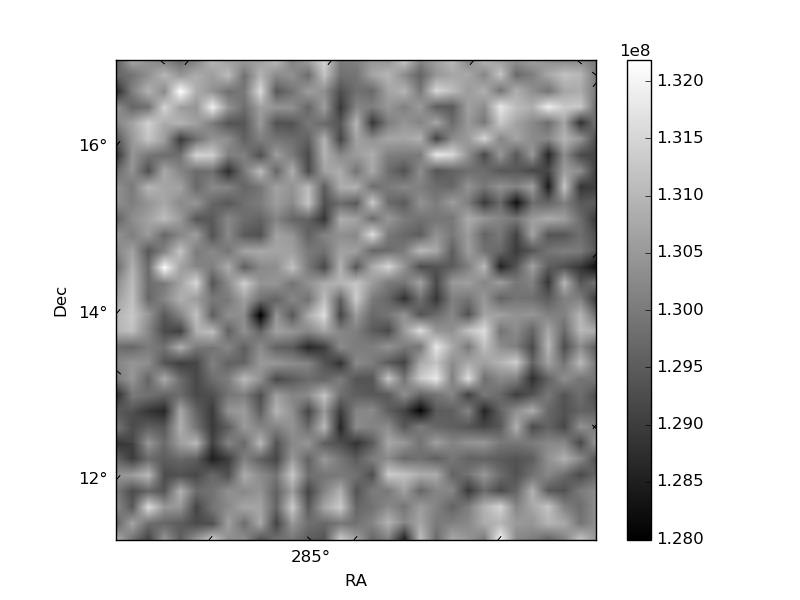
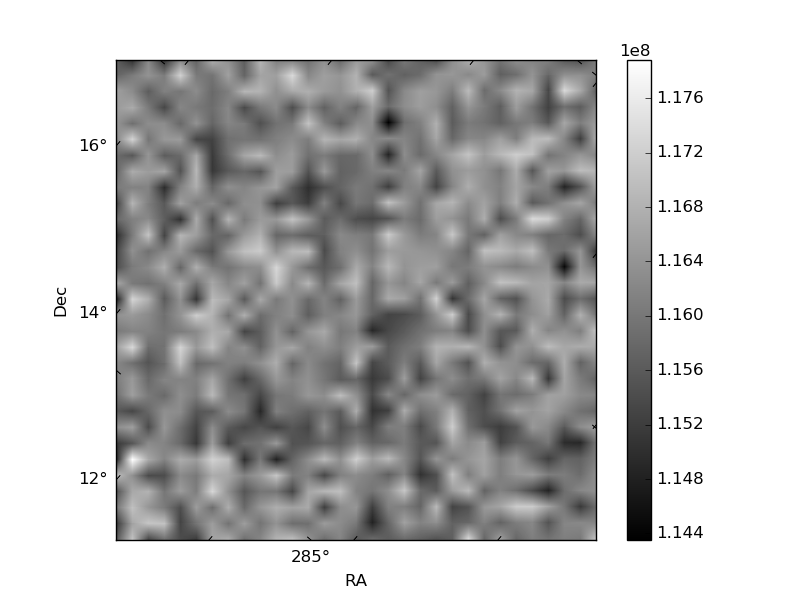
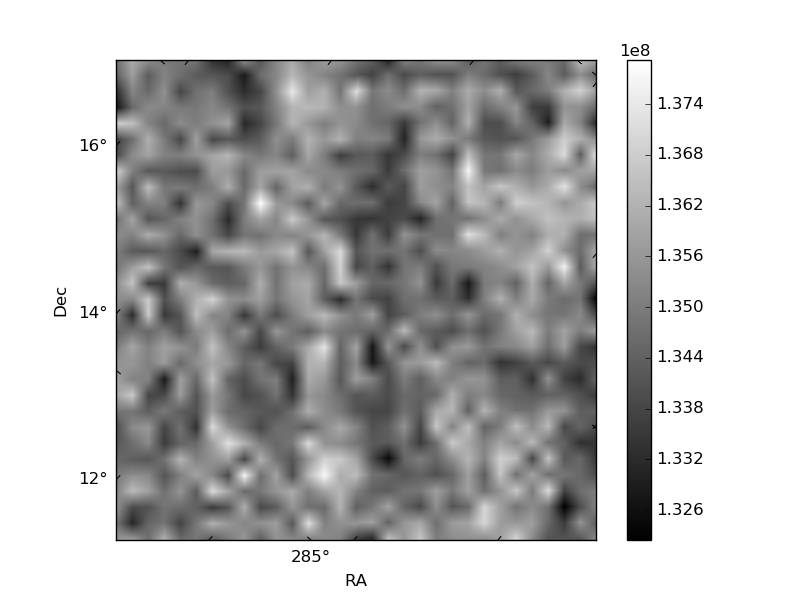
Histogram calculated using DETX and DETY for each event in the final _common_clean file
| Quadrant A | 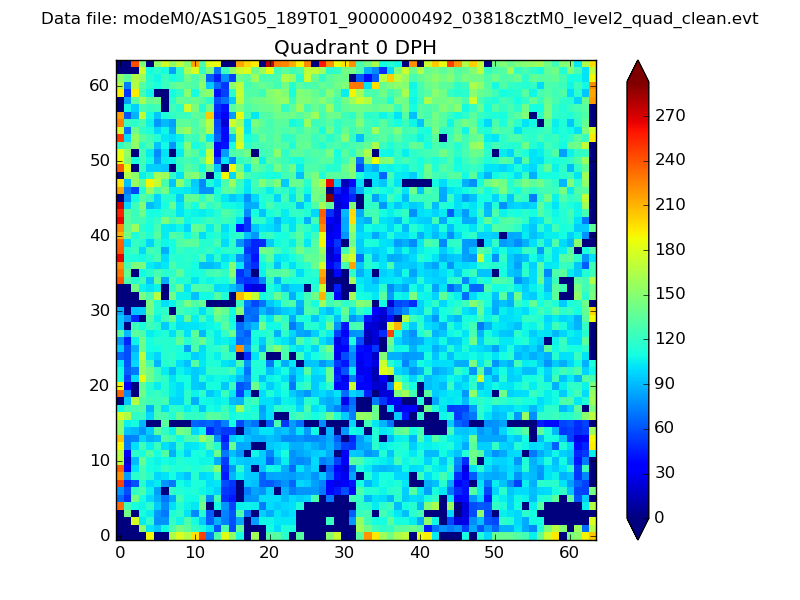 |
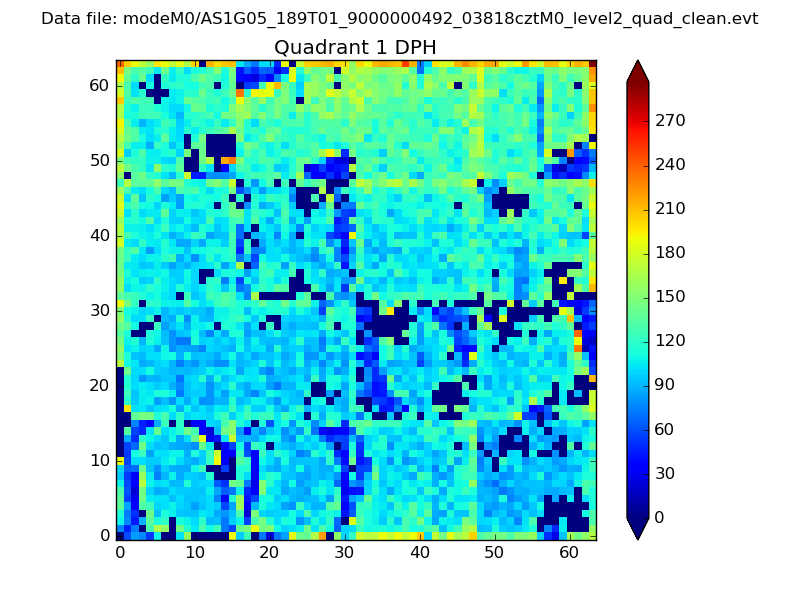 |
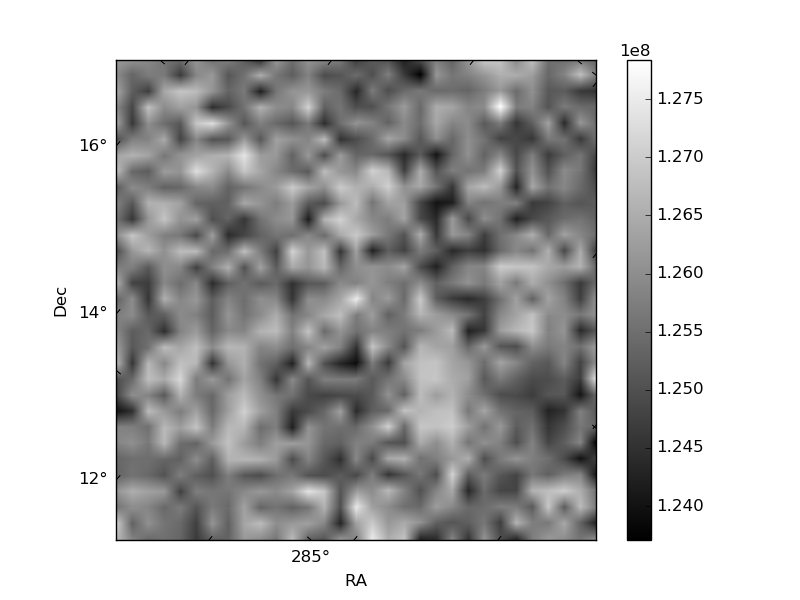
Quadrant B |
|---|---|---|---|
| Quadrant D | 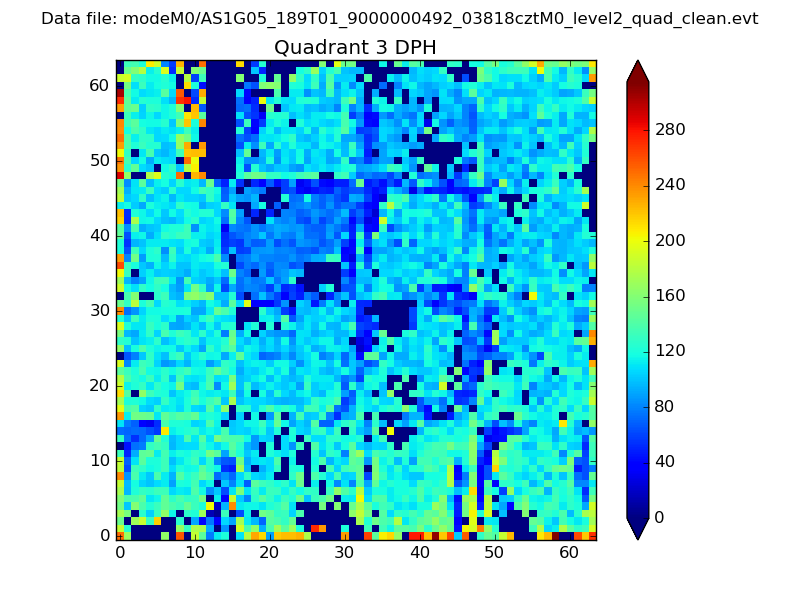 |
 |
Quadrant C |
| Plot type | Count rate plots | Images |
|---|---|---|
| Comparison with Poisson distribution Blue bars denote a histogram of data divided into 1 sec bins. Red curve is a Poisson curve with rate = median count rate of data. |
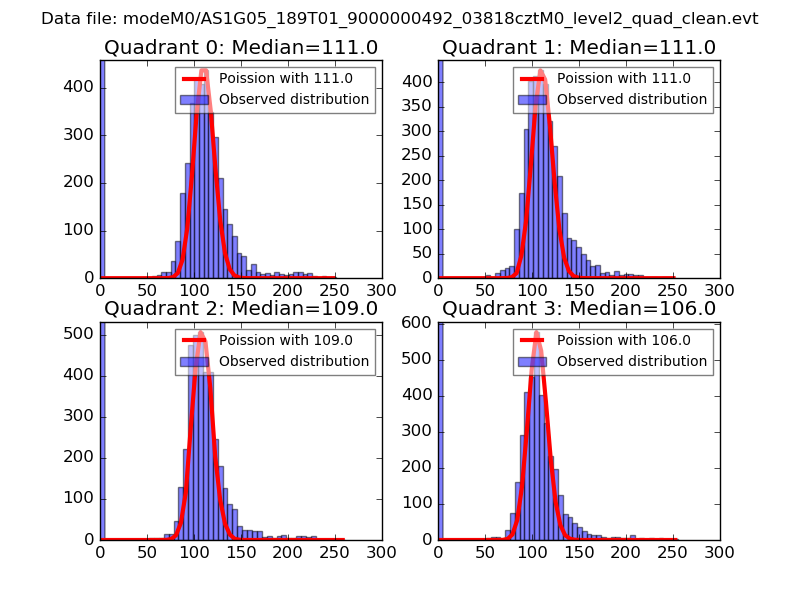 |
 |
| Quadrant-wise count rates Data is divided into 100 sec bins |
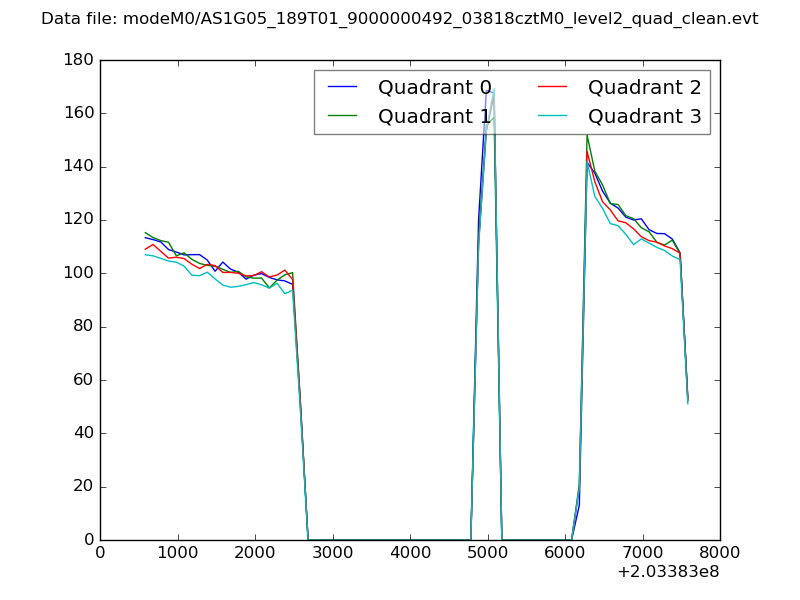 |
|
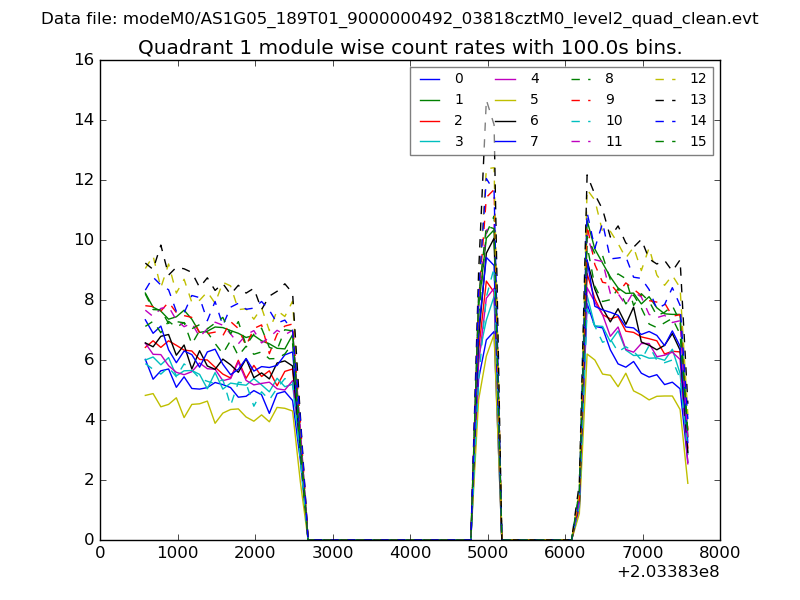
| Module-wise count rates for Quadrant A Data is divided into 100 sec bins |
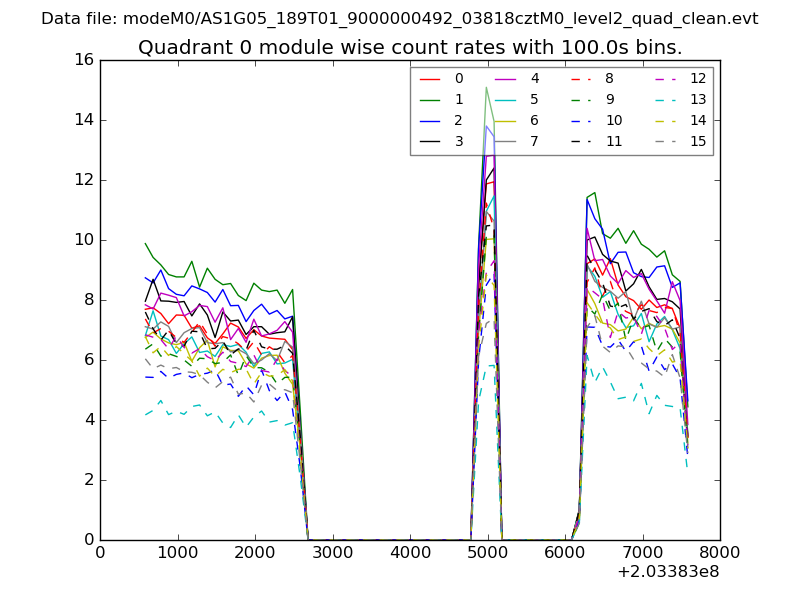 |
 |
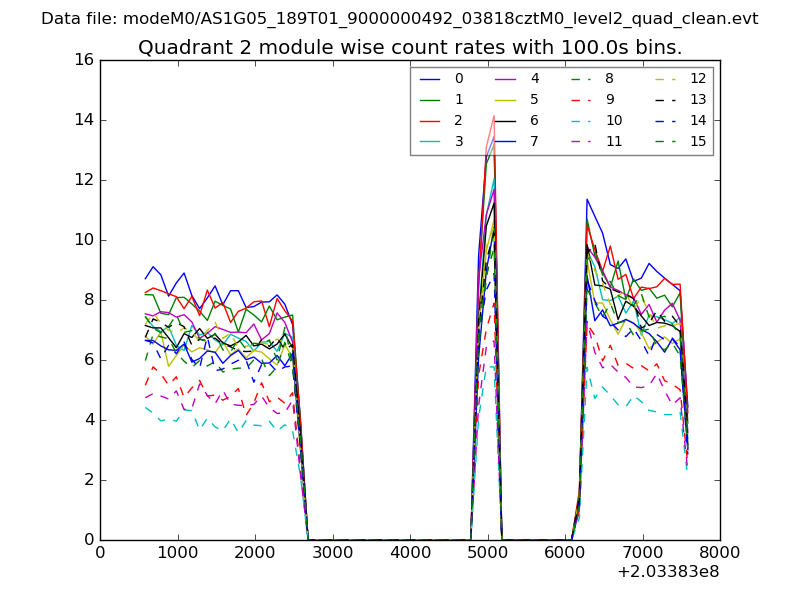
| Module-wise count rates for Quadrant B Data is divided into 100 sec bins |
 |
 |
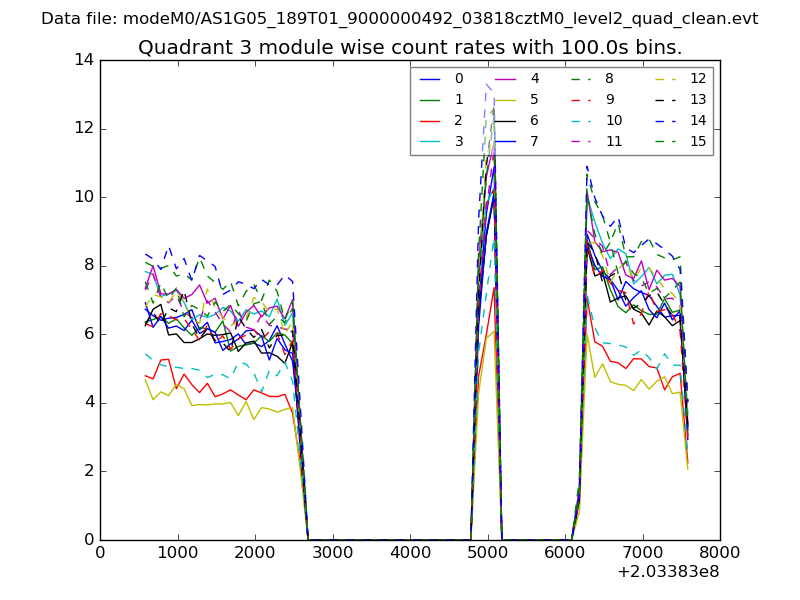
| Module-wise count rates for Quadrant C Data is divided into 100 sec bins |
 |
 |
| Module-wise count rates for Quadrant D Data is divided into 100 sec bins |
 |
 |
| Parameter | Plot |
|---|---|
| CZT HV Monitor | 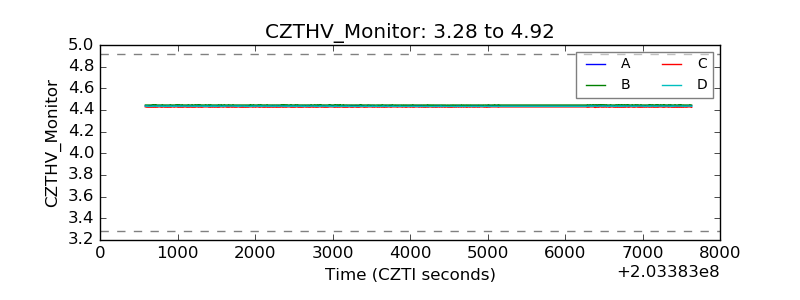 |
| D_VDD | 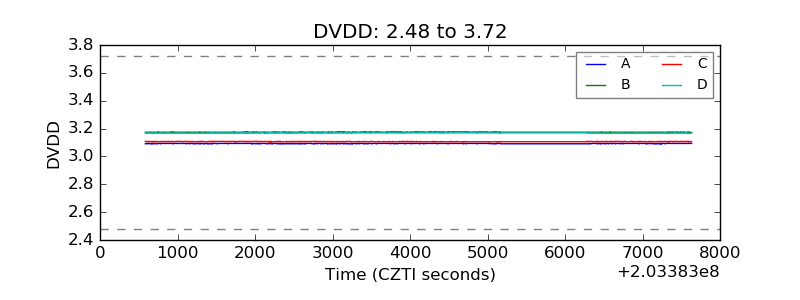 |
| Temperature 1 | 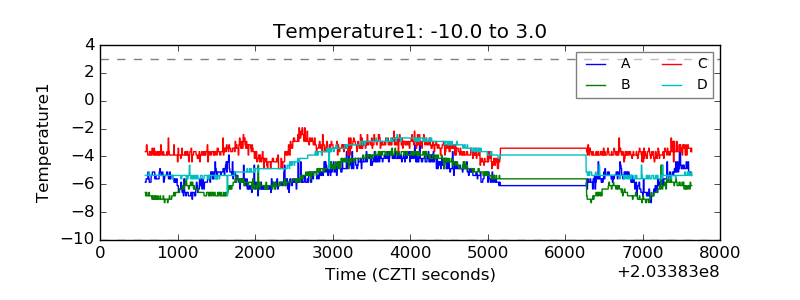 |
| Veto HV Monitor | 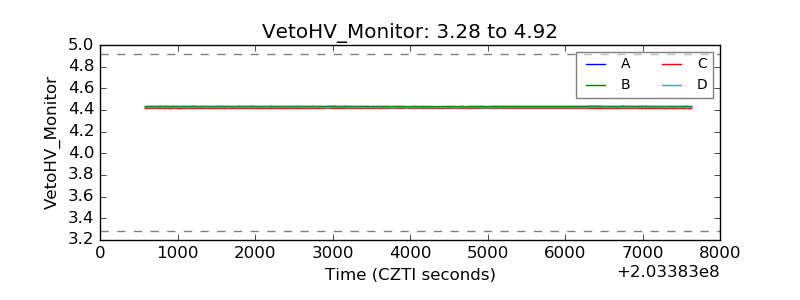 |
| Veto LLD | 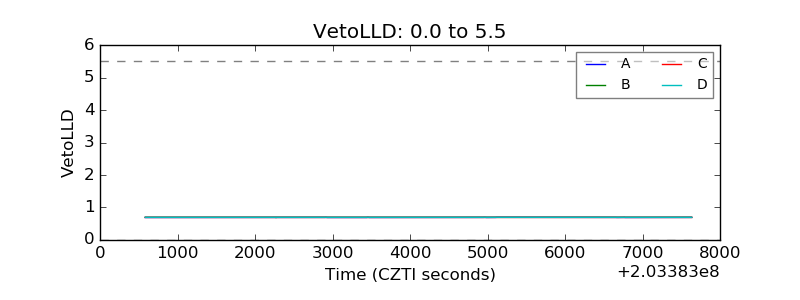 |
| Alpha Counter | 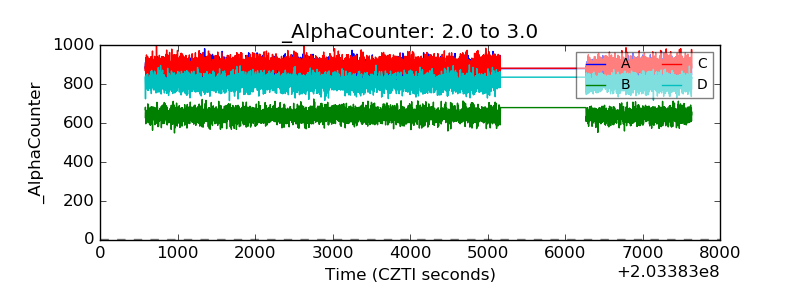 |
| _CPM_Rate | 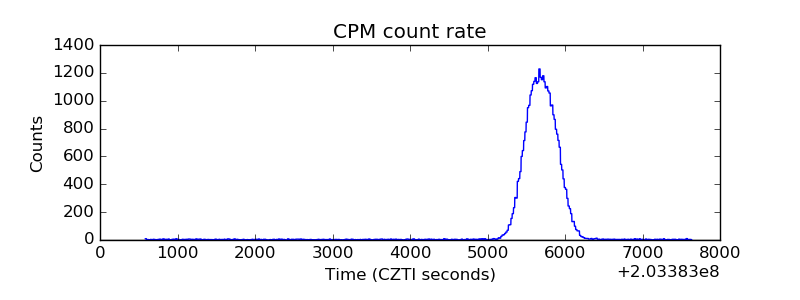 |
| CZT Counter | 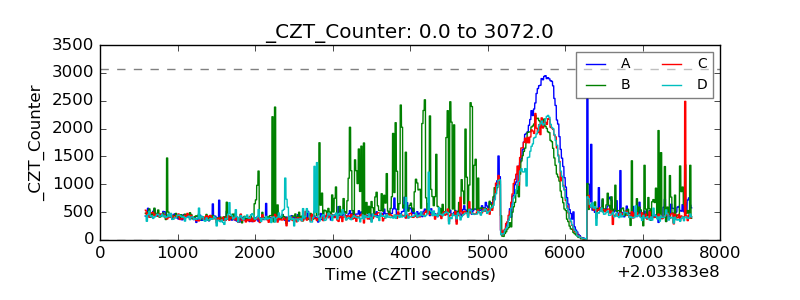 |
| +2.5 Volts monitor |  |
| +5 Volts monitor |  |
| _ROLL_ROT | 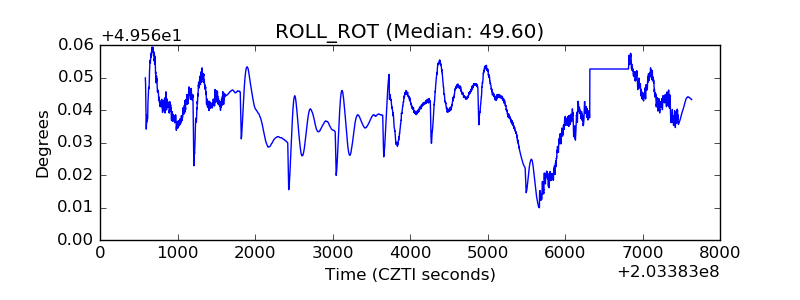 |
| _Roll_DEC | 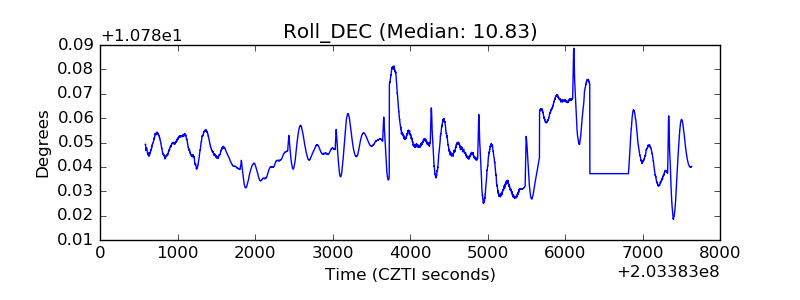 |
| _Roll_RA | 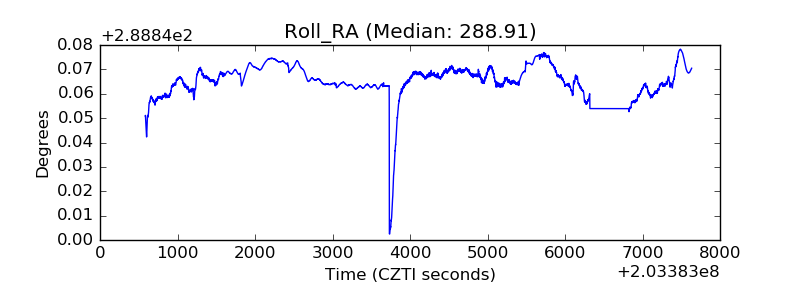 |
| Veto Counter | 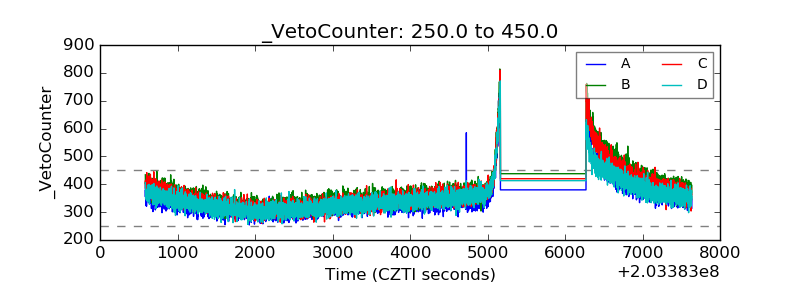 |