| Param | Original file | Final file |
|---|---|---|
| Filename | modeM0/AS1G05_189T01_9000000492_03819cztM0_level2.evt | modeM0/AS1G05_189T01_9000000492_03819cztM0_level2_quad_clean.evt |
| Size (bytes) | 425,479,680 | 68,143,680 |
| Size | 405.8 MB | 65.0 MB |
| Events in quadrant A | 3,112,246 | 423,863 |
| Events in quadrant B | 3,773,773 | 421,970 |
| Events in quadrant C | 2,620,423 | 410,947 |
| Events in quadrant D | 2,985,336 | 401,423 |
| Mode M0 | |||
|---|---|---|---|
| Quadrant | BADHDUFLAG | Total packets | Discarded packets |
| A | 0 | 13154 | 2 |
| B | 0 | 14929 | 1 |
| C | 0 | 11859 | 1 |
| D | 0 | 13066 | 1 |
| Mode M9 | |||
|---|---|---|---|
| Quadrant | BADHDUFLAG | Total packets | Discarded packets |
| A | 0 | 12 | 0 |
| B | 0 | 12 | 0 |
| C | 0 | 12 | 0 |
| D | 0 | 12 | 0 |
| Mode SS | |||
|---|---|---|---|
| Quadrant | BADHDUFLAG | Total packets | Discarded packets |
| A | 0 | 116 | 0 |
| B | 0 | 116 | 0 |
| C | 0 | 116 | 0 |
| D | 0 | 116 | 0 |
| Quadrant | Total seconds | Saturated seconds | Saturation percentage |
|---|---|---|---|
| A | 5795 | 23 | 0.396894% |
| B | 5795 | 177 | 3.054357% |
| C | 5795 | 18 | 0.310613% |
| D | 5795 | 65 | 1.121657% |
Noise dominated data is calculated using 1-second bins in cleaned event files. If a bin has >2000 counts, and if more than 50% of those come from <1% of pixels, then it is considered to be noise-dominated and hence unusable.
| Quadrant | # 1 sec bins | Bins with >0 counts | Bins with >2000 counts | High rate bins dominated by noise | Noise dominated (total time) | Noise dominated (detector-on time) | Marked lightcurve |
|---|---|---|---|---|---|---|---|
| A | 7025 | 5795 | 0 | 0 | 0.00% | 0.00% | 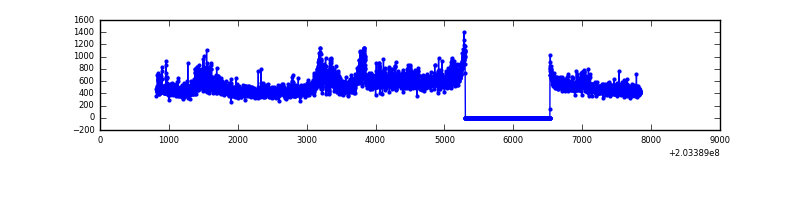 |
| B | 7025 | 5796 | 125 | 125 | 1.78% | 2.16% | 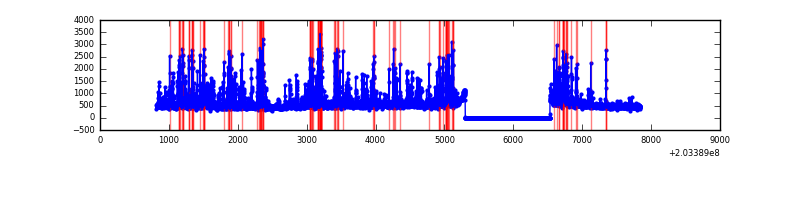 |
| C | 7025 | 5795 | 2 | 2 | 0.03% | 0.03% | 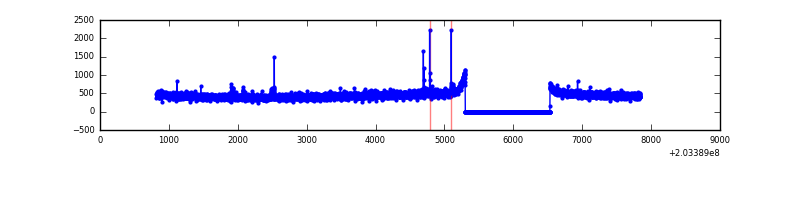 |
| D | 7025 | 5796 | 48 | 48 | 0.68% | 0.83% | 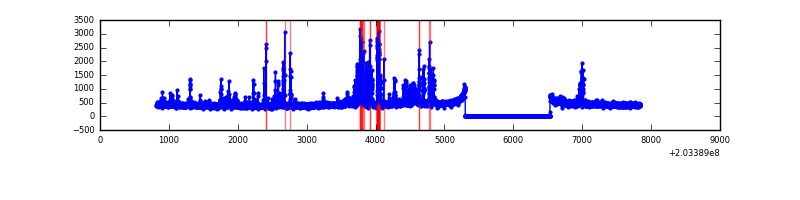 |
Top three noisy pixels from each quadrant. If the there are fewer than three noisy pixels in the level2.evt file, extra rows are filled as -1
| Pixel properties | Quadrant properties | ||||||
|---|---|---|---|---|---|---|---|
| Quadrant | DetID | PixID | Counts | Sigma | Mean | Median | Sigma |
| A | 0 | 199 | 398112 | 2825.82 | 691 | 678 | 140.6 |
| A | 0 | 226 | 40709 | 284.63 | 691 | 678 | 140.6 |
| A | 8 | 15 | 9643 | 63.74 | 691 | 678 | 140.6 |
| B | 14 | 167 | 973621 | 7330.46 | 693 | 677 | 132.7 |
| B | 15 | 204 | 50576 | 375.95 | 693 | 677 | 132.7 |
| B | 0 | 173 | 45219 | 335.59 | 693 | 677 | 132.7 |
| C | 9 | 247 | 15583 | 95.93 | 662 | 669 | 155.5 |
| C | 10 | 65 | 6210 | 35.64 | 662 | 669 | 155.5 |
| C | 13 | 61 | 5556 | 31.44 | 662 | 669 | 155.5 |
| D | 12 | 227 | 375772 | 2343.49 | 659 | 642 | 160.1 |
| D | 13 | 223 | 105836 | 657.16 | 659 | 642 | 160.1 |
| D | 14 | 34 | 19944 | 120.58 | 659 | 642 | 160.1 |
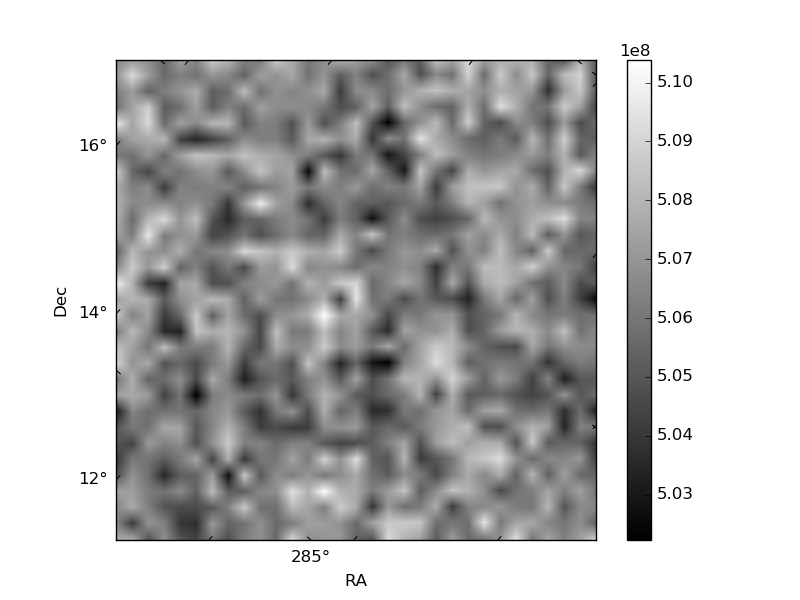
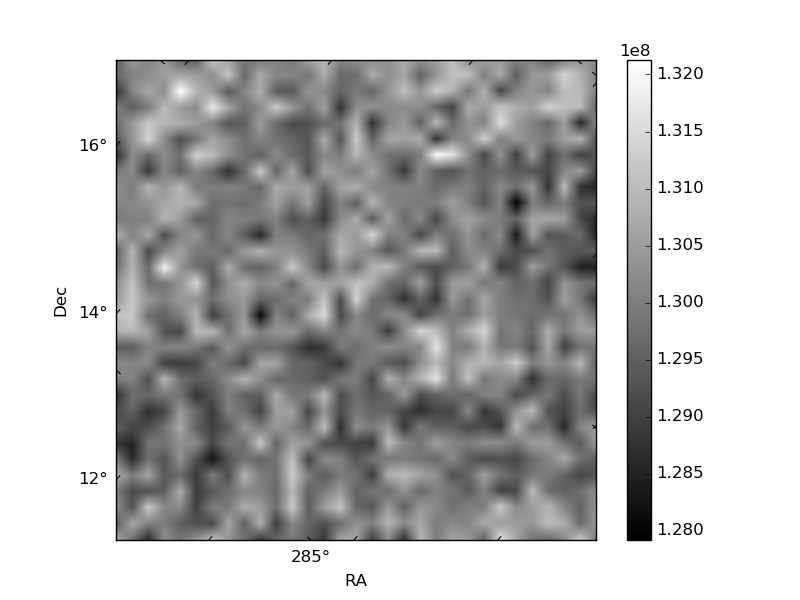
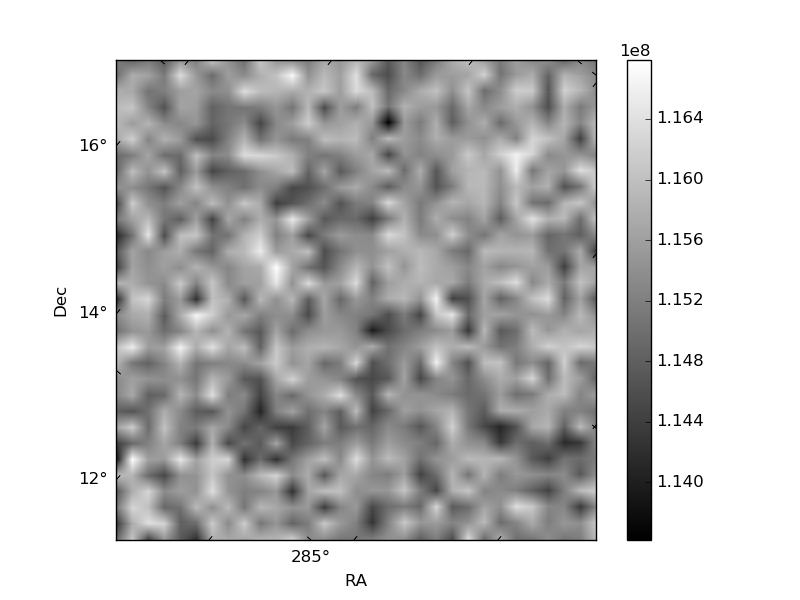
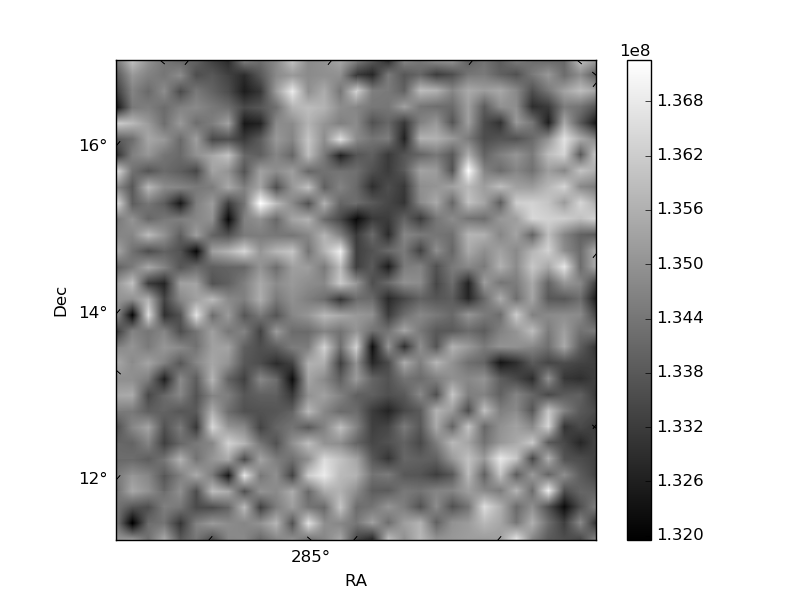
Histogram calculated using DETX and DETY for each event in the final _common_clean file
| Quadrant A | 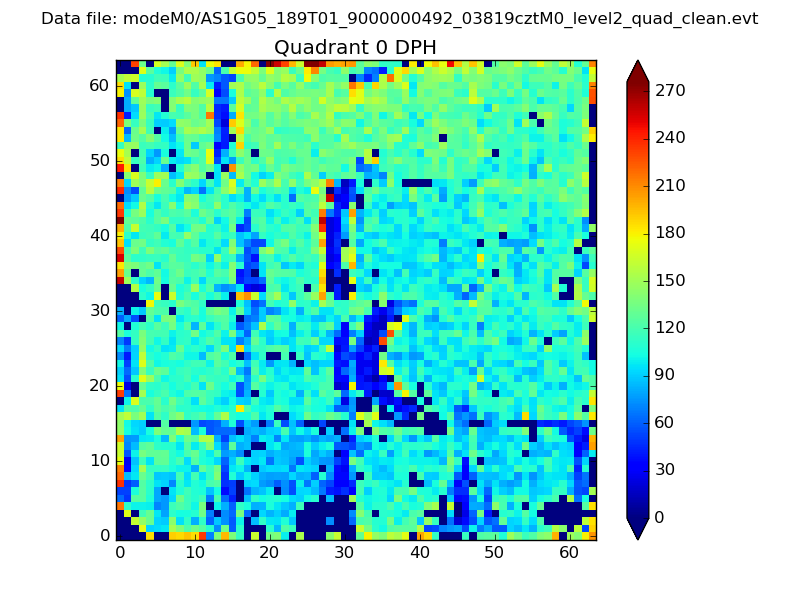 |
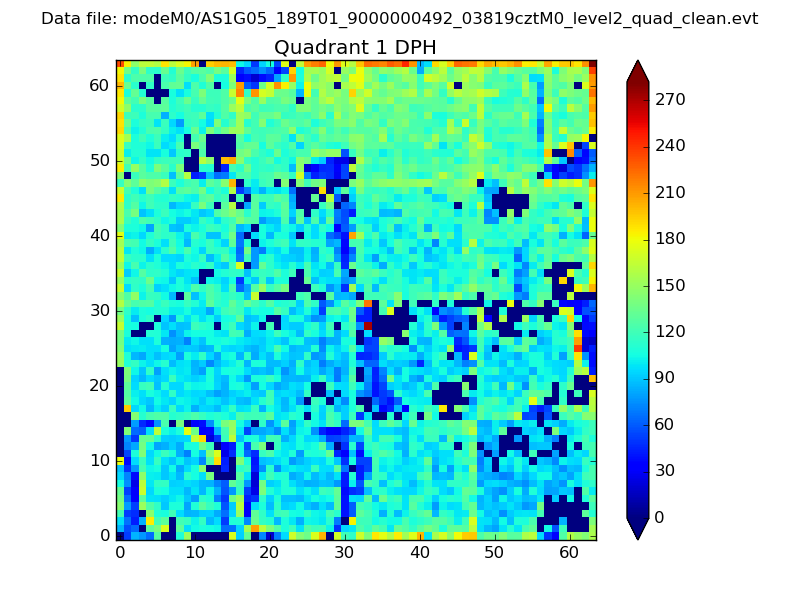 |
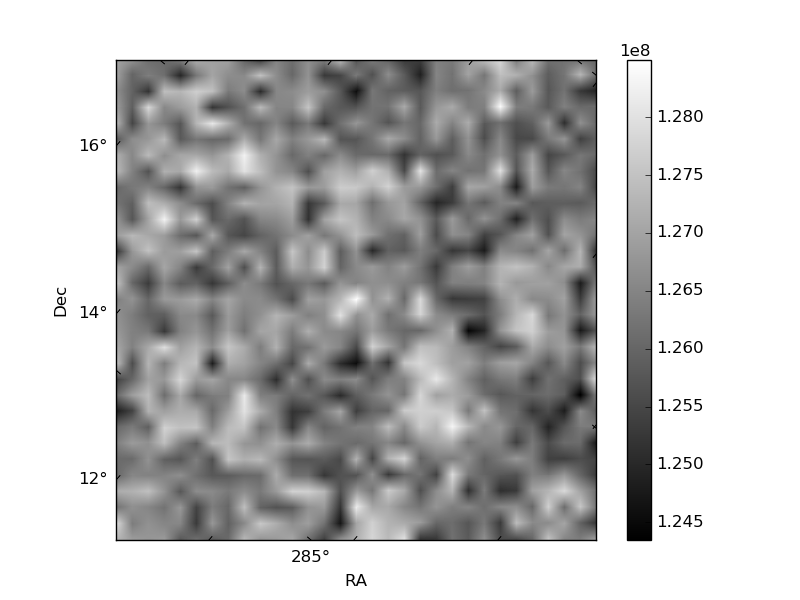
Quadrant B |
|---|---|---|---|
| Quadrant D | 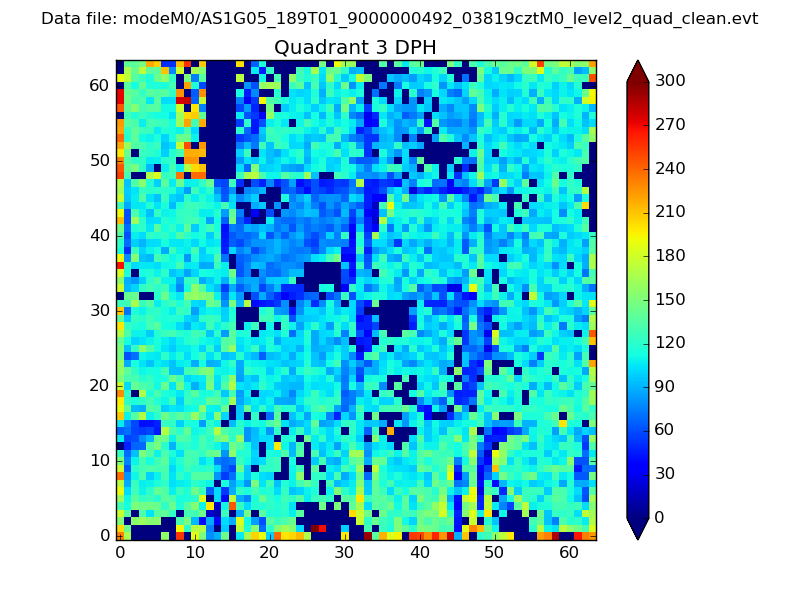 |
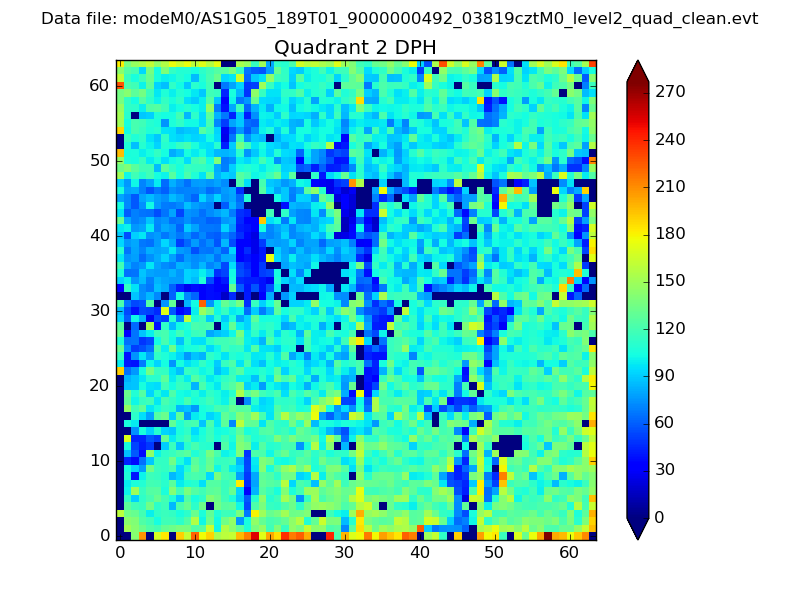 |
Quadrant C |
| Plot type | Count rate plots | Images |
|---|---|---|
| Comparison with Poisson distribution Blue bars denote a histogram of data divided into 1 sec bins. Red curve is a Poisson curve with rate = median count rate of data. |
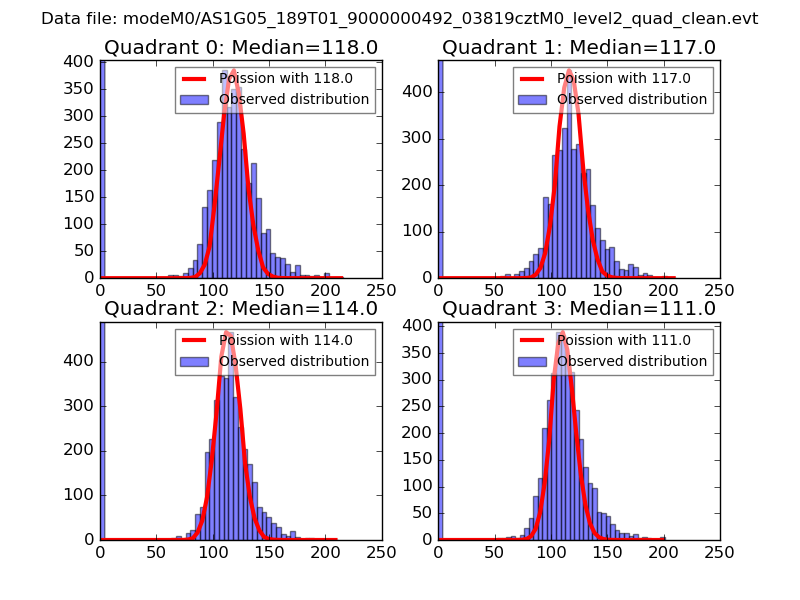 |
 |
| Quadrant-wise count rates Data is divided into 100 sec bins |
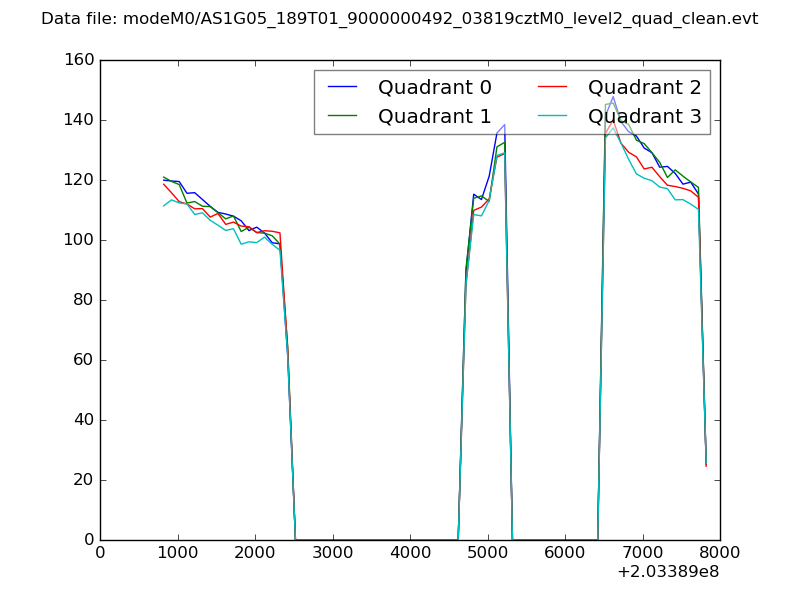 |
|
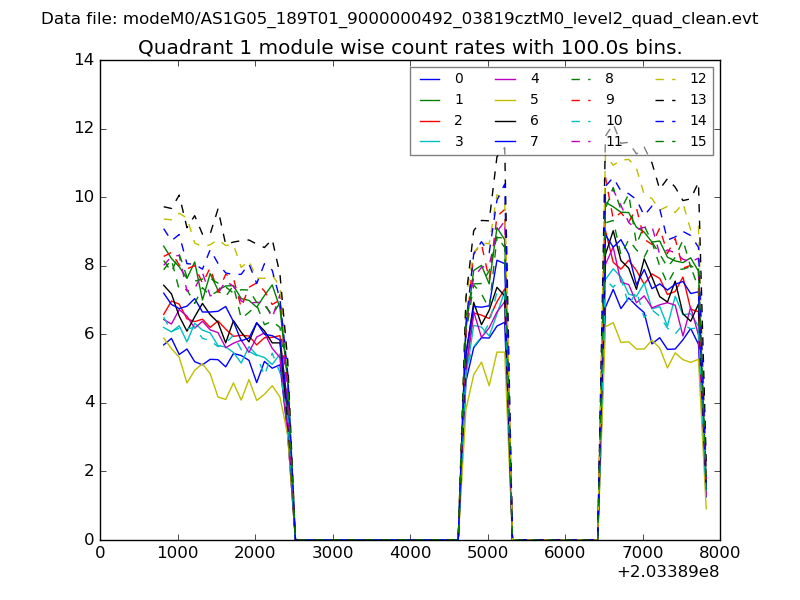
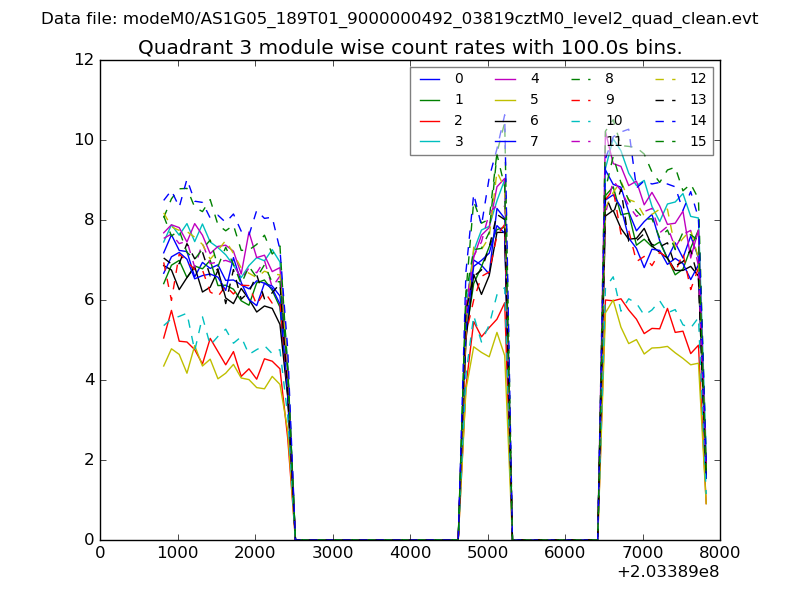
| Module-wise count rates for Quadrant A Data is divided into 100 sec bins |
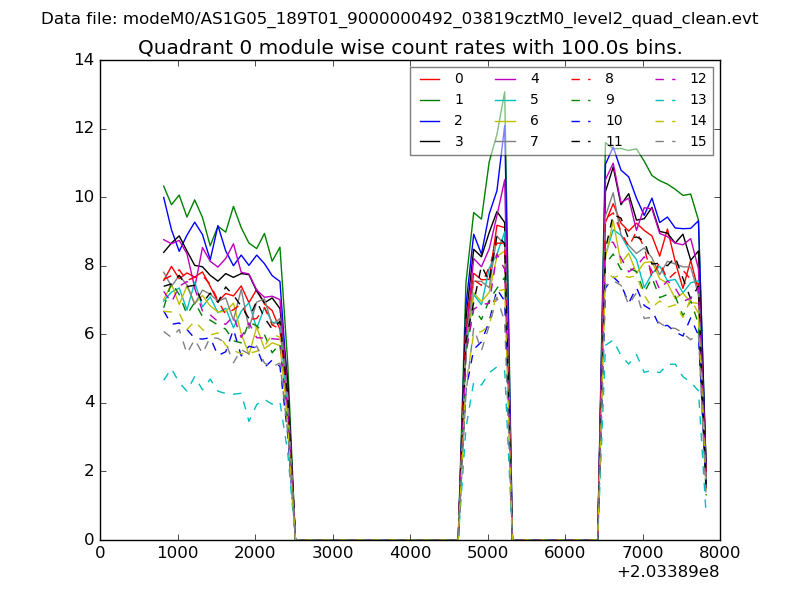 |
 |
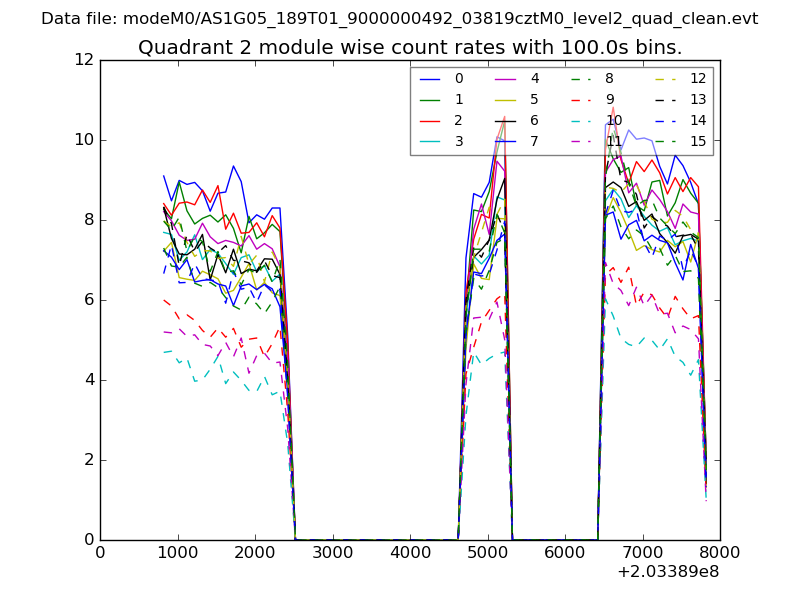
| Module-wise count rates for Quadrant B Data is divided into 100 sec bins |
 |
 |
| Module-wise count rates for Quadrant C Data is divided into 100 sec bins |
 |
 |
| Module-wise count rates for Quadrant D Data is divided into 100 sec bins |
 |
 |
| Parameter | Plot |
|---|---|
| CZT HV Monitor | 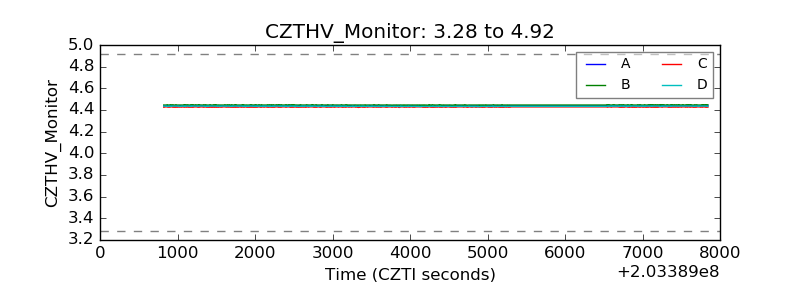 |
| D_VDD | 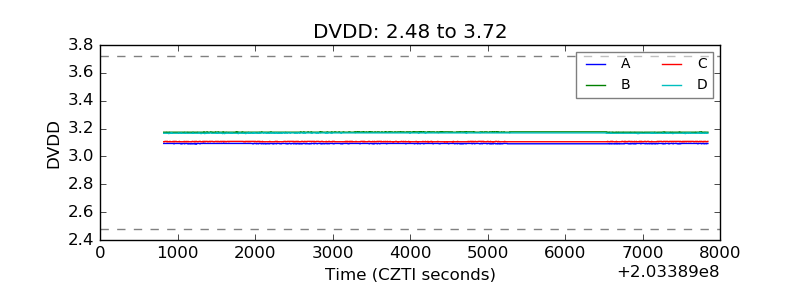 |
| Temperature 1 | 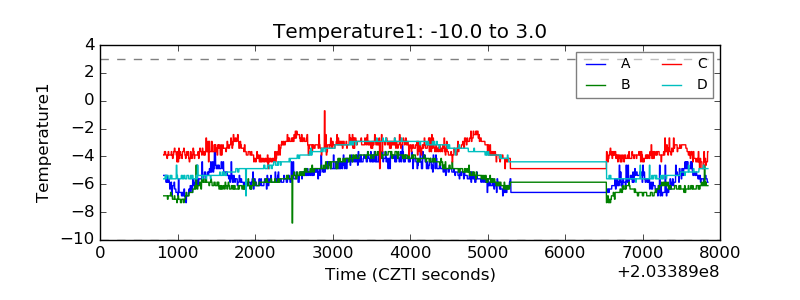 |
| Veto HV Monitor | 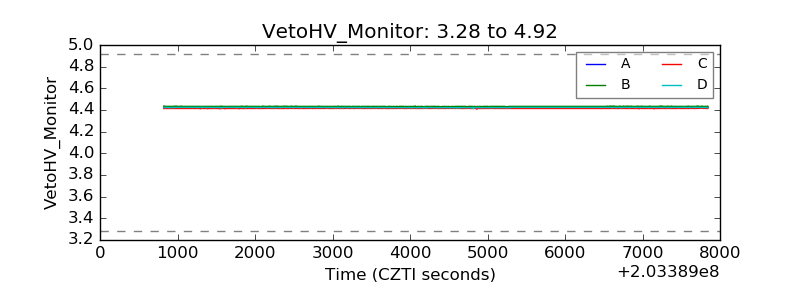 |
| Veto LLD | 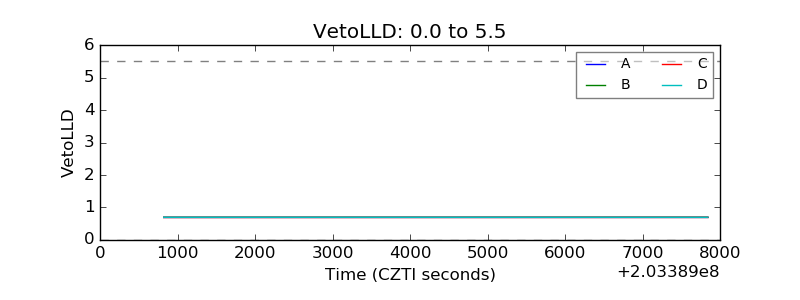 |
| Alpha Counter | 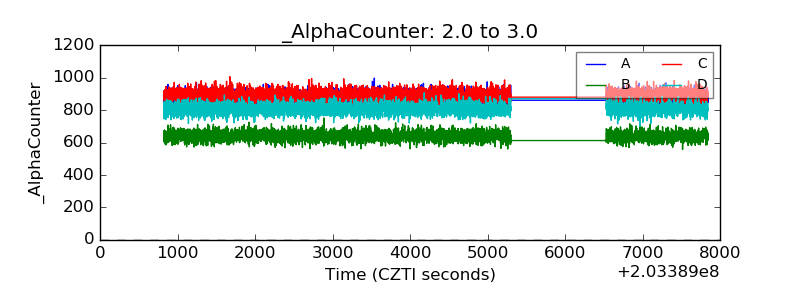 |
| _CPM_Rate | 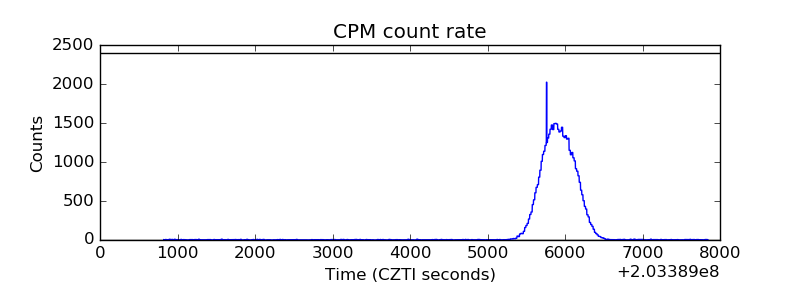 |
| CZT Counter | 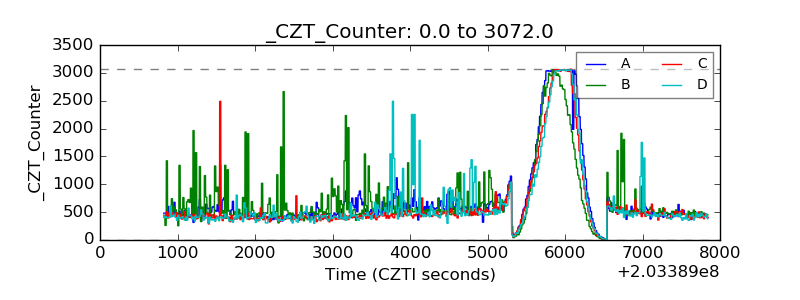 |
| +2.5 Volts monitor |  |
| +5 Volts monitor |  |
| _ROLL_ROT | 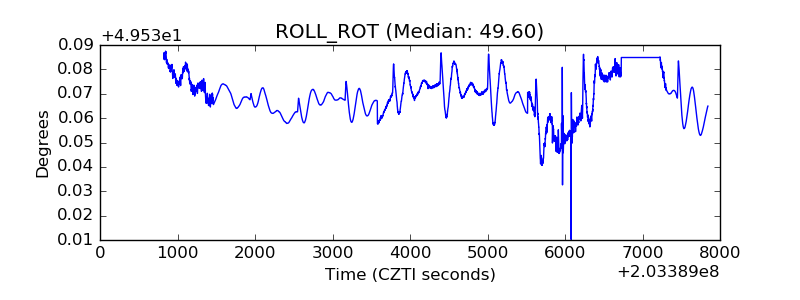 |
| _Roll_DEC | 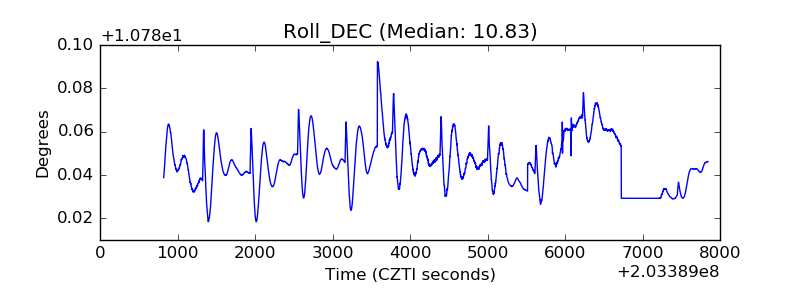 |
| _Roll_RA | 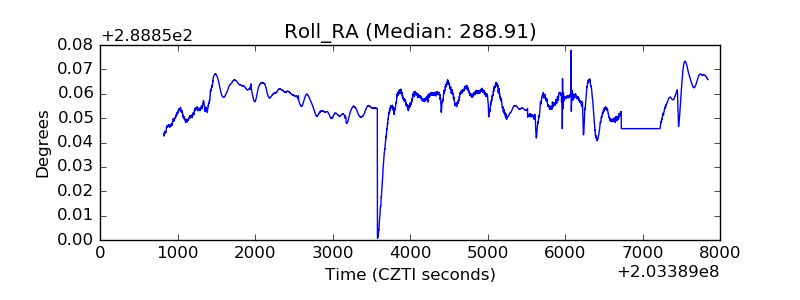 |
| Veto Counter | 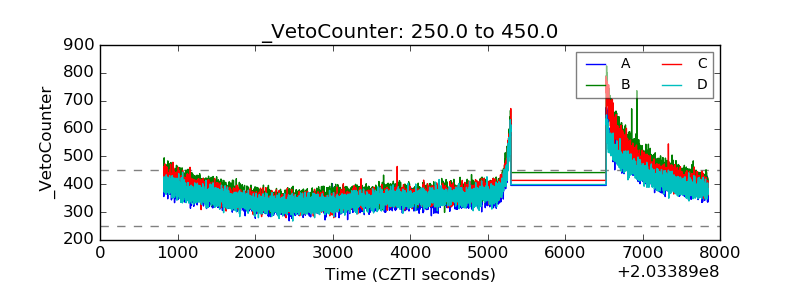 |