| Param | Original file | Final file |
|---|---|---|
| Filename | modeM0/AS1G05_189T01_9000000492_03820cztM0_level2.evt | modeM0/AS1G05_189T01_9000000492_03820cztM0_level2_quad_clean.evt |
| Size (bytes) | 415,759,680 | 68,088,960 |
| Size | 396.5 MB | 64.9 MB |
| Events in quadrant A | 2,879,325 | 423,094 |
| Events in quadrant B | 3,608,305 | 421,037 |
| Events in quadrant C | 2,715,213 | 411,398 |
| Events in quadrant D | 2,993,200 | 399,922 |
| Mode M0 | |||
|---|---|---|---|
| Quadrant | BADHDUFLAG | Total packets | Discarded packets |
| A | 0 | 12214 | 2 |
| B | 0 | 14280 | 1 |
| C | 0 | 11990 | 1 |
| D | 0 | 12961 | 1 |
| Mode M9 | |||
|---|---|---|---|
| Quadrant | BADHDUFLAG | Total packets | Discarded packets |
| A | 0 | 12 | 0 |
| B | 0 | 12 | 0 |
| C | 0 | 12 | 0 |
| D | 0 | 12 | 0 |
| Mode SS | |||
|---|---|---|---|
| Quadrant | BADHDUFLAG | Total packets | Discarded packets |
| A | 0 | 118 | 0 |
| B | 0 | 118 | 0 |
| C | 0 | 118 | 0 |
| D | 0 | 118 | 0 |
| Quadrant | Total seconds | Saturated seconds | Saturation percentage |
|---|---|---|---|
| A | 5811 | 97 | 1.669248% |
| B | 5811 | 251 | 4.319394% |
| C | 5811 | 59 | 1.015316% |
| D | 5811 | 104 | 1.789709% |
Noise dominated data is calculated using 1-second bins in cleaned event files. If a bin has >2000 counts, and if more than 50% of those come from <1% of pixels, then it is considered to be noise-dominated and hence unusable.
| Quadrant | # 1 sec bins | Bins with >0 counts | Bins with >2000 counts | High rate bins dominated by noise | Noise dominated (total time) | Noise dominated (detector-on time) | Marked lightcurve |
|---|---|---|---|---|---|---|---|
| A | 7051 | 5811 | 14 | 14 | 0.20% | 0.24% | 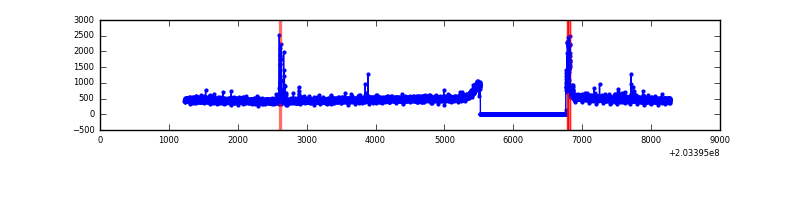 |
| B | 7051 | 5811 | 135 | 135 | 1.91% | 2.32% | 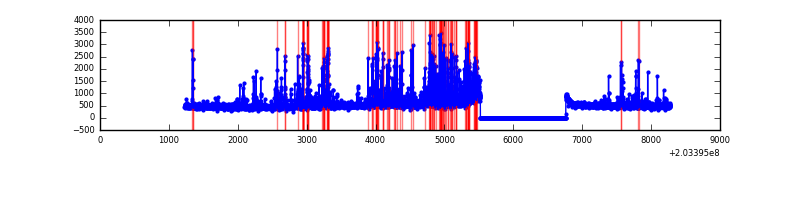 |
| C | 7051 | 5812 | 2 | 2 | 0.03% | 0.03% | 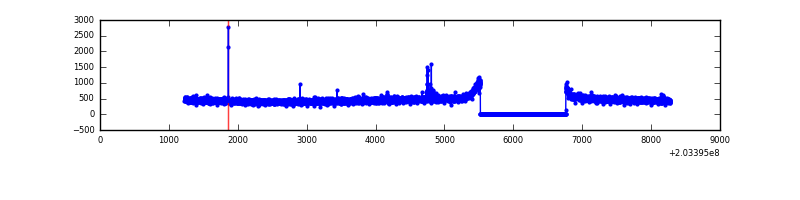 |
| D | 7051 | 5811 | 61 | 61 | 0.87% | 1.05% | 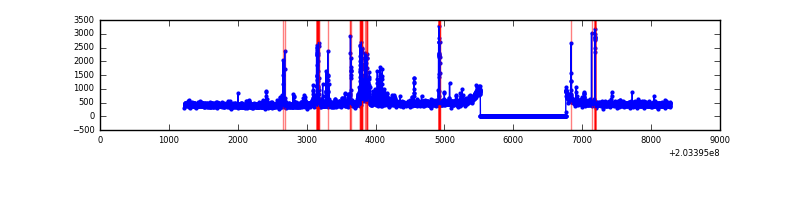 |
Top three noisy pixels from each quadrant. If the there are fewer than three noisy pixels in the level2.evt file, extra rows are filled as -1
| Pixel properties | Quadrant properties | ||||||
|---|---|---|---|---|---|---|---|
| Quadrant | DetID | PixID | Counts | Sigma | Mean | Median | Sigma |
| A | 13 | 251 | 57134 | 385.8 | 718 | 704 | 146.3 |
| A | 0 | 199 | 41010 | 275.57 | 718 | 704 | 146.3 |
| A | 0 | 226 | 10914 | 69.8 | 718 | 704 | 146.3 |
| B | 14 | 167 | 742284 | 5367.08 | 713 | 697 | 138.2 |
| B | 15 | 204 | 47976 | 342.17 | 713 | 697 | 138.2 |
| B | 0 | 173 | 37509 | 266.42 | 713 | 697 | 138.2 |
| C | 9 | 247 | 14252 | 84.78 | 684 | 690 | 160.0 |
| C | 8 | 128 | 8589 | 49.38 | 684 | 690 | 160.0 |
| C | 1 | 16 | 6341 | 35.33 | 684 | 690 | 160.0 |
| D | 14 | 34 | 171761 | 1022.58 | 684 | 664 | 167.3 |
| D | 13 | 223 | 76190 | 451.39 | 684 | 664 | 167.3 |
| D | 8 | 112 | 46051 | 271.26 | 684 | 664 | 167.3 |
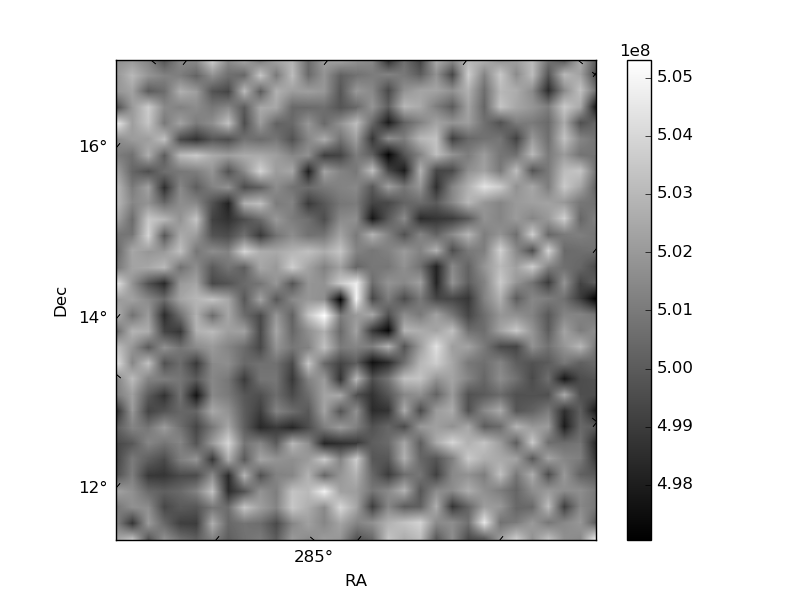
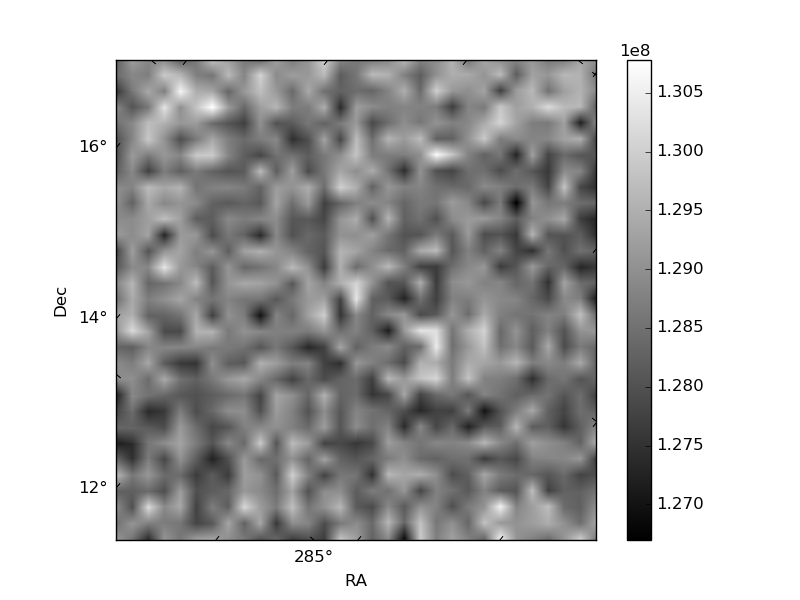
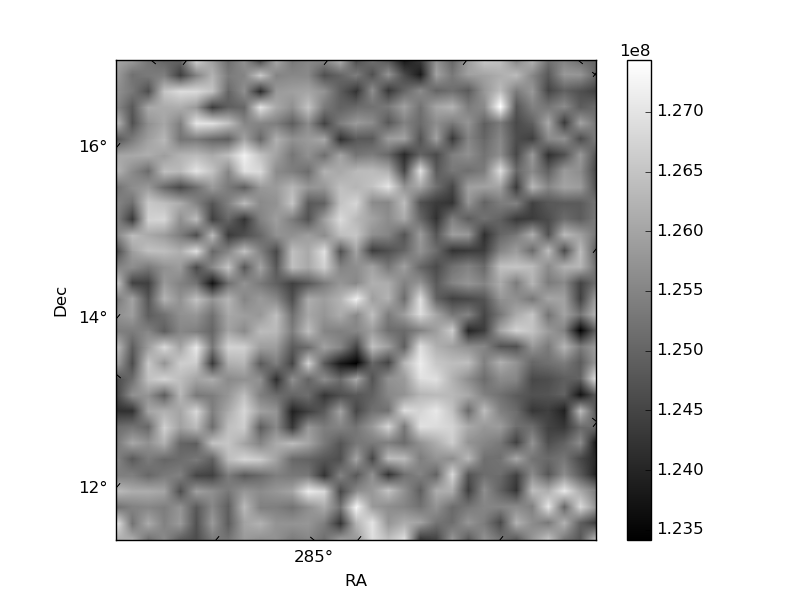
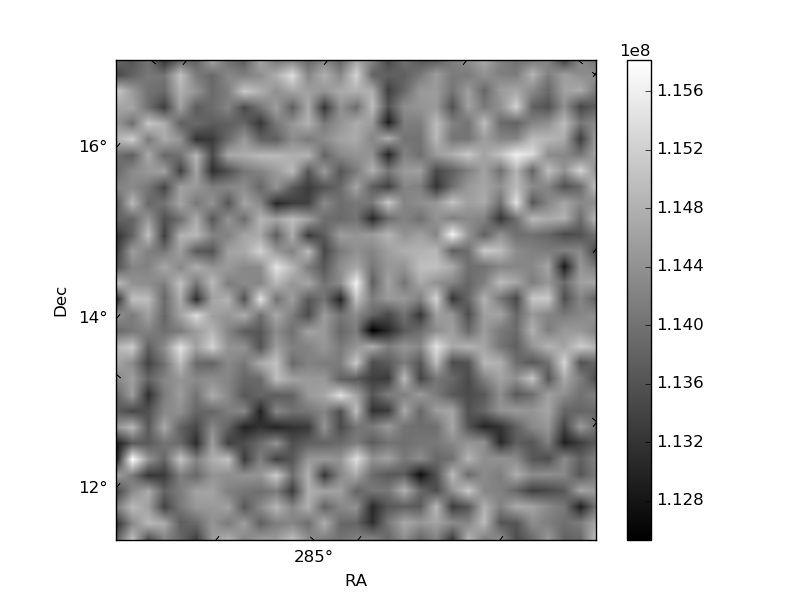
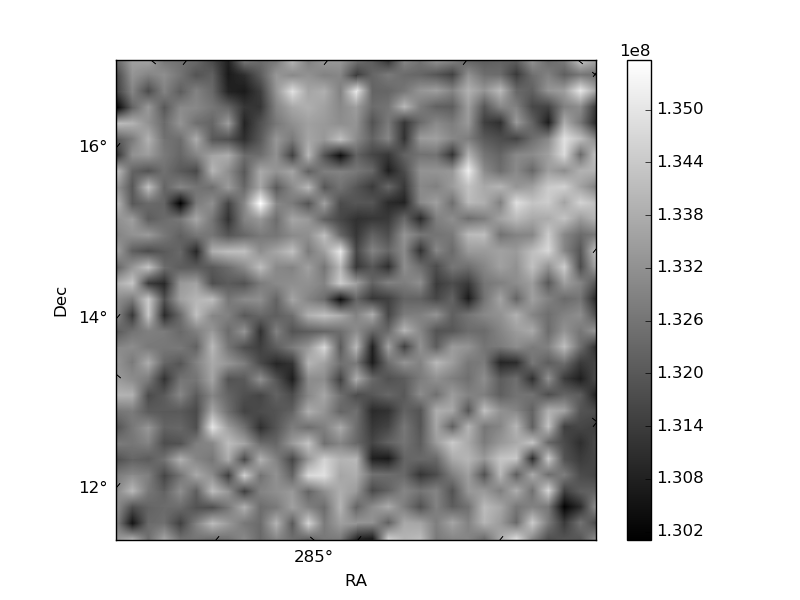
Histogram calculated using DETX and DETY for each event in the final _common_clean file
| Quadrant A | 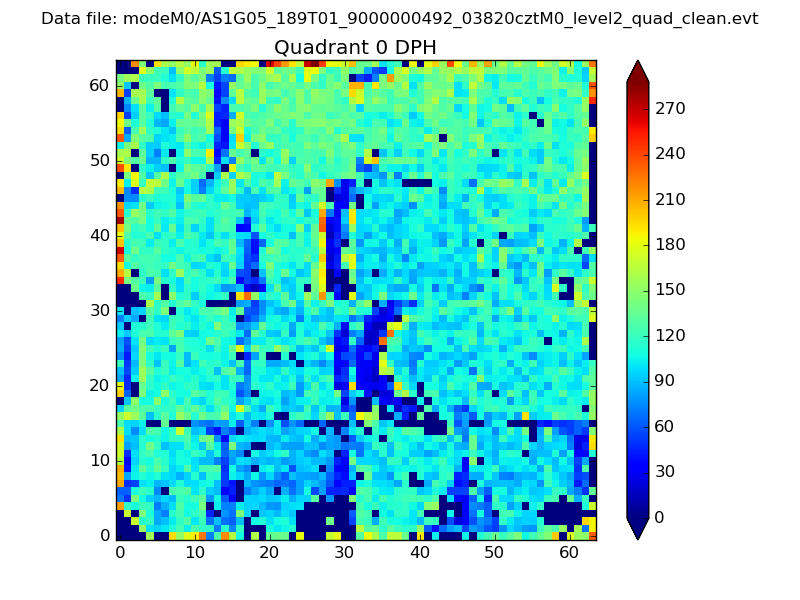 |
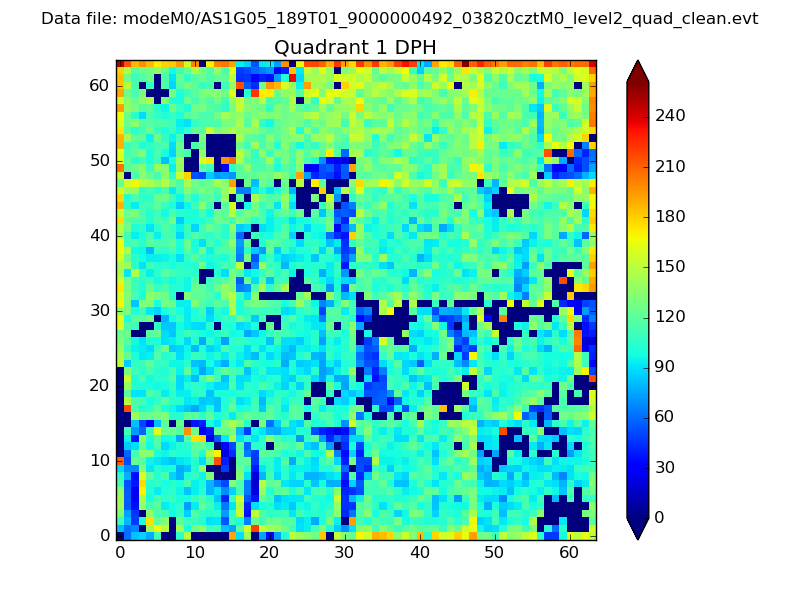 |
Quadrant B |
|---|---|---|---|
| Quadrant D | 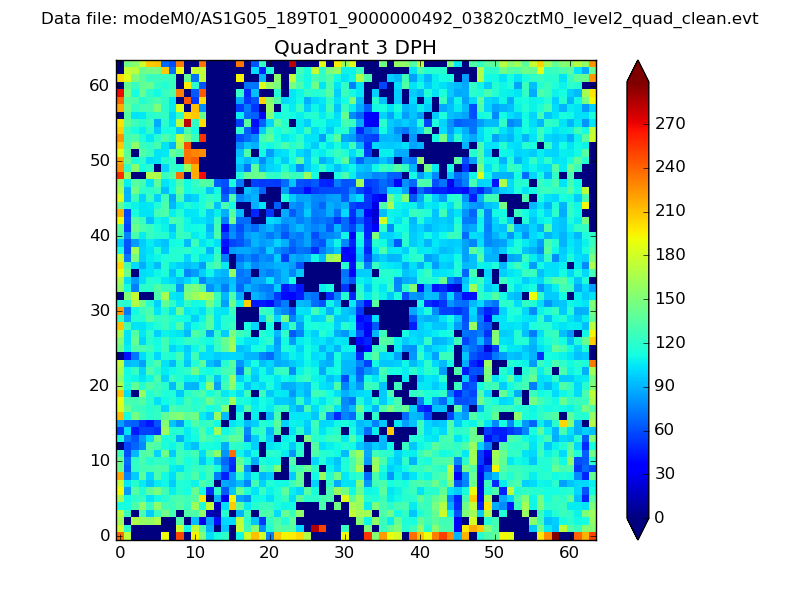 |
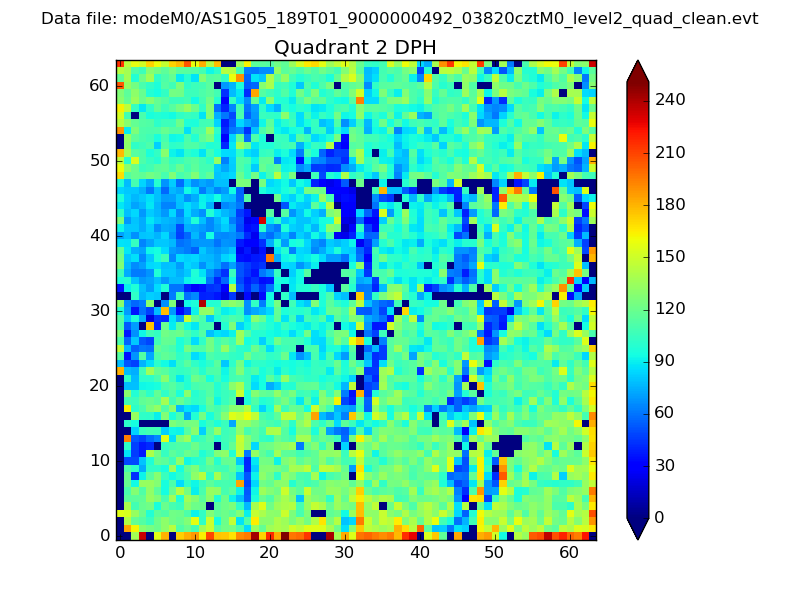 |
Quadrant C |
| Plot type | Count rate plots | Images |
|---|---|---|
| Comparison with Poisson distribution Blue bars denote a histogram of data divided into 1 sec bins. Red curve is a Poisson curve with rate = median count rate of data. |
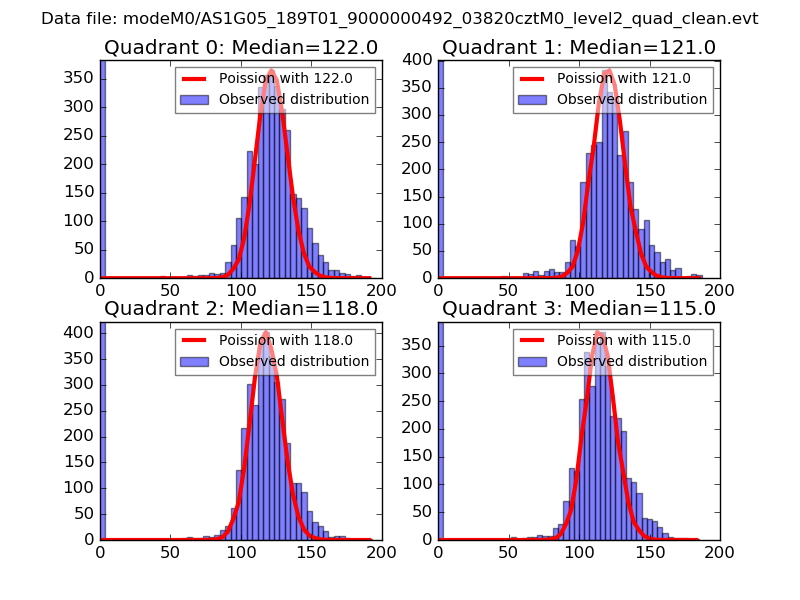 |
 |
| Quadrant-wise count rates Data is divided into 100 sec bins |
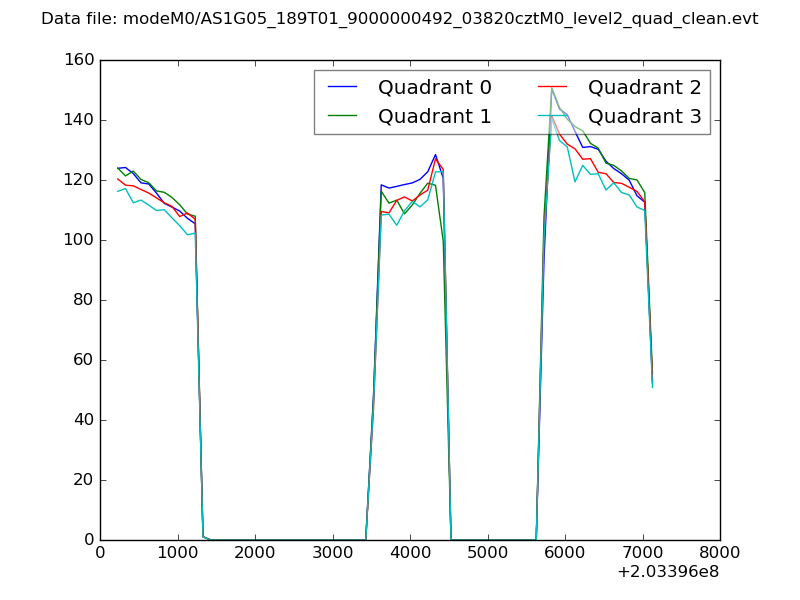 |
|
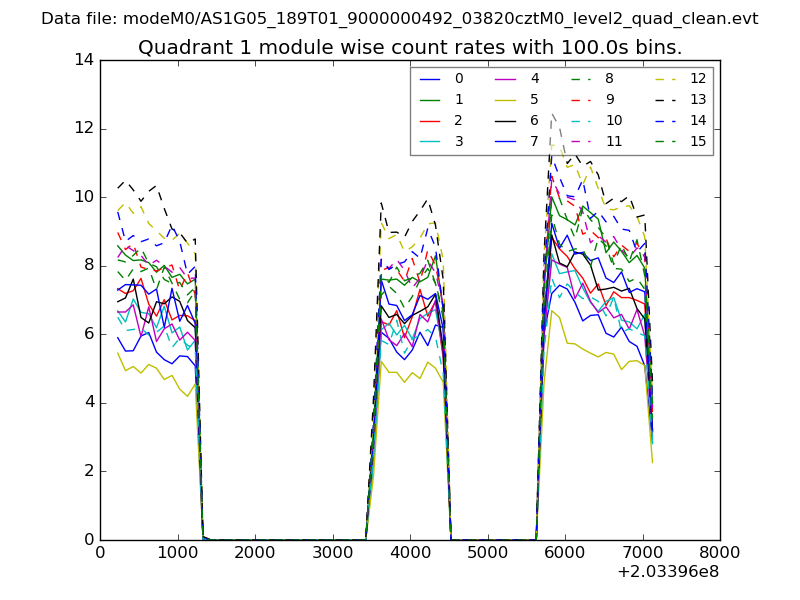
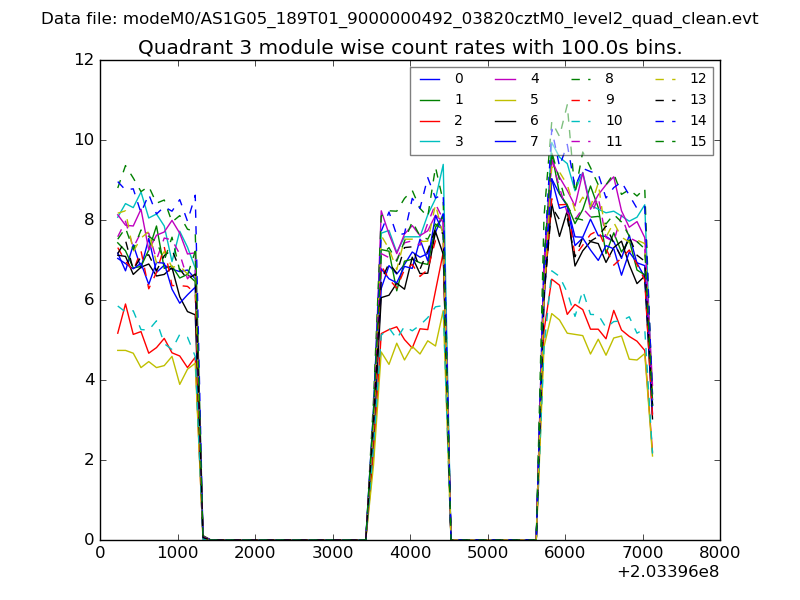
| Module-wise count rates for Quadrant A Data is divided into 100 sec bins |
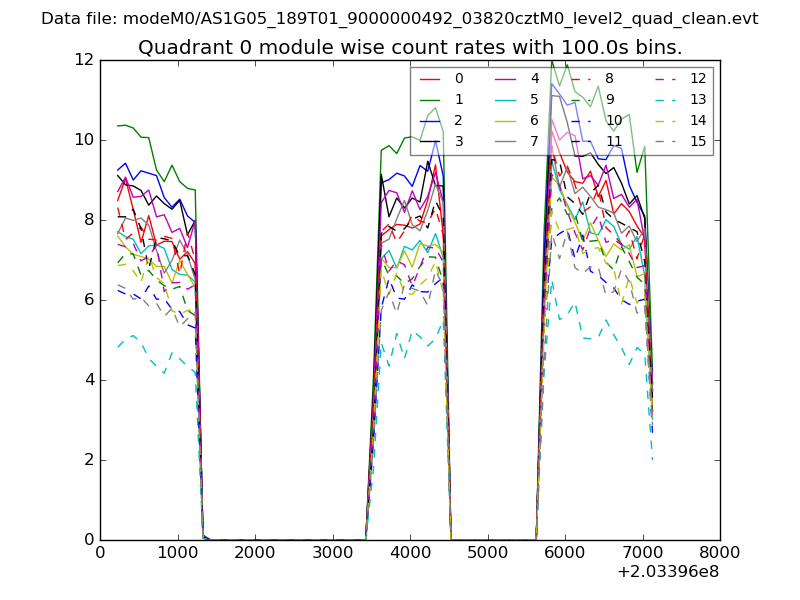 |
 |
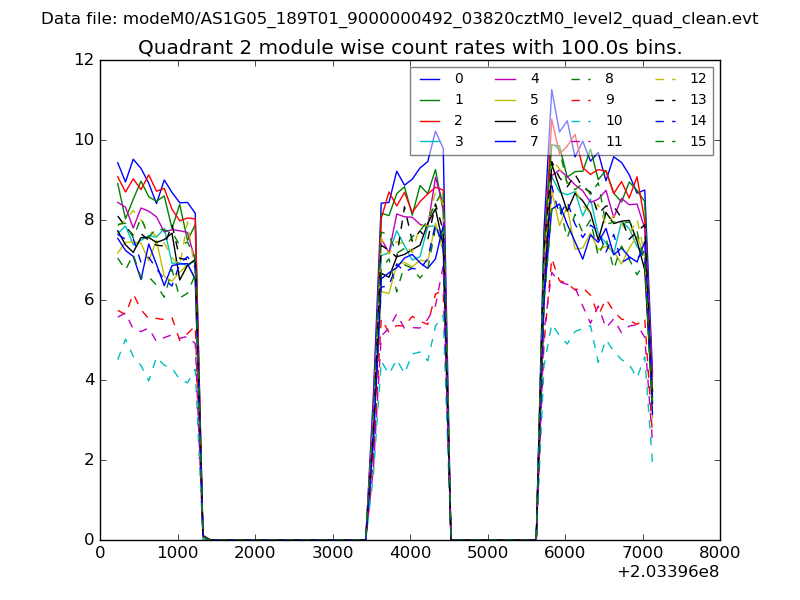
| Module-wise count rates for Quadrant B Data is divided into 100 sec bins |
 |
 |
| Module-wise count rates for Quadrant C Data is divided into 100 sec bins |
 |
 |
| Module-wise count rates for Quadrant D Data is divided into 100 sec bins |
 |
 |
| Parameter | Plot |
|---|---|
| CZT HV Monitor | 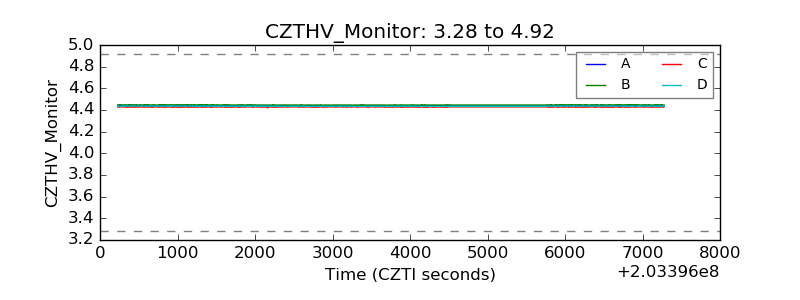 |
| D_VDD | 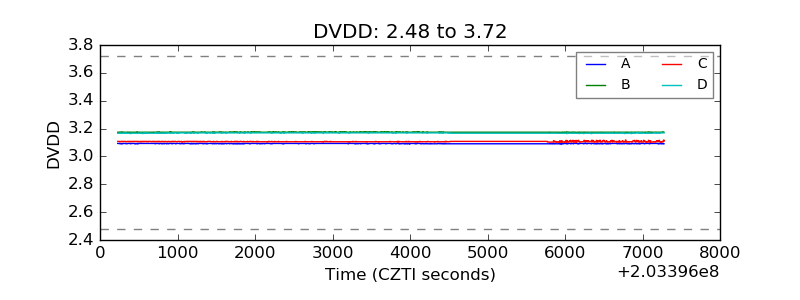 |
| Temperature 1 | 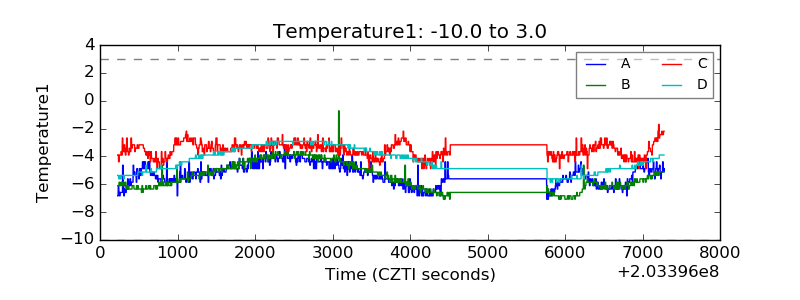 |
| Veto HV Monitor | 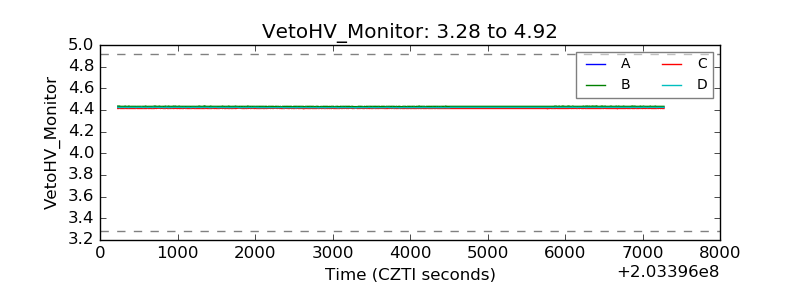 |
| Veto LLD | 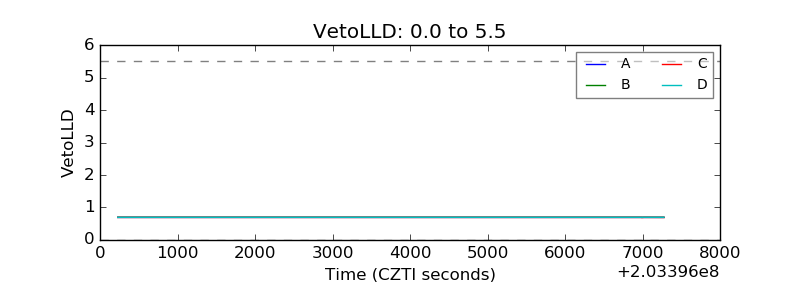 |
| Alpha Counter | 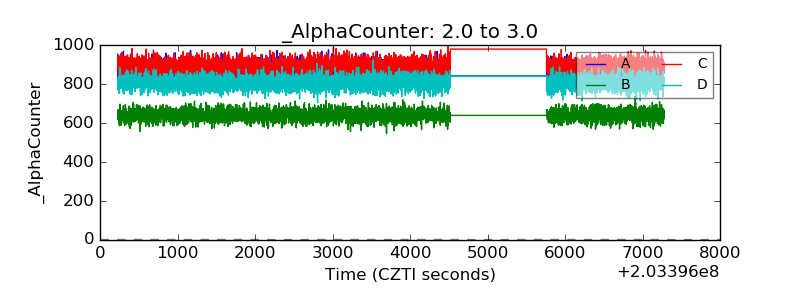 |
| _CPM_Rate | 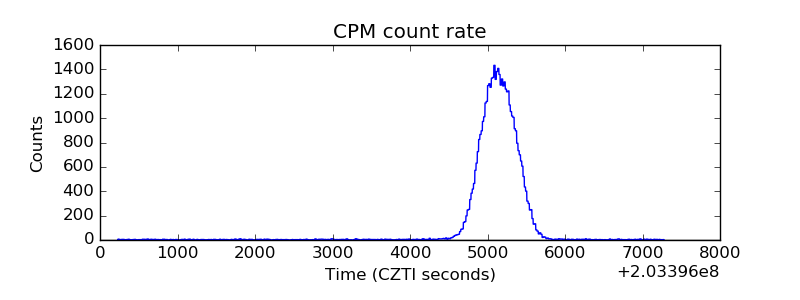 |
| CZT Counter | 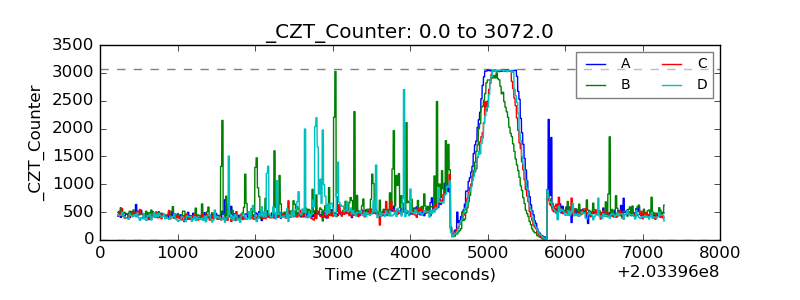 |
| +2.5 Volts monitor |  |
| +5 Volts monitor |  |
| _ROLL_ROT | 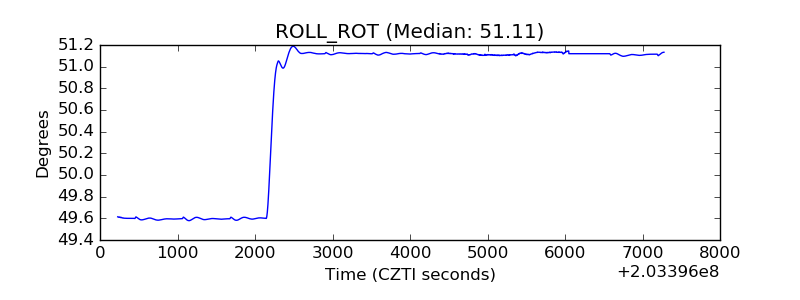 |
| _Roll_DEC | 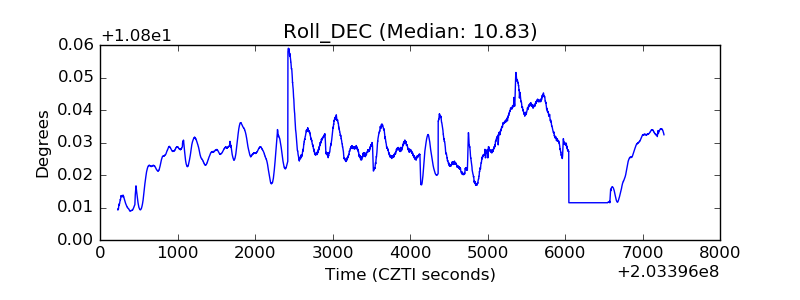 |
| _Roll_RA | 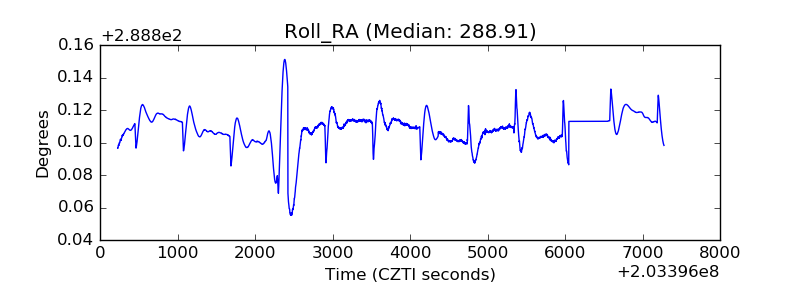 |
| Veto Counter | 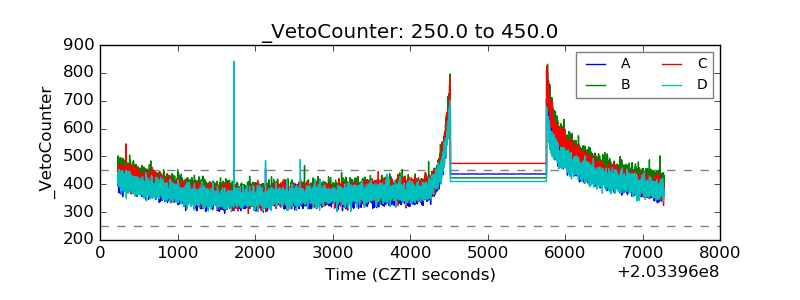 |