| Param | Original file | Final file |
|---|---|---|
| Filename | modeM0/AS1G05_189T01_9000000492_03822cztM0_level2.evt | modeM0/AS1G05_189T01_9000000492_03822cztM0_level2_quad_clean.evt |
| Size (bytes) | 484,257,600 | 68,506,560 |
| Size | 461.8 MB | 65.3 MB |
| Events in quadrant A | 3,185,744 | 414,141 |
| Events in quadrant B | 4,090,129 | 413,765 |
| Events in quadrant C | 3,102,485 | 403,304 |
| Events in quadrant D | 3,846,085 | 389,608 |
| Mode M0 | |||
|---|---|---|---|
| Quadrant | BADHDUFLAG | Total packets | Discarded packets |
| A | 0 | 13551 | 2 |
| B | 0 | 16162 | 1 |
| C | 0 | 13543 | 1 |
| D | 0 | 15879 | 1 |
| Mode M9 | |||
|---|---|---|---|
| Quadrant | BADHDUFLAG | Total packets | Discarded packets |
| A | 0 | 12 | 0 |
| B | 0 | 12 | 0 |
| C | 0 | 12 | 0 |
| D | 0 | 12 | 0 |
| Mode SS | |||
|---|---|---|---|
| Quadrant | BADHDUFLAG | Total packets | Discarded packets |
| A | 0 | 130 | 0 |
| B | 0 | 130 | 0 |
| C | 0 | 130 | 0 |
| D | 0 | 130 | 0 |
| Quadrant | Total seconds | Saturated seconds | Saturation percentage |
|---|---|---|---|
| A | 6504 | 119 | 1.829643% |
| B | 6504 | 239 | 3.674662% |
| C | 6504 | 78 | 1.199262% |
| D | 6504 | 269 | 4.135916% |
Noise dominated data is calculated using 1-second bins in cleaned event files. If a bin has >2000 counts, and if more than 50% of those come from <1% of pixels, then it is considered to be noise-dominated and hence unusable.
| Quadrant | # 1 sec bins | Bins with >0 counts | Bins with >2000 counts | High rate bins dominated by noise | Noise dominated (total time) | Noise dominated (detector-on time) | Marked lightcurve |
|---|---|---|---|---|---|---|---|
| A | 7669 | 6504 | 8 | 8 | 0.10% | 0.12% | 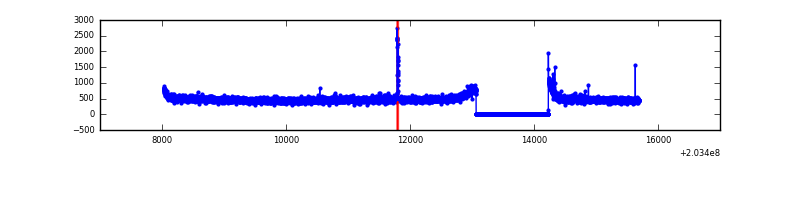 |
| B | 7669 | 6504 | 97 | 97 | 1.26% | 1.49% | 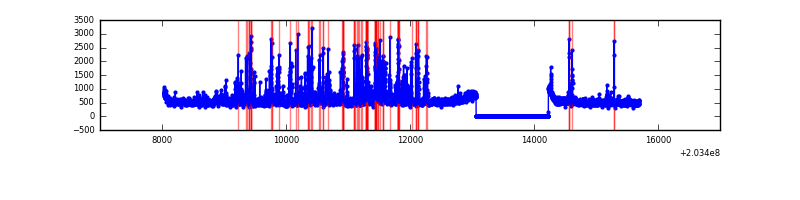 |
| C | 7669 | 6504 | 1 | 1 | 0.01% | 0.02% | 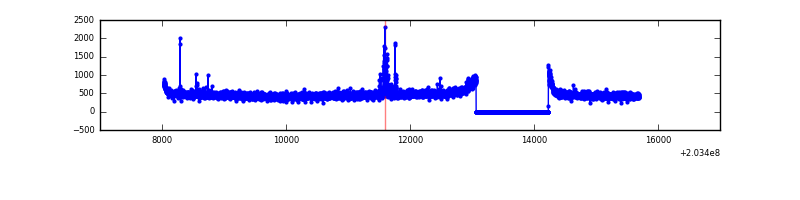 |
| D | 7669 | 6504 | 191 | 191 | 2.49% | 2.94% | 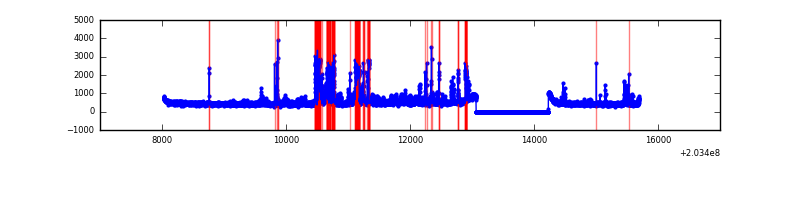 |
Top three noisy pixels from each quadrant. If the there are fewer than three noisy pixels in the level2.evt file, extra rows are filled as -1
| Pixel properties | Quadrant properties | ||||||
|---|---|---|---|---|---|---|---|
| Quadrant | DetID | PixID | Counts | Sigma | Mean | Median | Sigma |
| A | 13 | 251 | 38958 | 228.76 | 813 | 798 | 166.8 |
| A | 8 | 15 | 11016 | 61.25 | 813 | 798 | 166.8 |
| A | 0 | 226 | 8707 | 47.41 | 813 | 798 | 166.8 |
| B | 14 | 167 | 560565 | 3546.87 | 814 | 795 | 157.8 |
| B | 15 | 204 | 286968 | 1813.28 | 814 | 795 | 157.8 |
| B | 10 | 16 | 43441 | 270.22 | 814 | 795 | 157.8 |
| C | 9 | 247 | 42713 | 232.7 | 775 | 781 | 180.2 |
| C | 2 | 53 | 8983 | 45.52 | 775 | 781 | 180.2 |
| C | 10 | 65 | 7882 | 39.41 | 775 | 781 | 180.2 |
| D | 14 | 34 | 341874 | 1836.13 | 773 | 750 | 185.8 |
| D | 12 | 227 | 269440 | 1446.25 | 773 | 750 | 185.8 |
| D | 8 | 112 | 178300 | 955.68 | 773 | 750 | 185.8 |
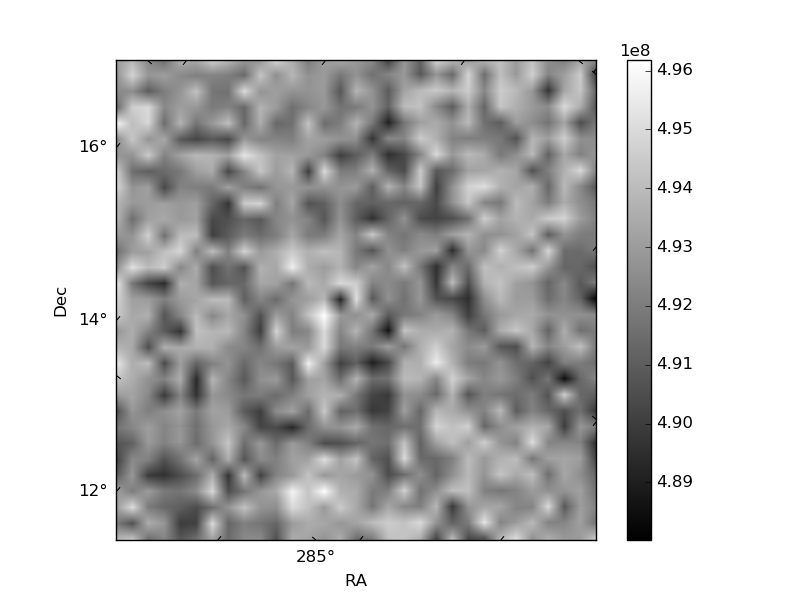
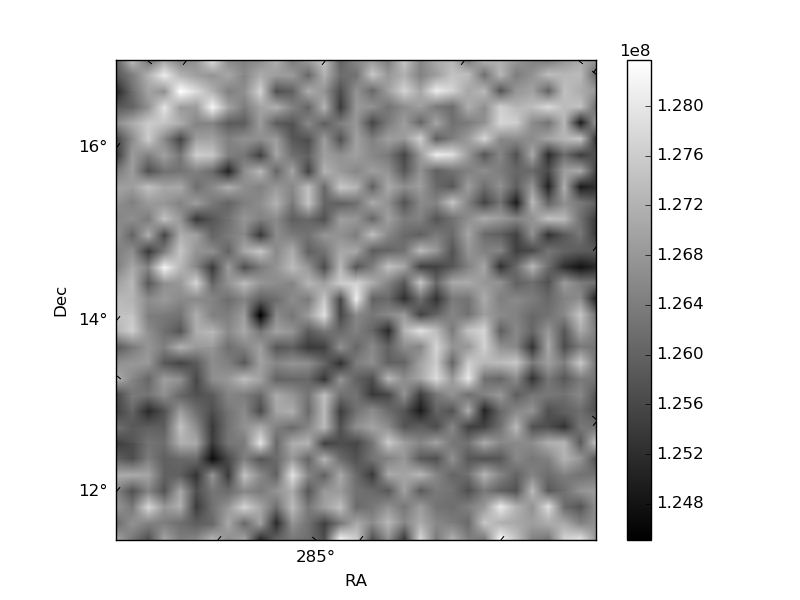
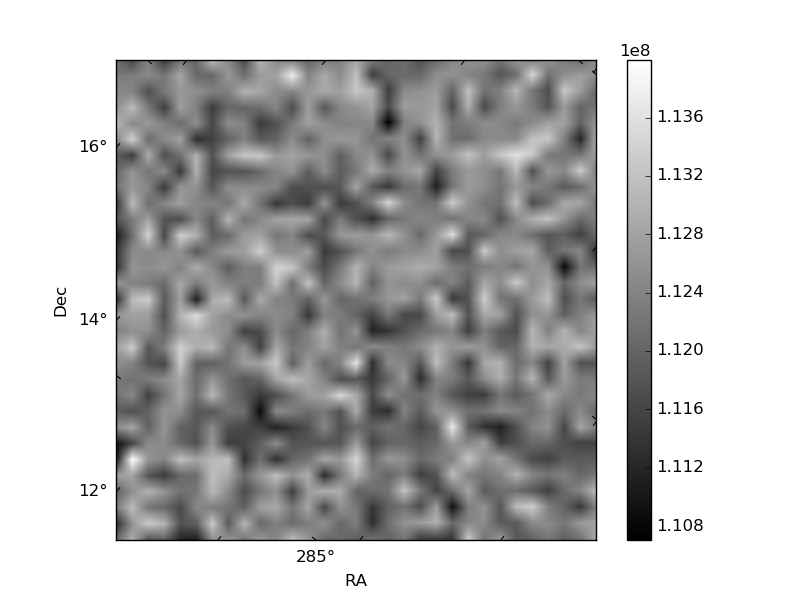
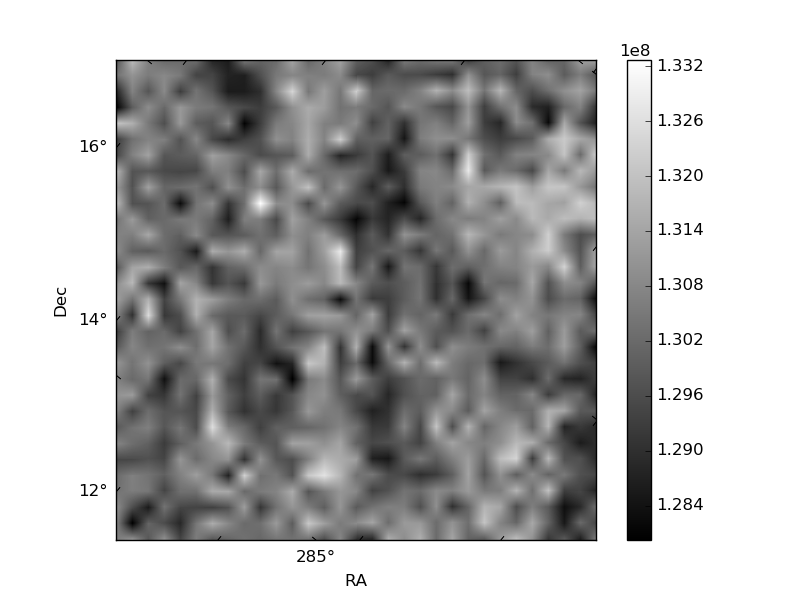
Histogram calculated using DETX and DETY for each event in the final _common_clean file
| Quadrant A | 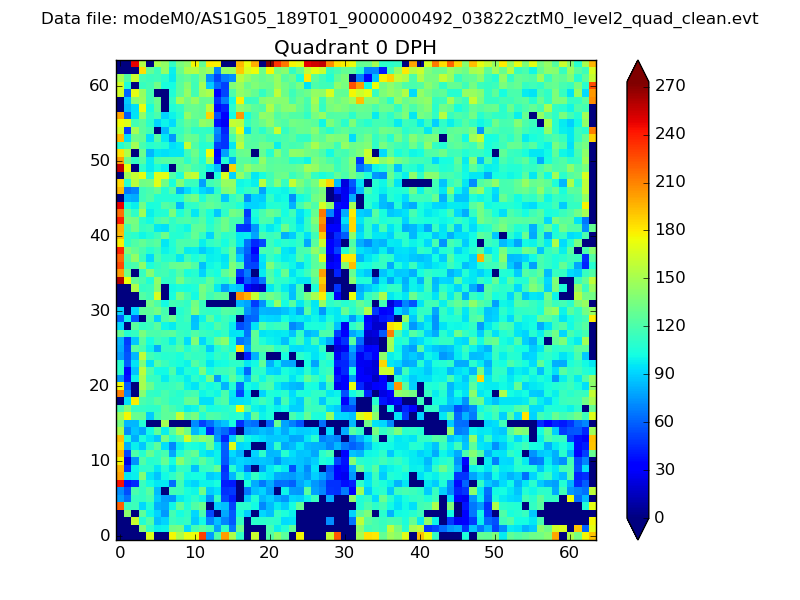 |
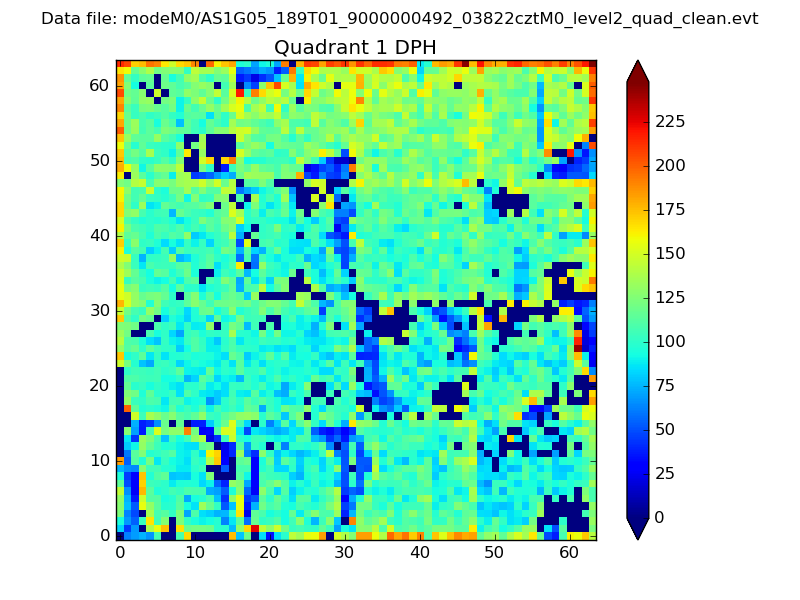 |
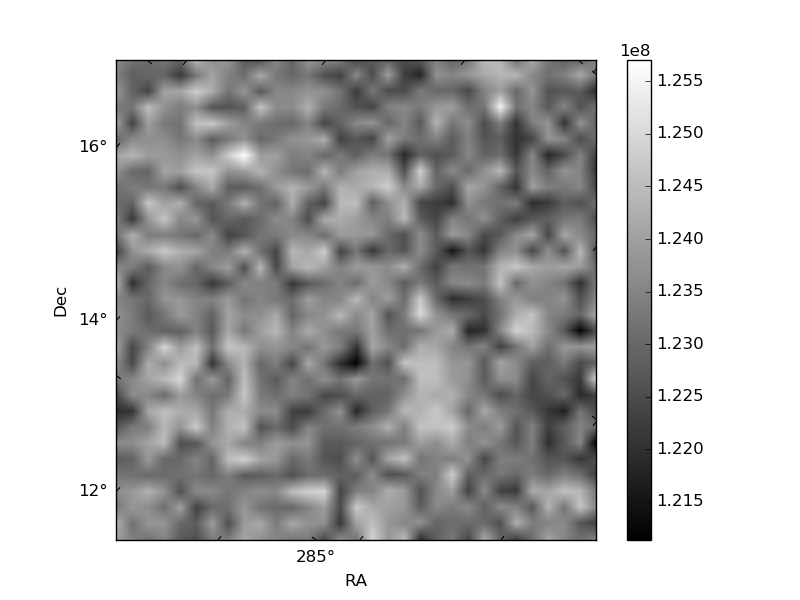
Quadrant B |
|---|---|---|---|
| Quadrant D | 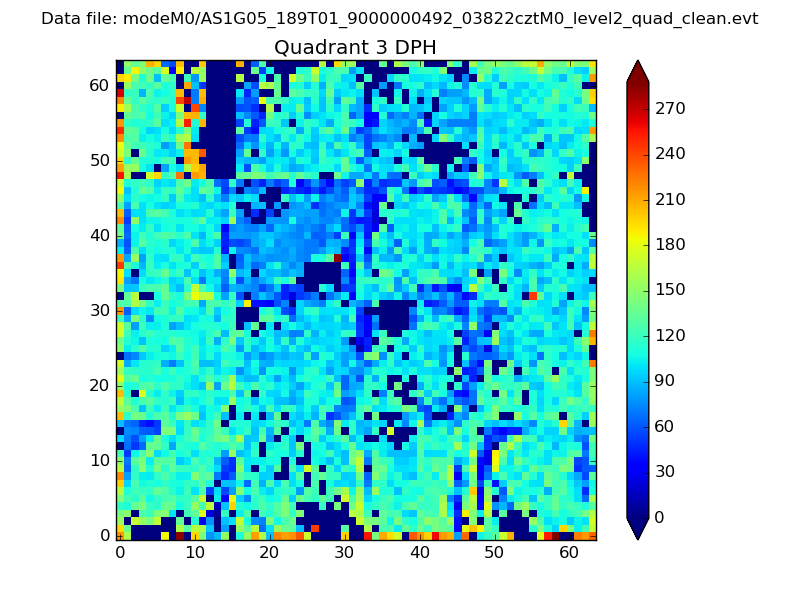 |
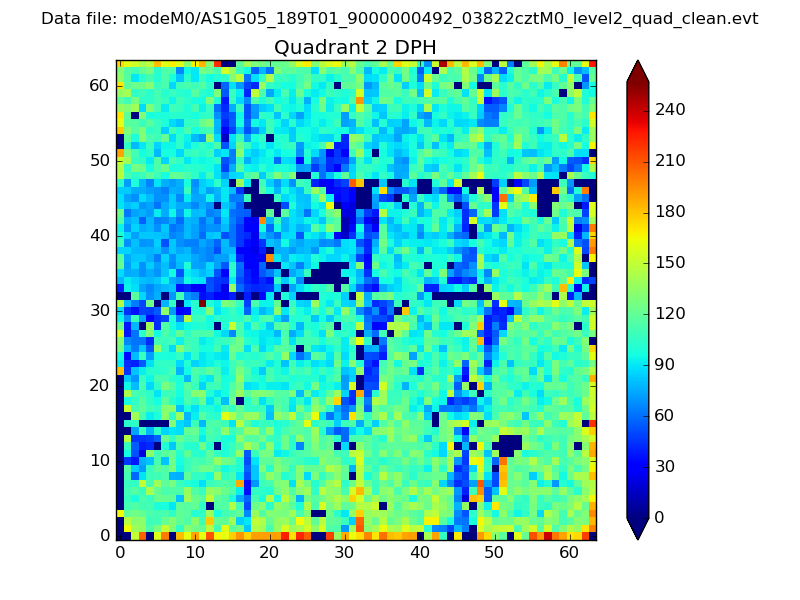 |
Quadrant C |
| Plot type | Count rate plots | Images |
|---|---|---|
| Comparison with Poisson distribution Blue bars denote a histogram of data divided into 1 sec bins. Red curve is a Poisson curve with rate = median count rate of data. |
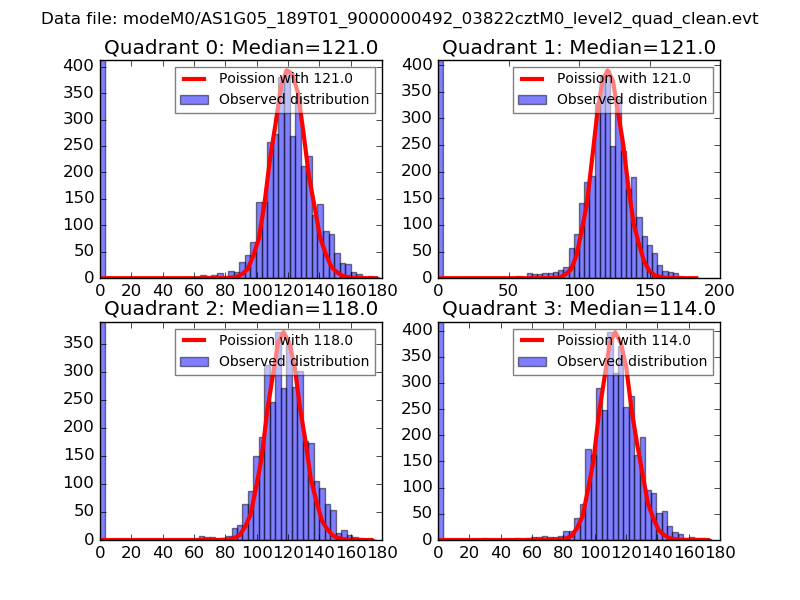 |
 |
| Quadrant-wise count rates Data is divided into 100 sec bins |
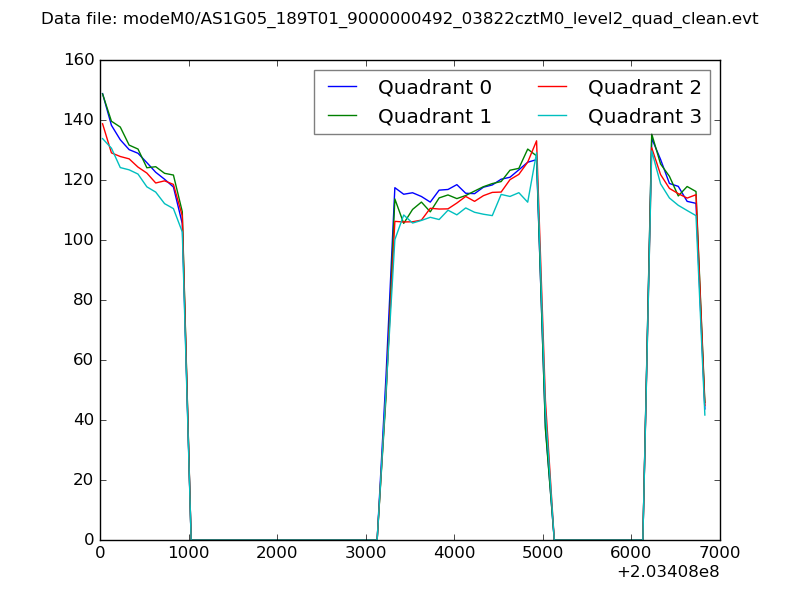 |
|
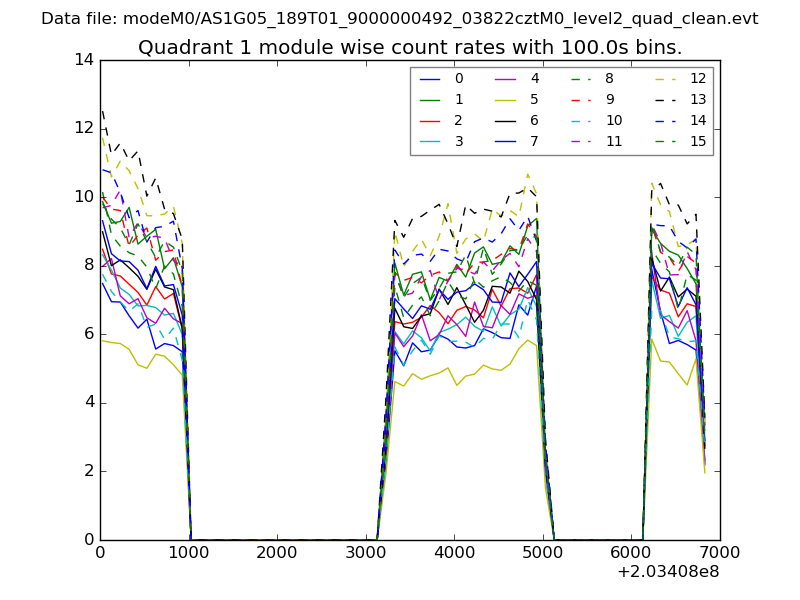
| Module-wise count rates for Quadrant A Data is divided into 100 sec bins |
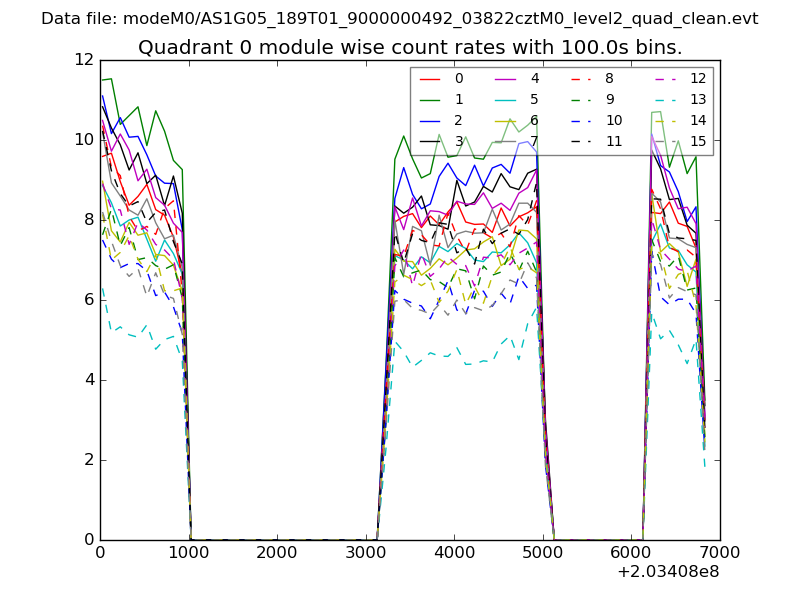 |
 |
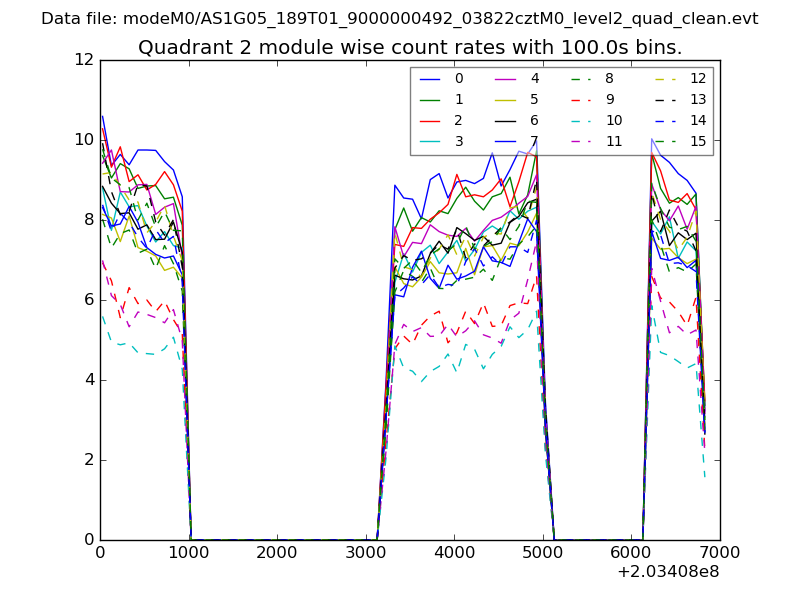
| Module-wise count rates for Quadrant B Data is divided into 100 sec bins |
 |
 |
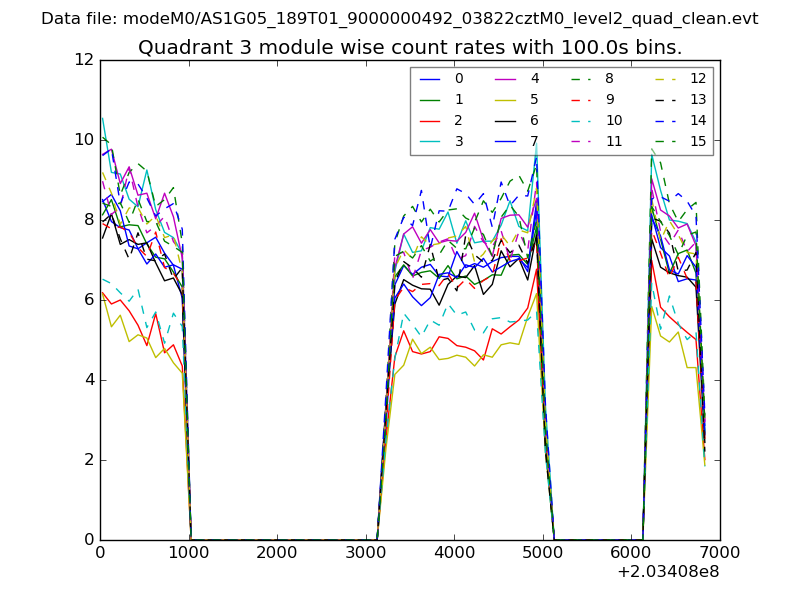
| Module-wise count rates for Quadrant C Data is divided into 100 sec bins |
 |
 |
| Module-wise count rates for Quadrant D Data is divided into 100 sec bins |
 |
 |
| Parameter | Plot |
|---|---|
| CZT HV Monitor | 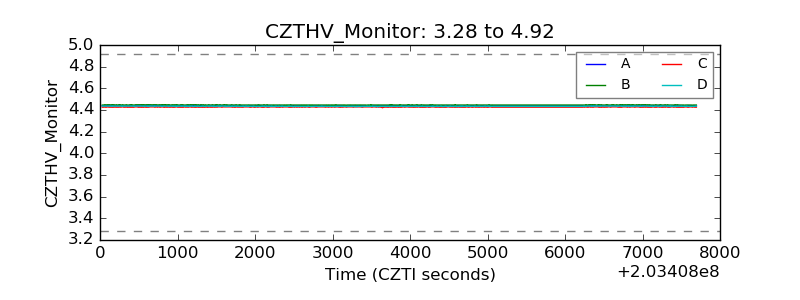 |
| D_VDD | 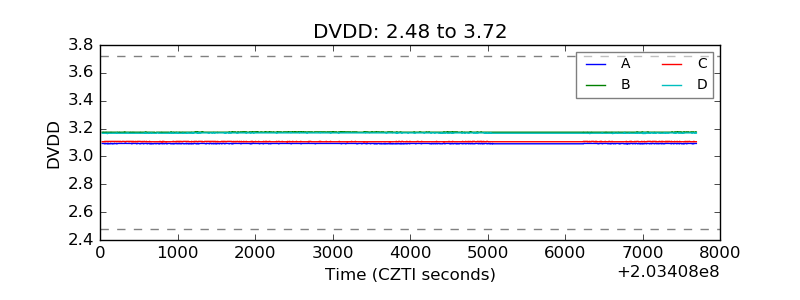 |
| Temperature 1 | 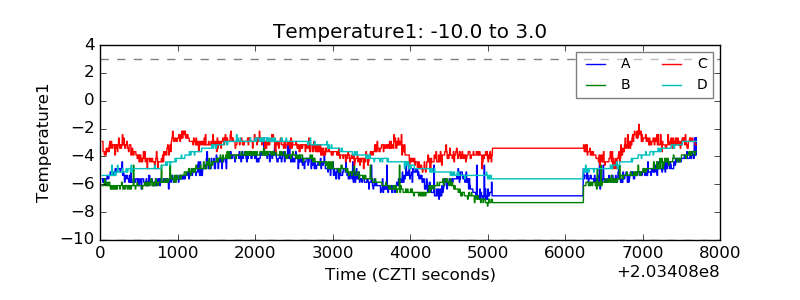 |
| Veto HV Monitor | 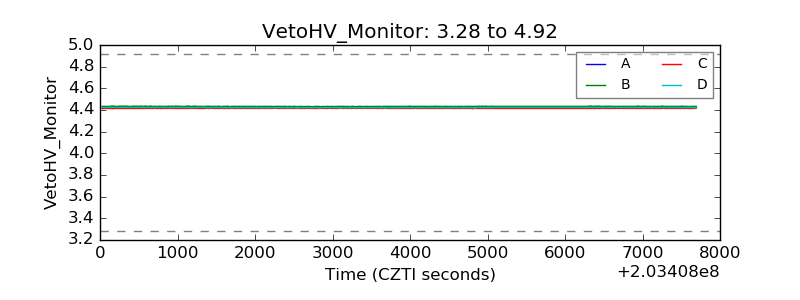 |
| Veto LLD | 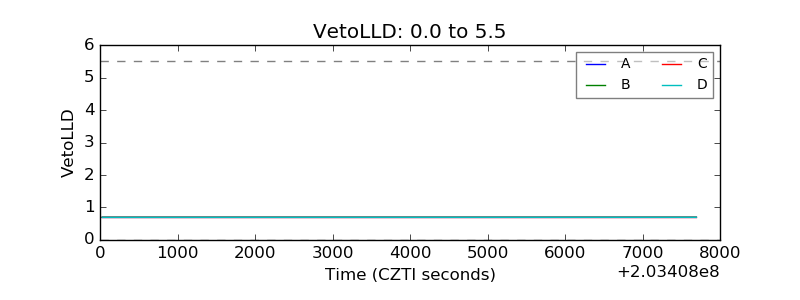 |
| Alpha Counter | 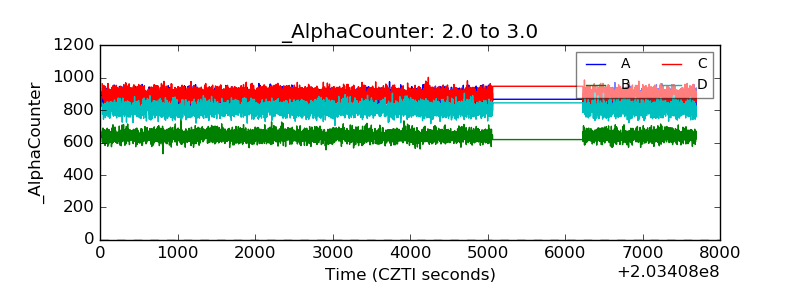 |
| _CPM_Rate | 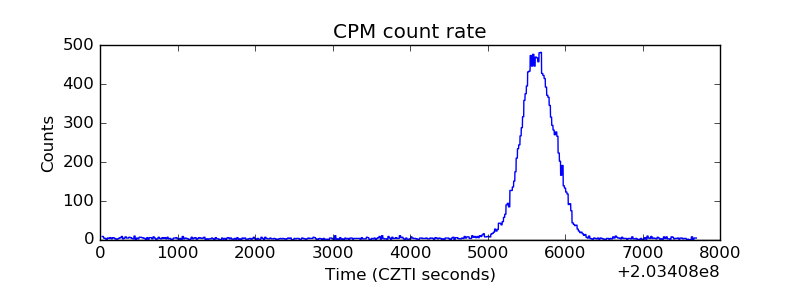 |
| CZT Counter | 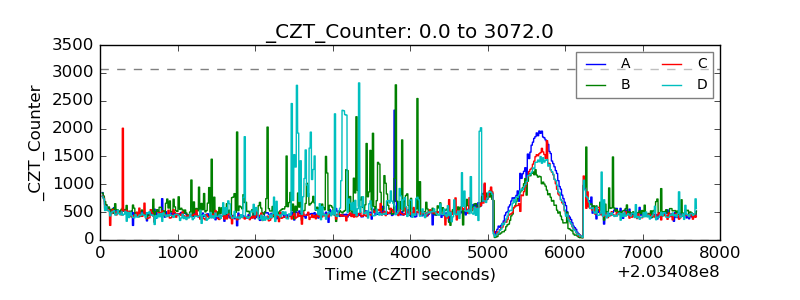 |
| +2.5 Volts monitor |  |
| +5 Volts monitor |  |
| _ROLL_ROT | 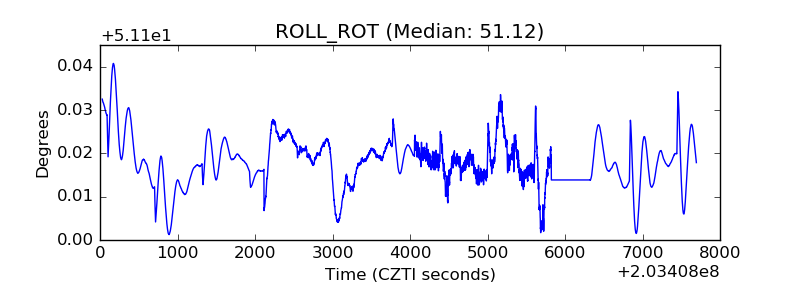 |
| _Roll_DEC | 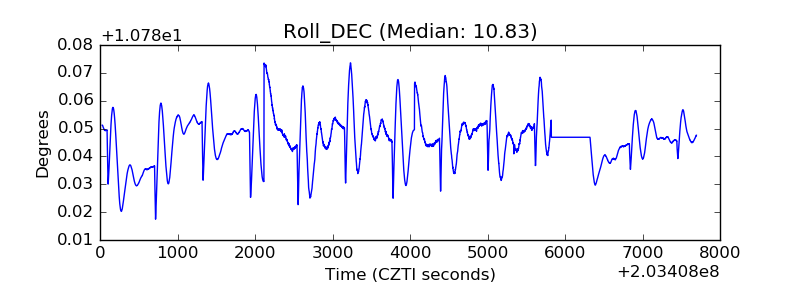 |
| _Roll_RA | 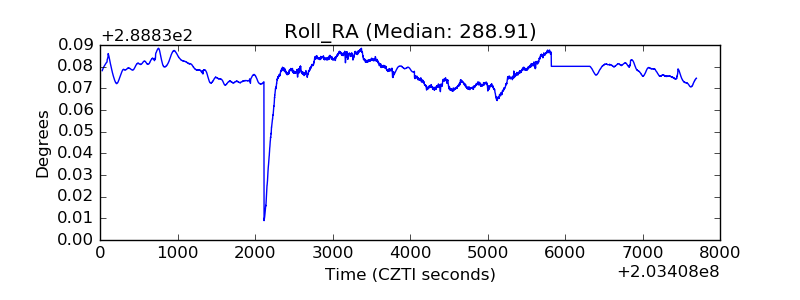 |
| Veto Counter | 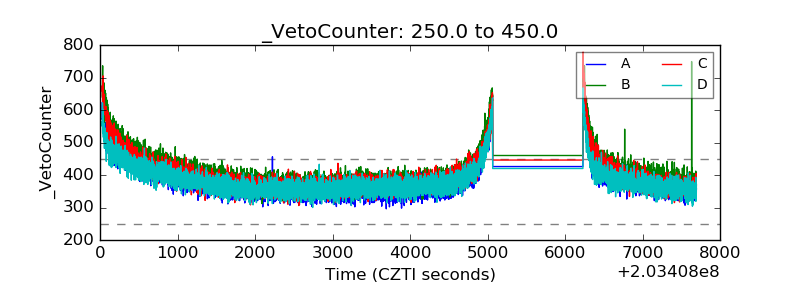 |