| Param | Original file | Final file |
|---|---|---|
| Filename | modeM0/AS1G05_189T01_9000000492_03824cztM0_level2.evt | modeM0/AS1G05_189T01_9000000492_03824cztM0_level2_quad_clean.evt |
| Size (bytes) | 537,736,320 | 64,707,840 |
| Size | 512.8 MB | 61.7 MB |
| Events in quadrant A | 3,665,514 | 374,394 |
| Events in quadrant B | 4,940,785 | 363,758 |
| Events in quadrant C | 3,407,428 | 364,158 |
| Events in quadrant D | 3,782,625 | 355,065 |
| Mode M0 | |||
|---|---|---|---|
| Quadrant | BADHDUFLAG | Total packets | Discarded packets |
| A | 0 | 15800 | 3 |
| B | 0 | 19472 | 2 |
| C | 0 | 15278 | 2 |
| D | 0 | 16391 | 2 |
| Mode M9 | |||
|---|---|---|---|
| Quadrant | BADHDUFLAG | Total packets | Discarded packets |
| A | 0 | 5 | 0 |
| B | 0 | 5 | 0 |
| C | 0 | 5 | 0 |
| D | 0 | 5 | 0 |
| Mode SS | |||
|---|---|---|---|
| Quadrant | BADHDUFLAG | Total packets | Discarded packets |
| A | 0 | 148 | 0 |
| B | 0 | 148 | 0 |
| C | 0 | 148 | 0 |
| D | 0 | 148 | 0 |
| Quadrant | Total seconds | Saturated seconds | Saturation percentage |
|---|---|---|---|
| A | 7196 | 231 | 3.210117% |
| B | 7196 | 461 | 6.406337% |
| C | 7196 | 162 | 2.251251% |
| D | 7197 | 160 | 2.223149% |
Noise dominated data is calculated using 1-second bins in cleaned event files. If a bin has >2000 counts, and if more than 50% of those come from <1% of pixels, then it is considered to be noise-dominated and hence unusable.
| Quadrant | # 1 sec bins | Bins with >0 counts | Bins with >2000 counts | High rate bins dominated by noise | Noise dominated (total time) | Noise dominated (detector-on time) | Marked lightcurve |
|---|---|---|---|---|---|---|---|
| A | 7751 | 7196 | 26 | 26 | 0.34% | 0.36% | 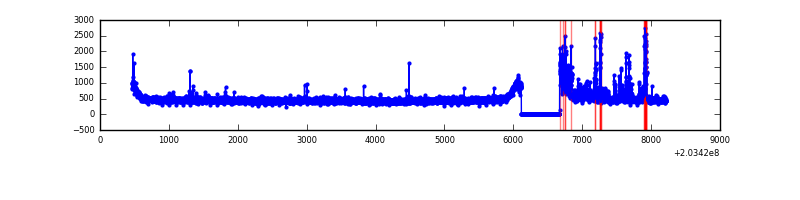 |
| B | 7750 | 7195 | 229 | 229 | 2.95% | 3.18% | 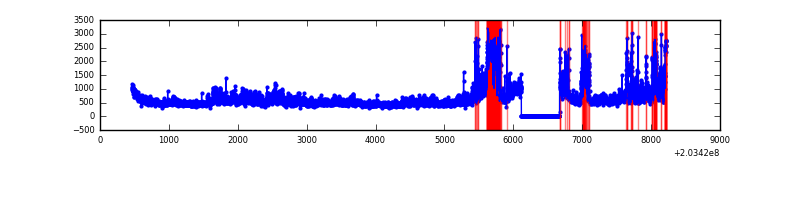 |
| C | 7751 | 7196 | 15 | 15 | 0.19% | 0.21% | 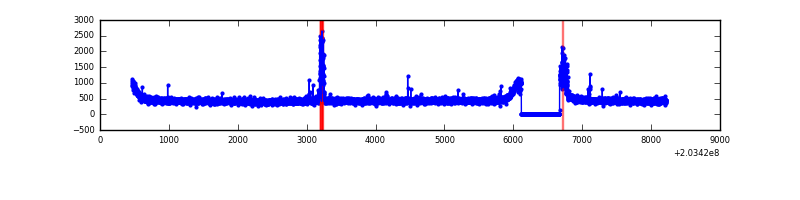 |
| D | 7752 | 7197 | 62 | 62 | 0.80% | 0.86% | 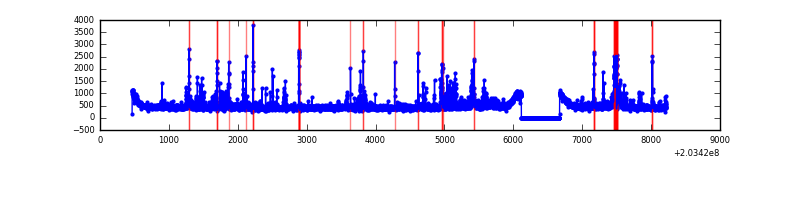 |
Top three noisy pixels from each quadrant. If the there are fewer than three noisy pixels in the level2.evt file, extra rows are filled as -1
| Pixel properties | Quadrant properties | ||||||
|---|---|---|---|---|---|---|---|
| Quadrant | DetID | PixID | Counts | Sigma | Mean | Median | Sigma |
| A | 0 | 199 | 268426 | 1499.59 | 867 | 849 | 178.4 |
| A | 0 | 226 | 33075 | 180.6 | 867 | 849 | 178.4 |
| A | 13 | 251 | 15893 | 84.31 | 867 | 849 | 178.4 |
| B | 10 | 16 | 878470 | 5139.35 | 864 | 843 | 170.8 |
| B | 15 | 204 | 627983 | 3672.51 | 864 | 843 | 170.8 |
| B | 10 | 246 | 40387 | 231.57 | 864 | 843 | 170.8 |
| C | 9 | 247 | 127693 | 644.0 | 832 | 835 | 197.0 |
| C | 1 | 241 | 10116 | 47.12 | 832 | 835 | 197.0 |
| C | 10 | 65 | 7961 | 36.18 | 832 | 835 | 197.0 |
| D | 14 | 34 | 178309 | 858.73 | 837 | 814 | 206.7 |
| D | 10 | 98 | 174926 | 842.37 | 837 | 814 | 206.7 |
| D | 11 | 132 | 105954 | 508.68 | 837 | 814 | 206.7 |
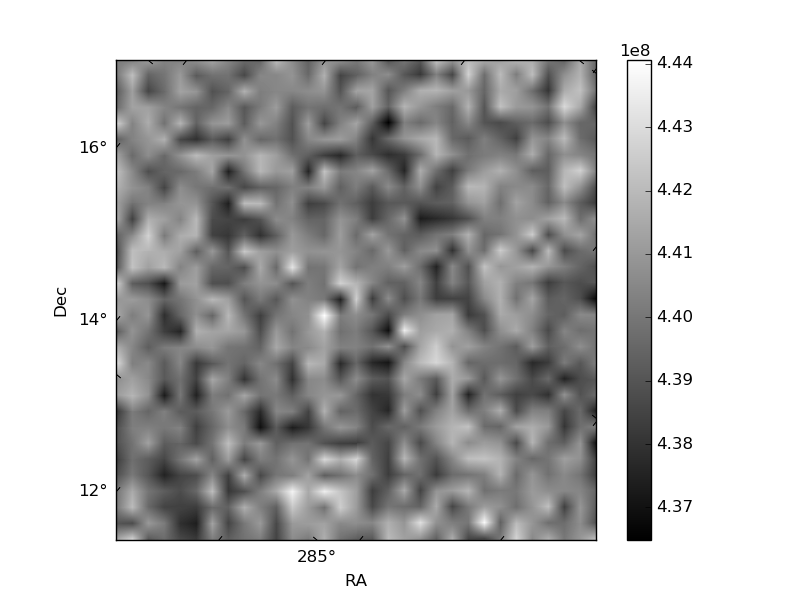
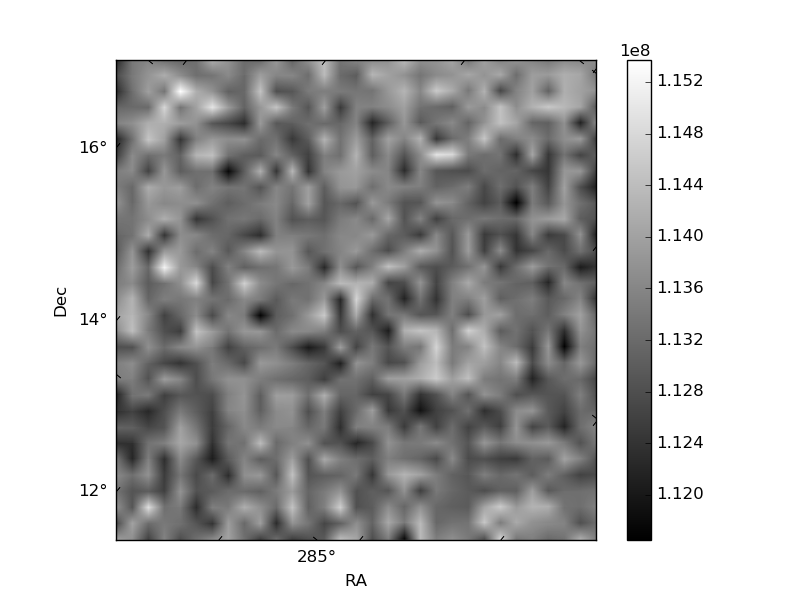
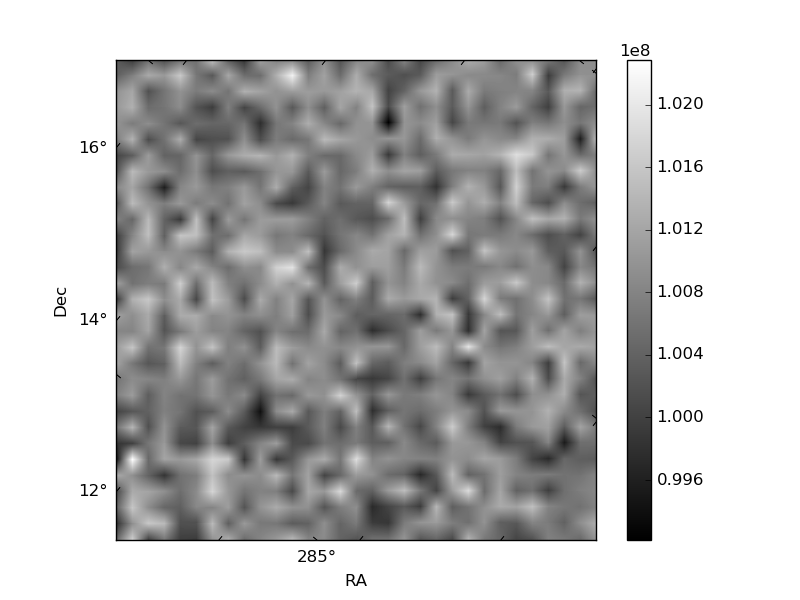
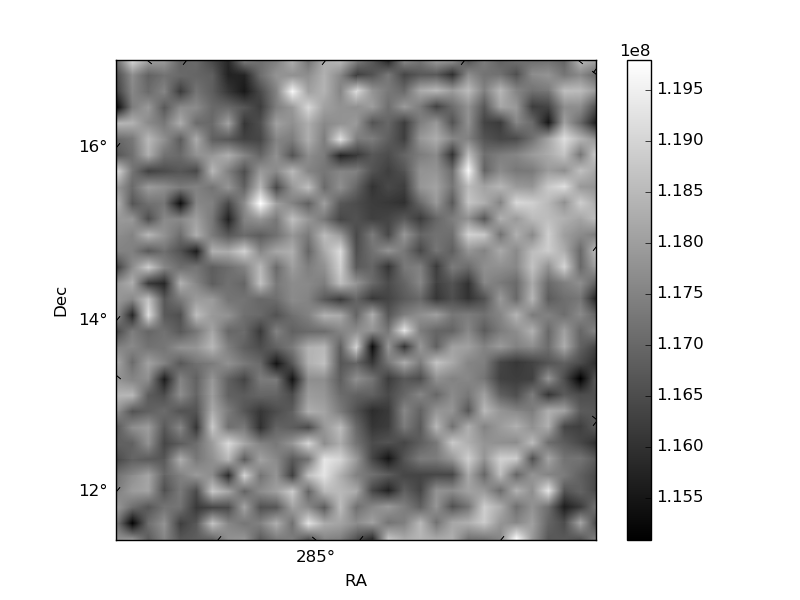
Histogram calculated using DETX and DETY for each event in the final _common_clean file
| Quadrant A | 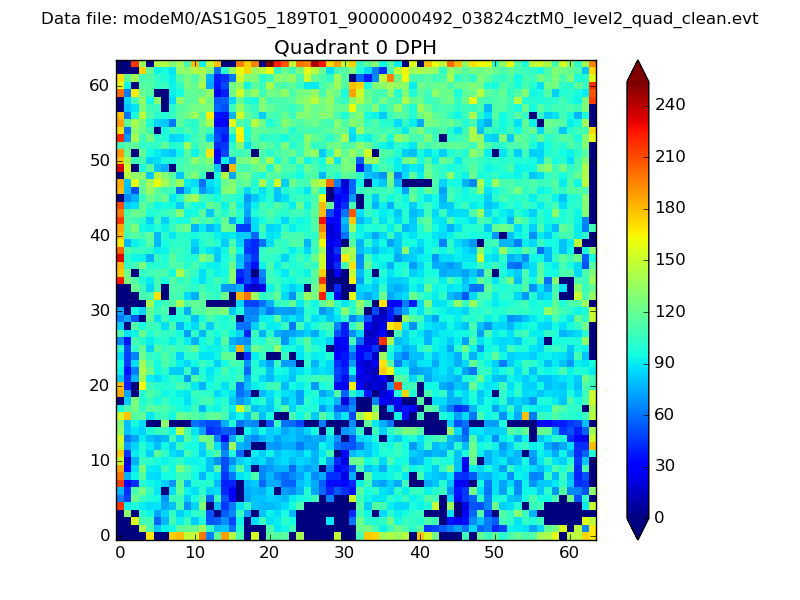 |
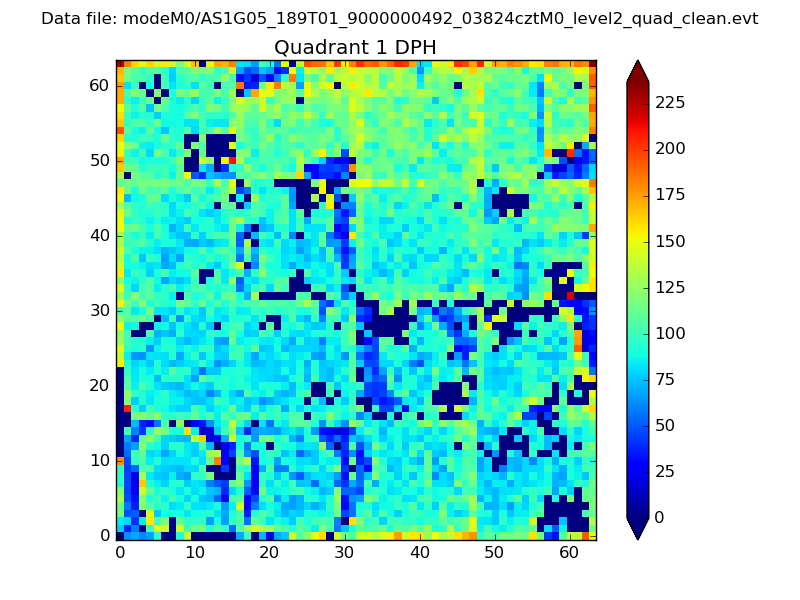 |
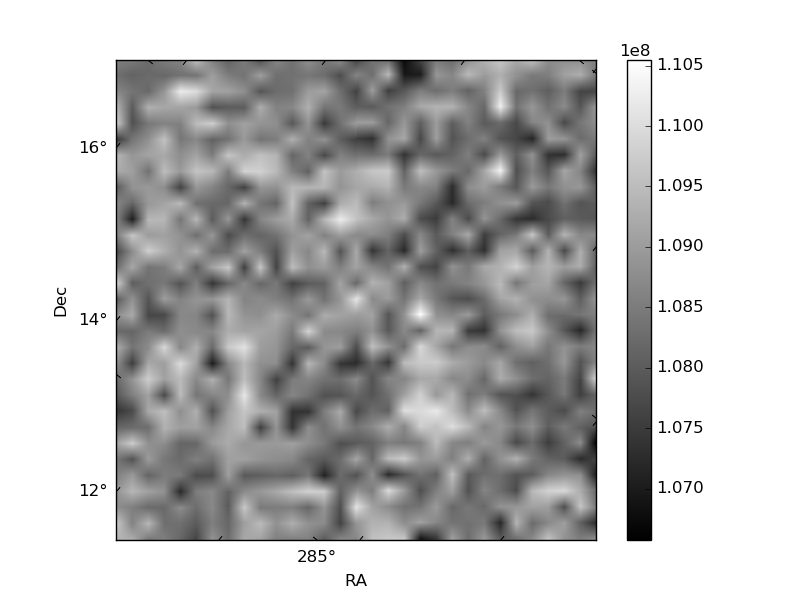
Quadrant B |
|---|---|---|---|
| Quadrant D | 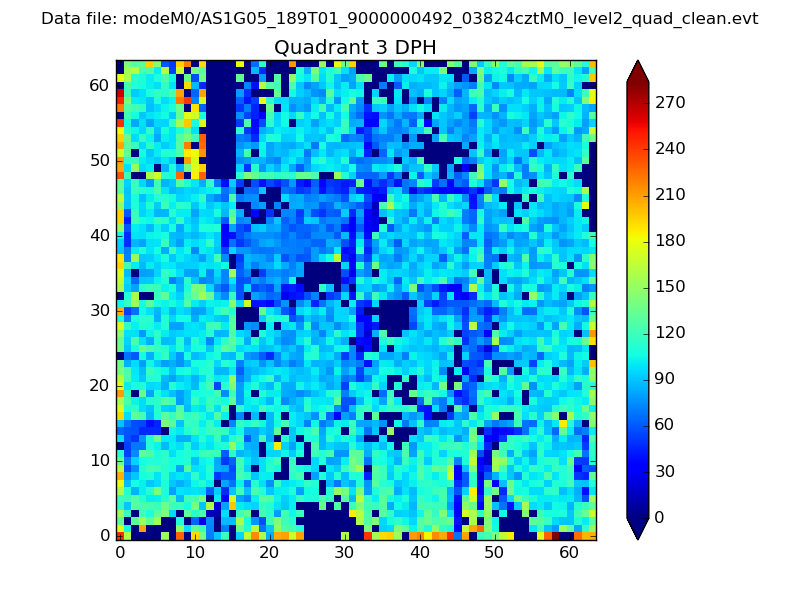 |
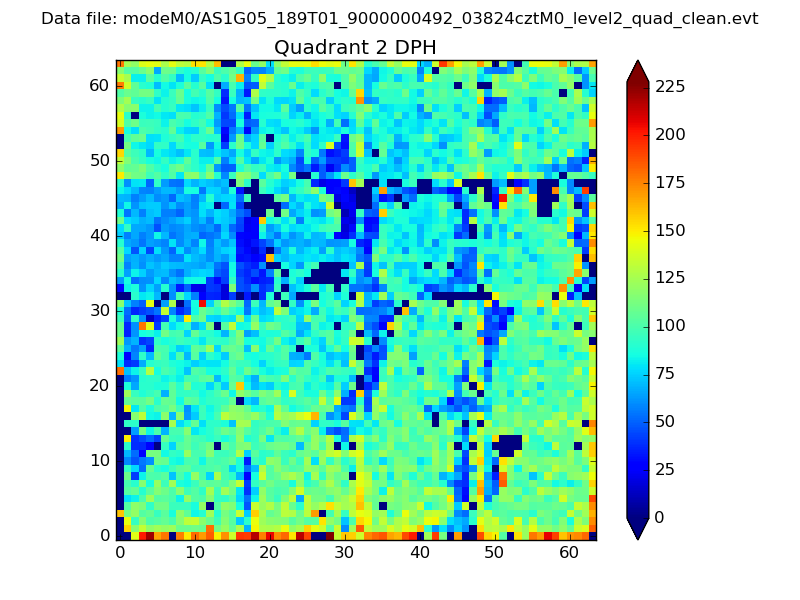 |
Quadrant C |
| Plot type | Count rate plots | Images |
|---|---|---|
| Comparison with Poisson distribution Blue bars denote a histogram of data divided into 1 sec bins. Red curve is a Poisson curve with rate = median count rate of data. |
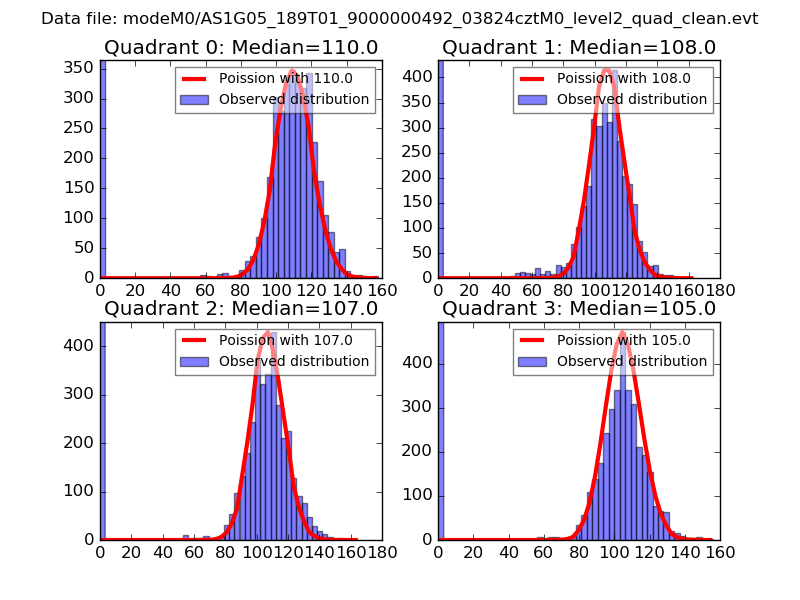 |
 |
| Quadrant-wise count rates Data is divided into 100 sec bins |
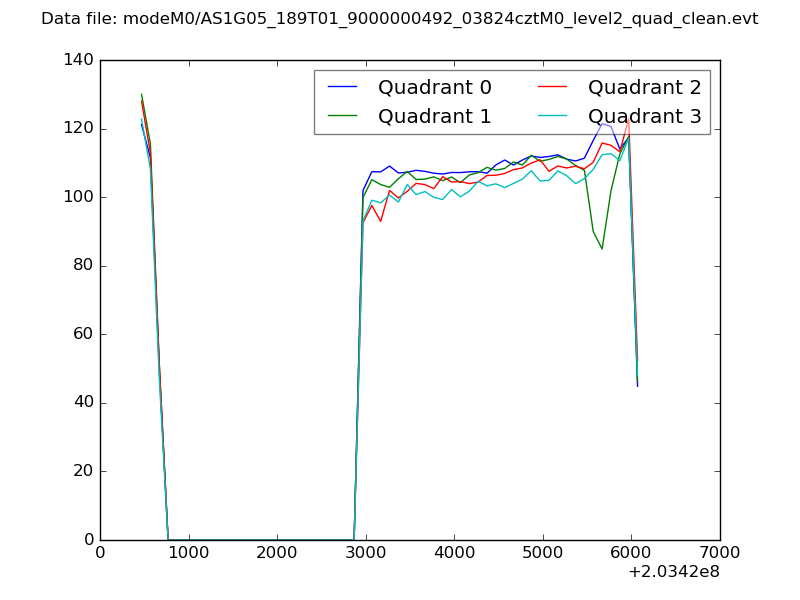 |
|
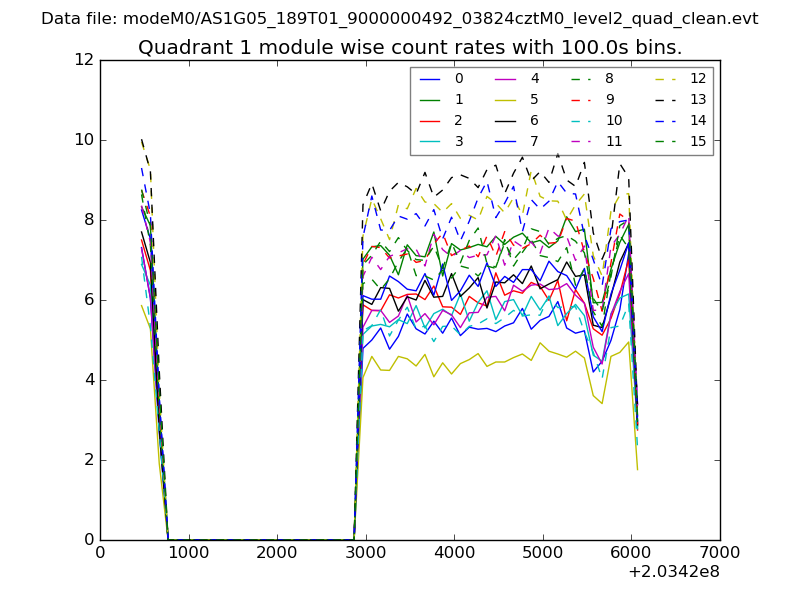
| Module-wise count rates for Quadrant A Data is divided into 100 sec bins |
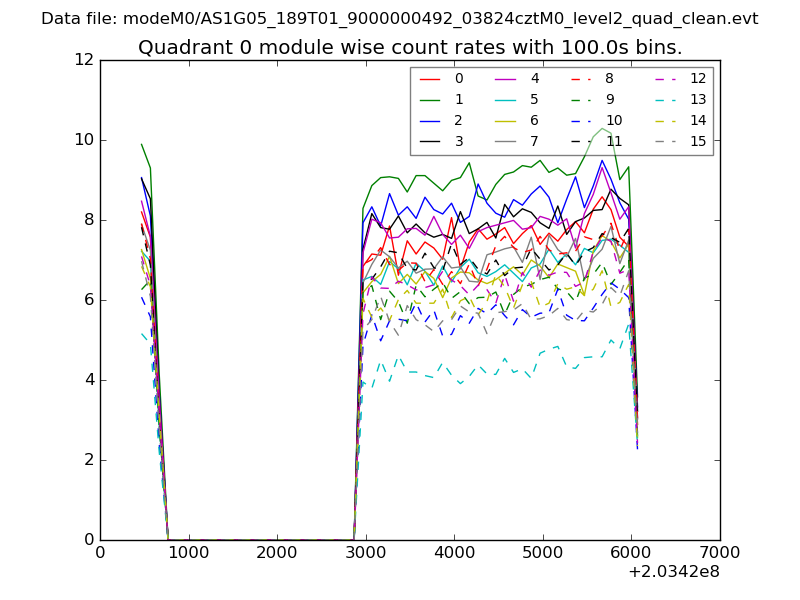 |
 |
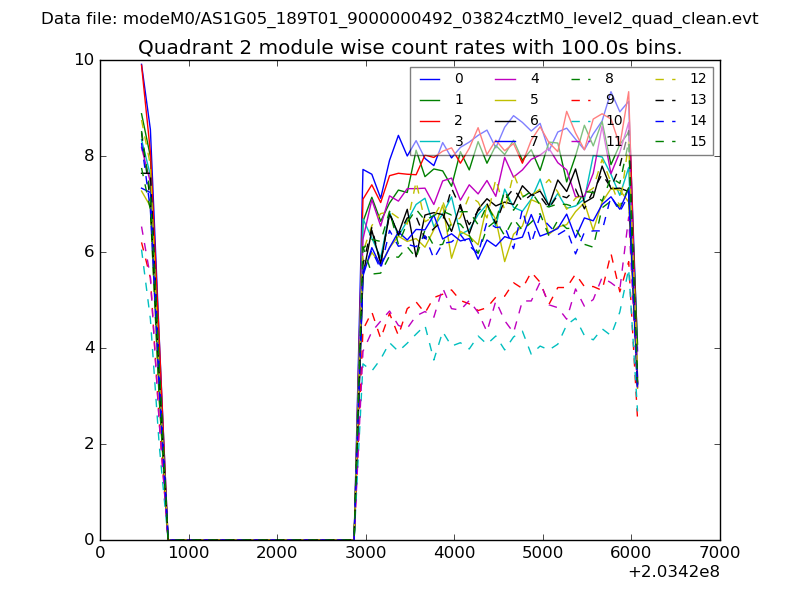
| Module-wise count rates for Quadrant B Data is divided into 100 sec bins |
 |
 |
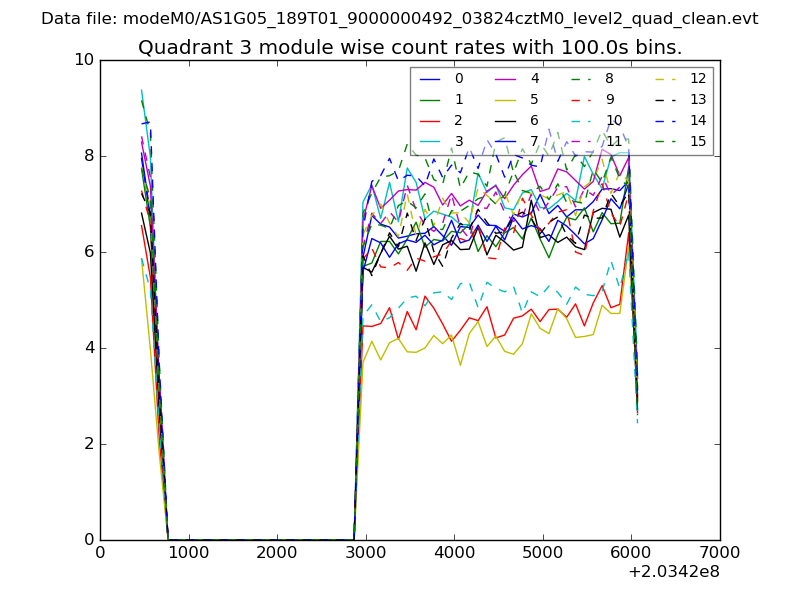
| Module-wise count rates for Quadrant C Data is divided into 100 sec bins |
 |
 |
| Module-wise count rates for Quadrant D Data is divided into 100 sec bins |
 |
 |
| Parameter | Plot |
|---|---|
| CZT HV Monitor | 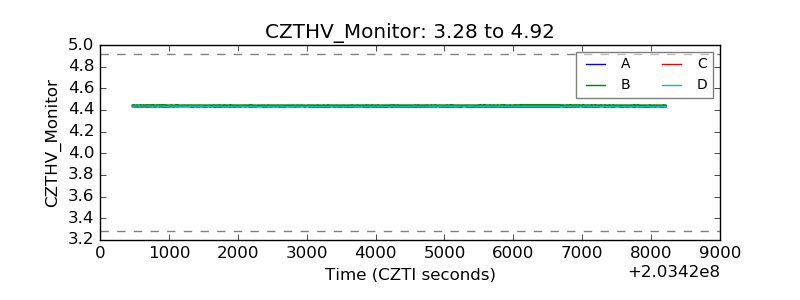 |
| D_VDD | 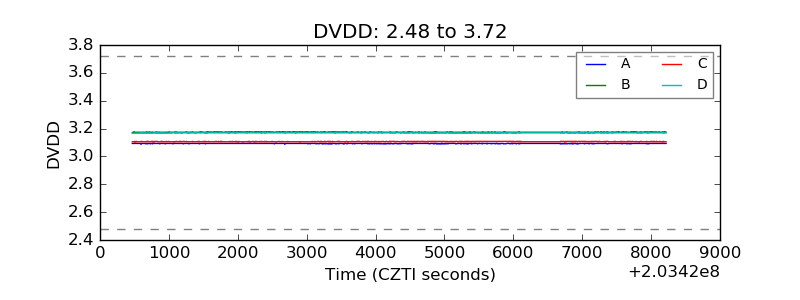 |
| Temperature 1 | 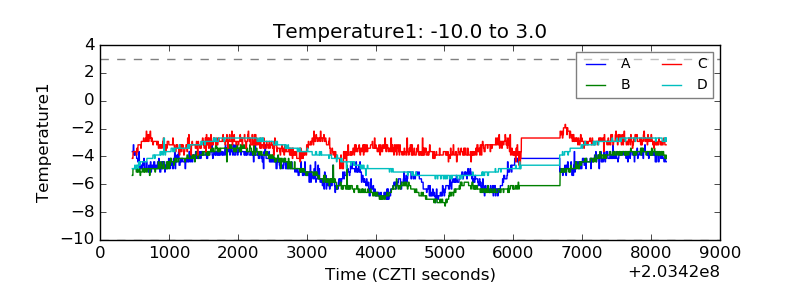 |
| Veto HV Monitor | 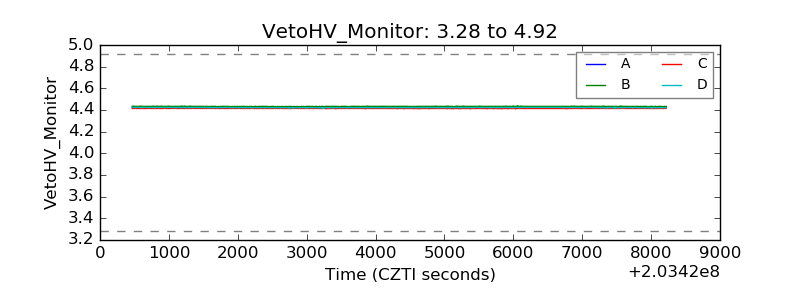 |
| Veto LLD | 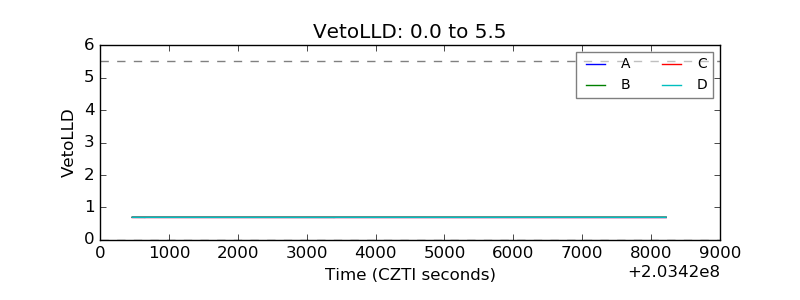 |
| Alpha Counter | 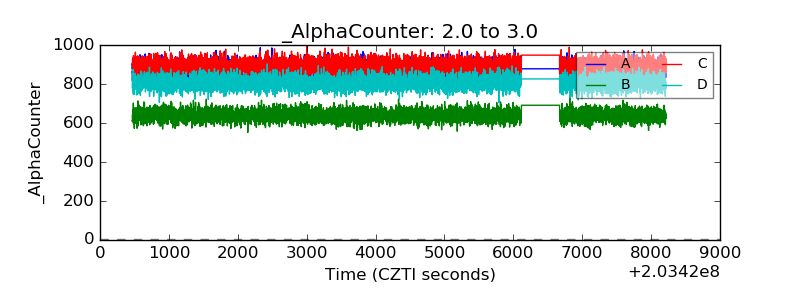 |
| _CPM_Rate |  |
| CZT Counter | 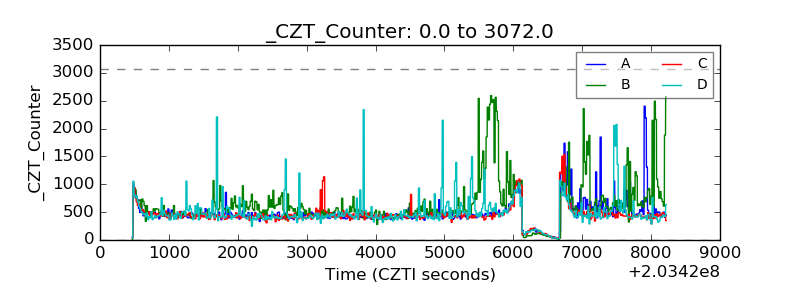 |
| +2.5 Volts monitor |  |
| +5 Volts monitor |  |
| _ROLL_ROT | 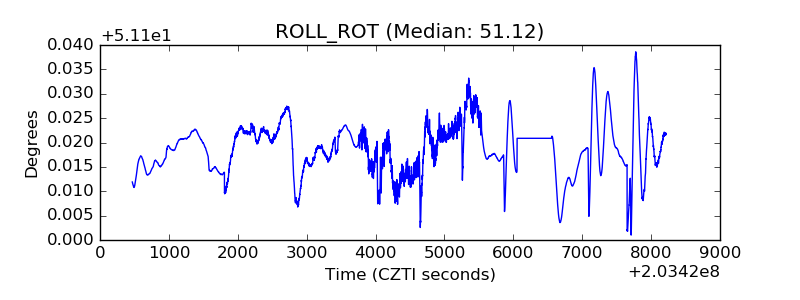 |
| _Roll_DEC | 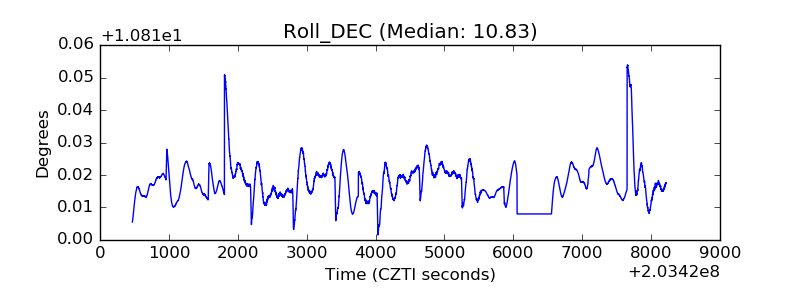 |
| _Roll_RA | 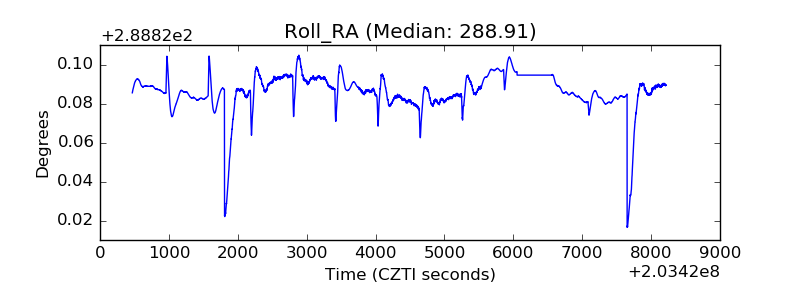 |
| Veto Counter | 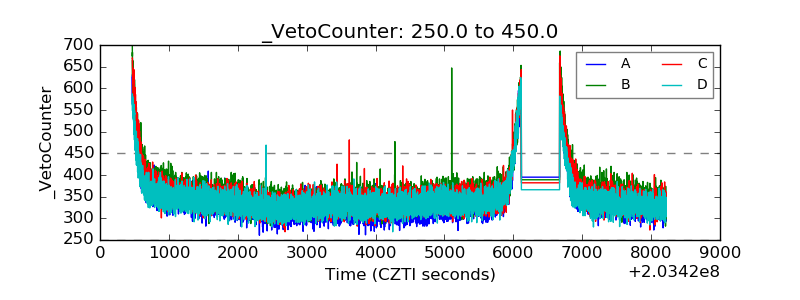 |