| Param | Original file | Final file |
|---|---|---|
| Filename | modeM0/AS1G05_189T01_9000000492_03825cztM0_level2.evt | modeM0/AS1G05_189T01_9000000492_03825cztM0_level2_quad_clean.evt |
| Size (bytes) | 659,067,840 | 67,363,200 |
| Size | 628.5 MB | 64.2 MB |
| Events in quadrant A | 5,184,956 | 383,884 |
| Events in quadrant B | 6,431,134 | 376,483 |
| Events in quadrant C | 3,766,772 | 370,434 |
| Events in quadrant D | 4,045,062 | 363,262 |
| Mode M0 | |||
|---|---|---|---|
| Quadrant | BADHDUFLAG | Total packets | Discarded packets |
| A | 0 | 20855 | 4 |
| B | 0 | 24344 | 3 |
| C | 0 | 16713 | 3 |
| D | 0 | 17767 | 3 |
| Mode M9 | |||
|---|---|---|---|
| Quadrant | BADHDUFLAG | Total packets | Discarded packets |
| A | 1 | 224764499168 | 0 |
| B | 1 | -1 | -1 |
| C | 1 | -1 | -1 |
| D | 1 | -1 | -1 |
| Mode SS | |||
|---|---|---|---|
| Quadrant | BADHDUFLAG | Total packets | Discarded packets |
| A | 0 | 158 | 0 |
| B | 0 | 158 | 0 |
| C | 0 | 158 | 0 |
| D | 0 | 158 | 0 |
| Quadrant | Total seconds | Saturated seconds | Saturation percentage |
|---|---|---|---|
| A | 7840 | 801 | 10.216837% |
| B | 7840 | 1034 | 13.188776% |
| C | 7840 | 288 | 3.673469% |
| D | 7840 | 357 | 4.553571% |
Noise dominated data is calculated using 1-second bins in cleaned event files. If a bin has >2000 counts, and if more than 50% of those come from <1% of pixels, then it is considered to be noise-dominated and hence unusable.
| Quadrant | # 1 sec bins | Bins with >0 counts | Bins with >2000 counts | High rate bins dominated by noise | Noise dominated (total time) | Noise dominated (detector-on time) | Marked lightcurve |
|---|---|---|---|---|---|---|---|
| A | 7870 | 7841 | 347 | 347 | 4.41% | 4.43% |  |
| B | 7870 | 7841 | 522 | 522 | 6.63% | 6.66% |  |
| C | 7870 | 7841 | 4 | 4 | 0.05% | 0.05% | 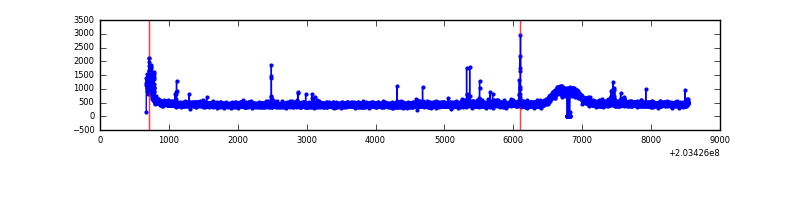 |
| D | 7870 | 7842 | 125 | 125 | 1.59% | 1.59% |  |
Top three noisy pixels from each quadrant. If the there are fewer than three noisy pixels in the level2.evt file, extra rows are filled as -1
| Pixel properties | Quadrant properties | ||||||
|---|---|---|---|---|---|---|---|
| Quadrant | DetID | PixID | Counts | Sigma | Mean | Median | Sigma |
| A | 15 | 234 | 900579 | 4667.03 | 933 | 911 | 192.8 |
| A | 0 | 199 | 600424 | 3109.97 | 933 | 911 | 192.8 |
| A | 0 | 226 | 62006 | 316.93 | 933 | 911 | 192.8 |
| B | 10 | 16 | 2172492 | 11848.47 | 920 | 898 | 183.3 |
| B | 15 | 204 | 555047 | 3023.5 | 920 | 898 | 183.3 |
| B | 14 | 167 | 72996 | 393.37 | 920 | 898 | 183.3 |
| C | 9 | 247 | 50590 | 228.32 | 923 | 925 | 217.5 |
| C | 2 | 53 | 37541 | 168.33 | 923 | 925 | 217.5 |
| C | 10 | 65 | 31275 | 139.53 | 923 | 925 | 217.5 |
| D | 13 | 105 | 178097 | 785.24 | 923 | 898 | 225.7 |
| D | 14 | 34 | 166832 | 735.32 | 923 | 898 | 225.7 |
| D | 10 | 98 | 106013 | 465.81 | 923 | 898 | 225.7 |
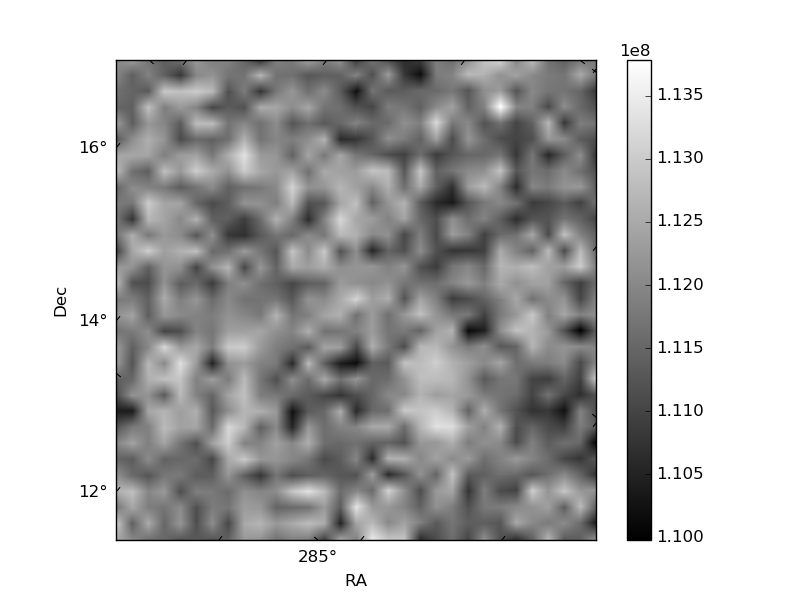
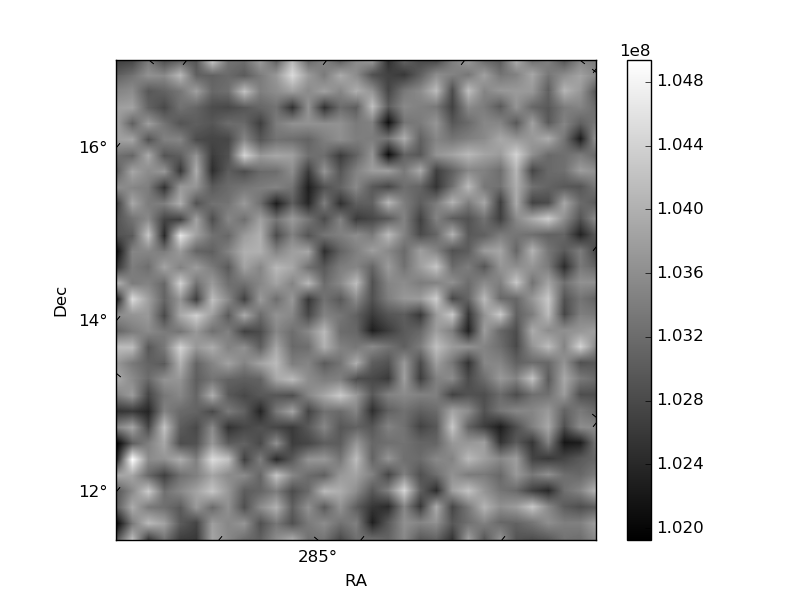
Histogram calculated using DETX and DETY for each event in the final _common_clean file
| Quadrant A |  |
 |
Quadrant B |
|---|---|---|---|
| Quadrant D |  |
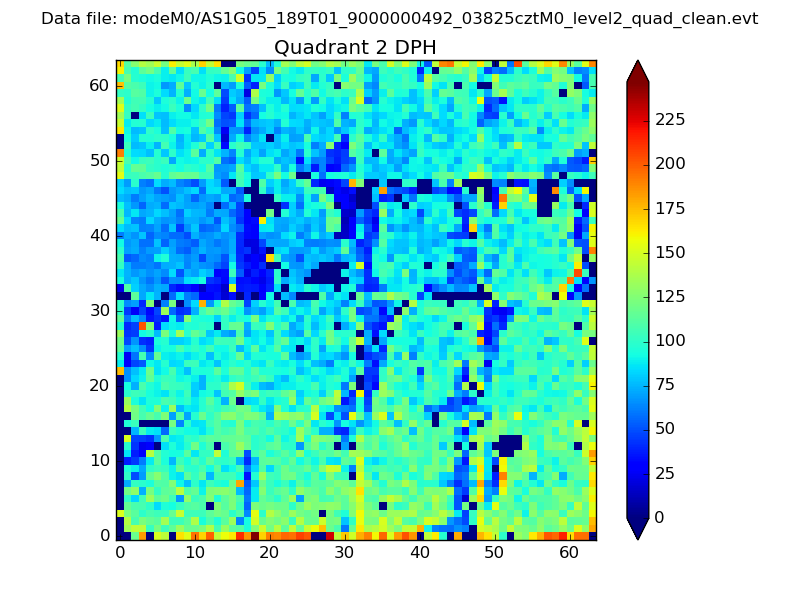 |
Quadrant C |
| Plot type | Count rate plots | Images |
|---|---|---|
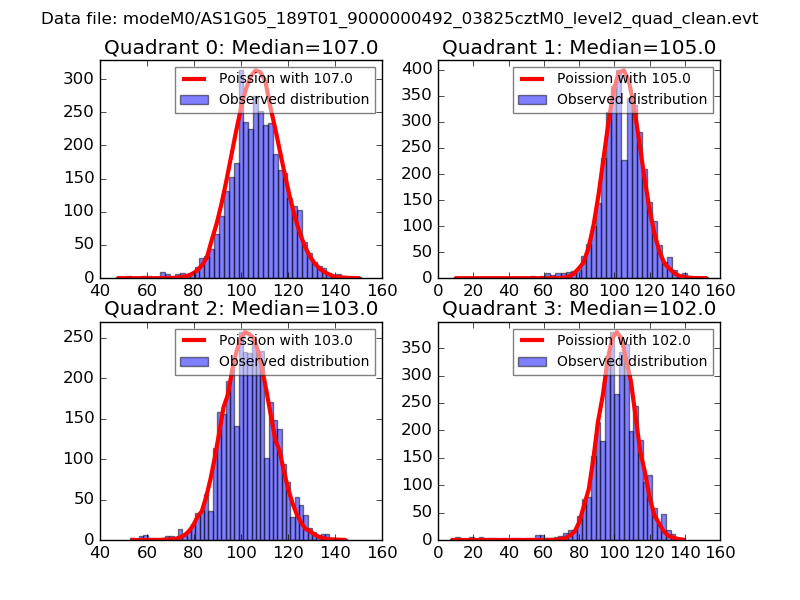
| Comparison with Poisson distribution Blue bars denote a histogram of data divided into 1 sec bins. Red curve is a Poisson curve with rate = median count rate of data. |
 |
 |
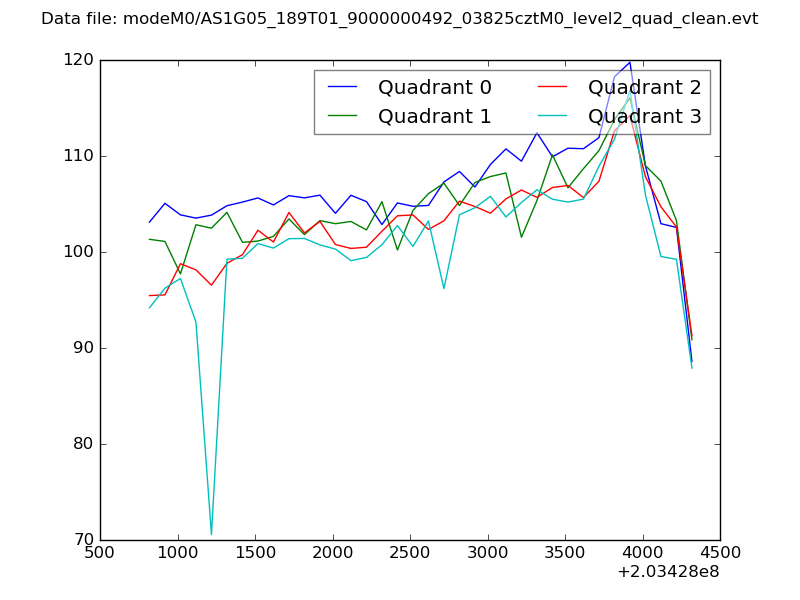
| Quadrant-wise count rates Data is divided into 100 sec bins |
 |
|
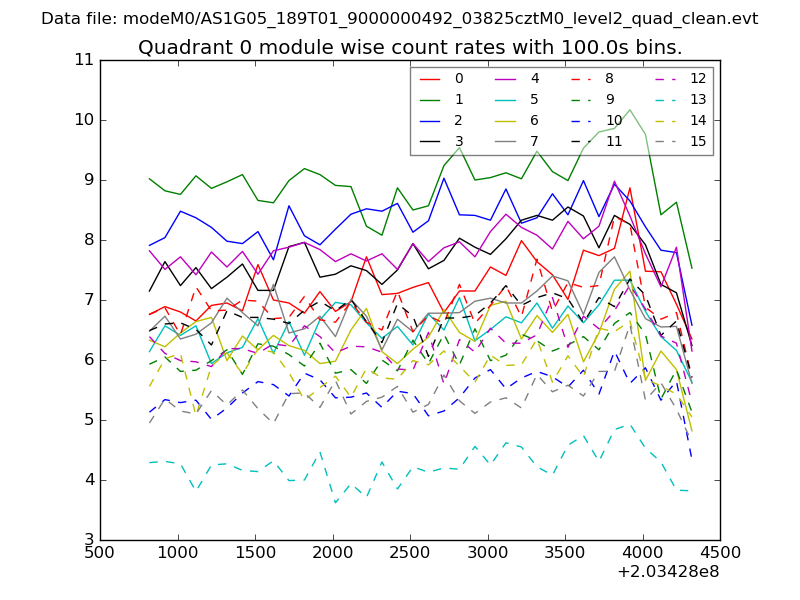
| Module-wise count rates for Quadrant A Data is divided into 100 sec bins |
 |
 |
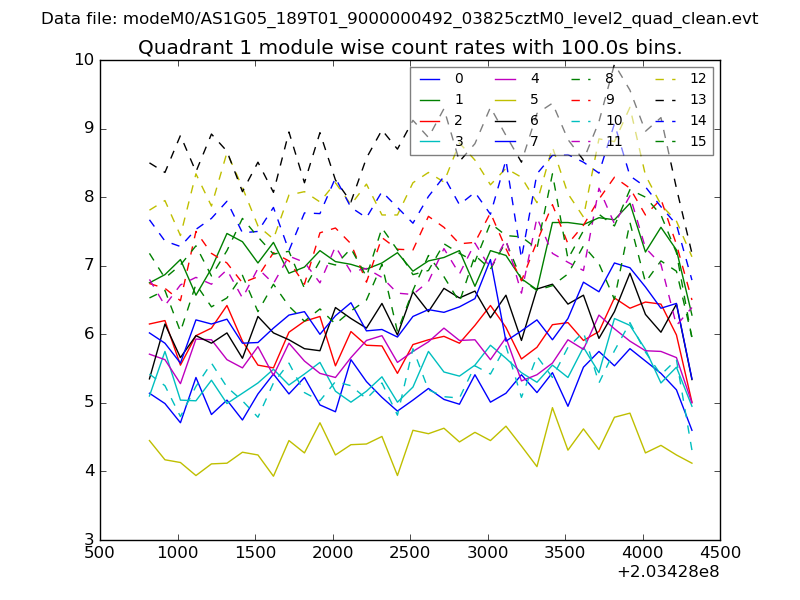
| Module-wise count rates for Quadrant B Data is divided into 100 sec bins |
 |
 |
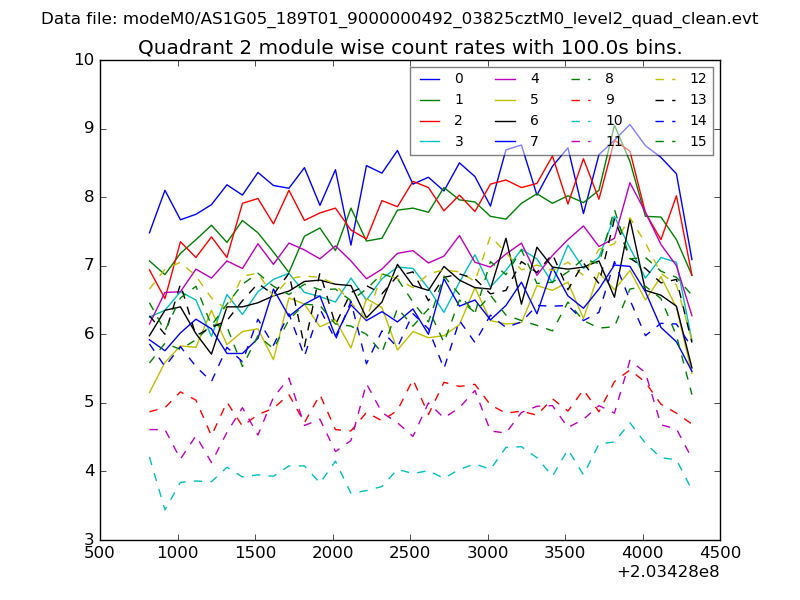
| Module-wise count rates for Quadrant C Data is divided into 100 sec bins |
 |
 |
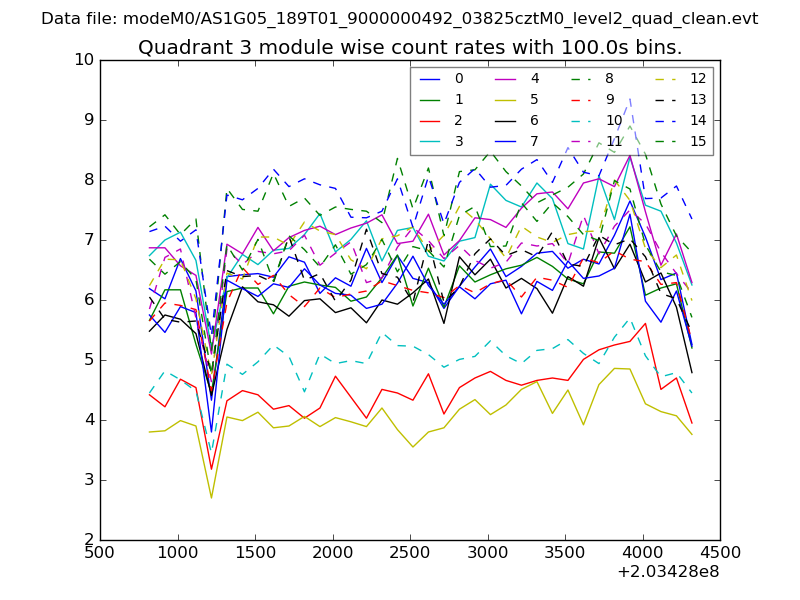
| Module-wise count rates for Quadrant D Data is divided into 100 sec bins |
 |
 |
| Parameter | Plot |
|---|---|
| CZT HV Monitor | 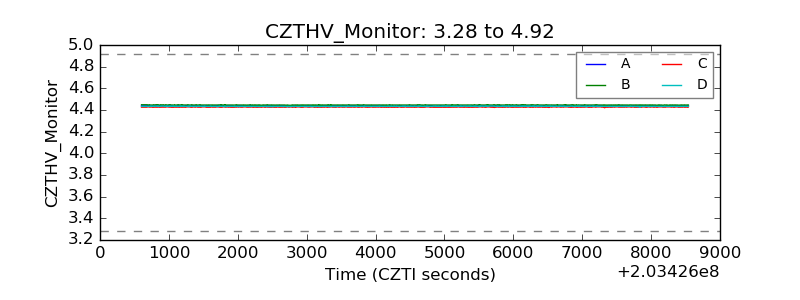 |
| D_VDD | 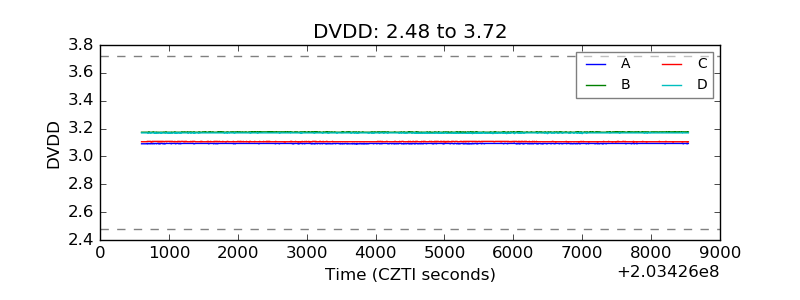 |
| Temperature 1 | 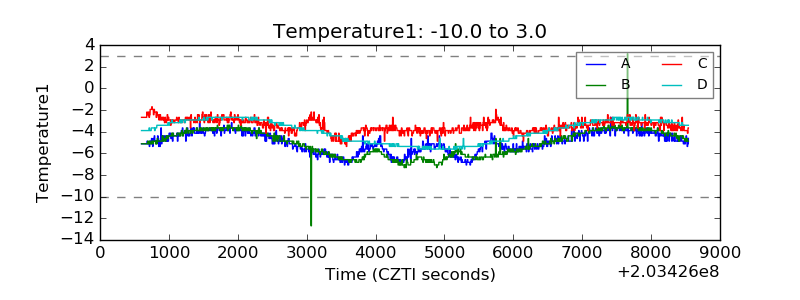 |
| Veto HV Monitor | 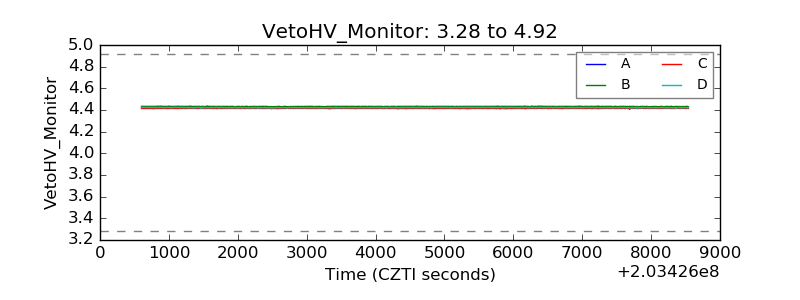 |
| Veto LLD | 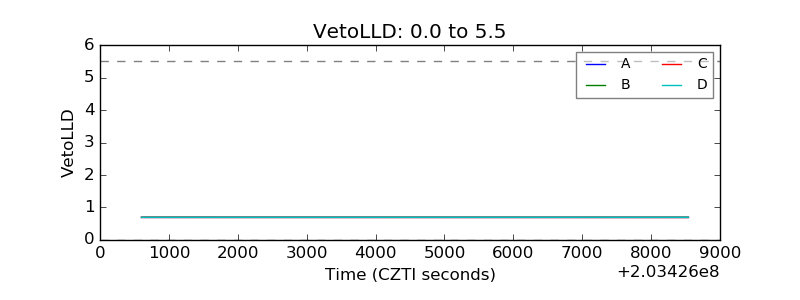 |
| Alpha Counter | 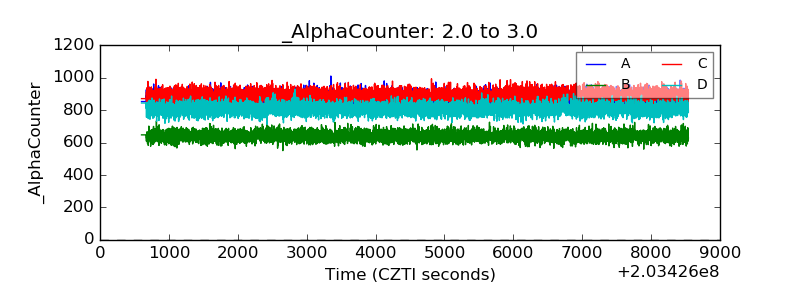 |
| _CPM_Rate | 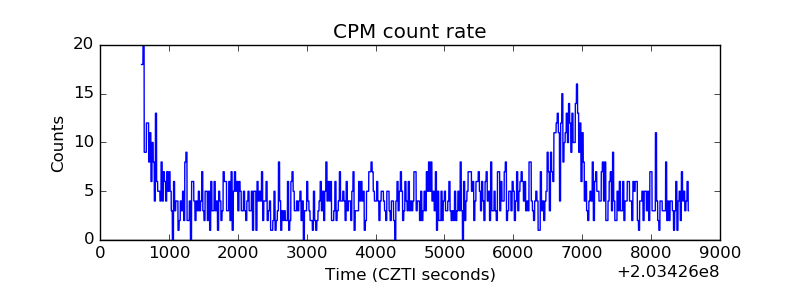 |
| CZT Counter | 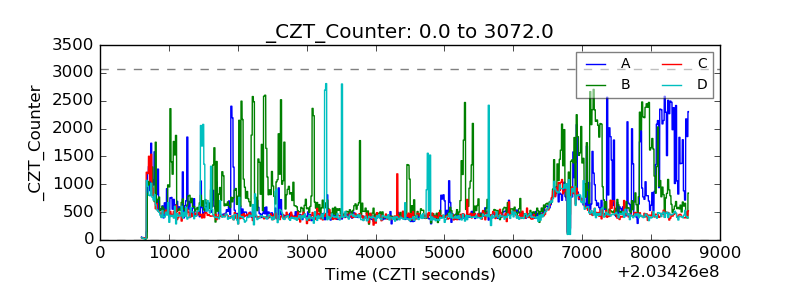 |
| +2.5 Volts monitor |  |
| +5 Volts monitor |  |
| _ROLL_ROT | 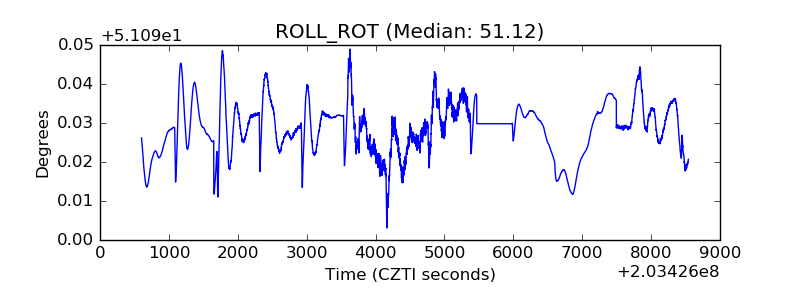 |
| _Roll_DEC | 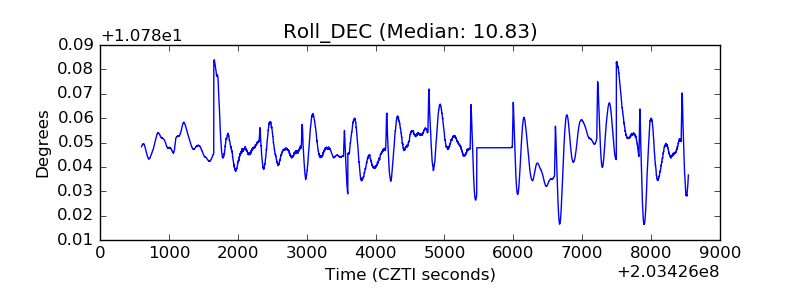 |
| _Roll_RA | 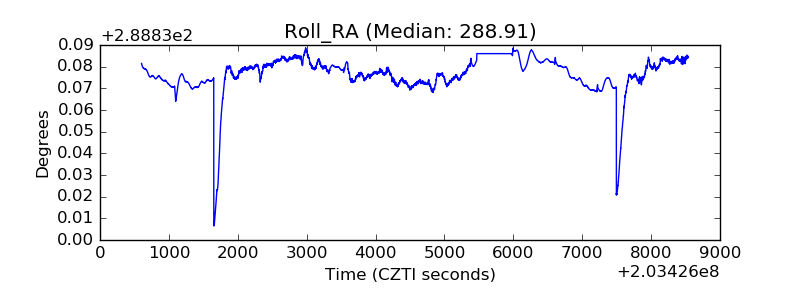 |
| Veto Counter | 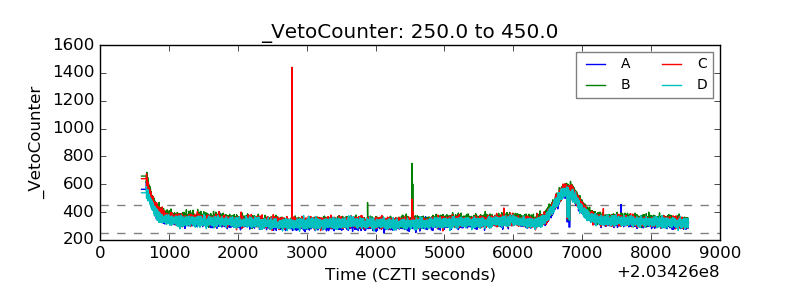 |