| Param | Original file | Final file |
|---|---|---|
| Filename | modeM0/AS1G05_189T01_9000000492_03826cztM0_level2.evt | modeM0/AS1G05_189T01_9000000492_03826cztM0_level2_quad_clean.evt |
| Size (bytes) | 869,132,160 | 78,071,040 |
| Size | 828.9 MB | 74.5 MB |
| Events in quadrant A | 9,033,862 | 413,048 |
| Events in quadrant B | 6,562,164 | 456,741 |
| Events in quadrant C | 5,890,991 | 445,038 |
| Events in quadrant D | 4,240,288 | 438,475 |
| Mode M0 | |||
|---|---|---|---|
| Quadrant | BADHDUFLAG | Total packets | Discarded packets |
| A | 0 | 32835 | 5 |
| B | 0 | 25333 | 4 |
| C | 0 | 23585 | 4 |
| D | 0 | 18950 | 4 |
| Mode SS | |||
|---|---|---|---|
| Quadrant | BADHDUFLAG | Total packets | Discarded packets |
| A | 0 | 178 | 0 |
| B | 0 | 178 | 0 |
| C | 0 | 178 | 0 |
| D | 0 | 178 | 0 |
| Quadrant | Total seconds | Saturated seconds | Saturation percentage |
|---|---|---|---|
| A | 8781 | 2002 | 22.799226% |
| B | 8781 | 976 | 11.114907% |
| C | 8781 | 806 | 9.178909% |
| D | 8781 | 349 | 3.974490% |
Noise dominated data is calculated using 1-second bins in cleaned event files. If a bin has >2000 counts, and if more than 50% of those come from <1% of pixels, then it is considered to be noise-dominated and hence unusable.
| Quadrant | # 1 sec bins | Bins with >0 counts | Bins with >2000 counts | High rate bins dominated by noise | Noise dominated (total time) | Noise dominated (detector-on time) | Marked lightcurve |
|---|---|---|---|---|---|---|---|
| A | 8916 | 8782 | 1398 | 1398 | 15.68% | 15.92% | 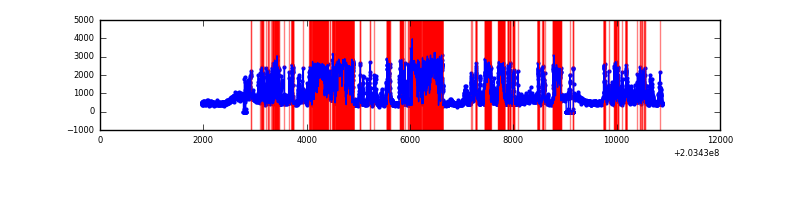 |
| B | 8916 | 8782 | 352 | 352 | 3.95% | 4.01% | 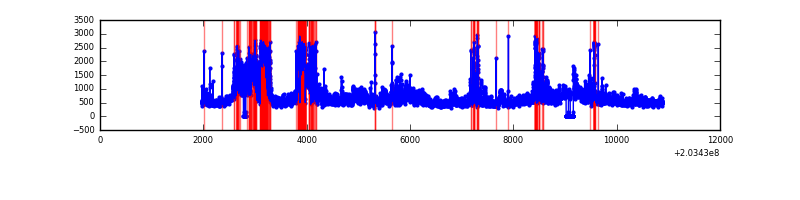 |
| C | 8916 | 8783 | 350 | 350 | 3.93% | 3.98% | 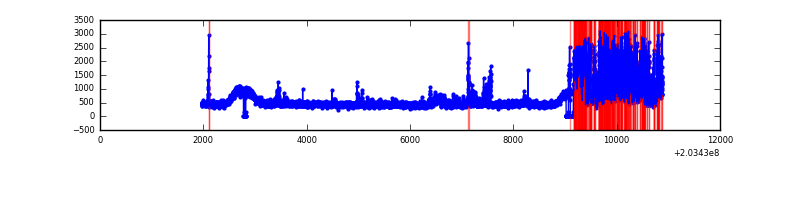 |
| D | 8916 | 8784 | 31 | 31 | 0.35% | 0.35% | 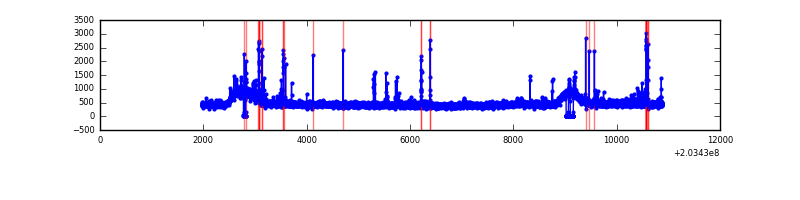 |
Top three noisy pixels from each quadrant. If the there are fewer than three noisy pixels in the level2.evt file, extra rows are filled as -1
| Pixel properties | Quadrant properties | ||||||
|---|---|---|---|---|---|---|---|
| Quadrant | DetID | PixID | Counts | Sigma | Mean | Median | Sigma |
| A | 15 | 234 | 4820728 | 23324.64 | 1000 | 976 | 206.6 |
| A | 0 | 199 | 285738 | 1378.07 | 1000 | 976 | 206.6 |
| A | 0 | 226 | 36784 | 173.29 | 1000 | 976 | 206.6 |
| B | 10 | 16 | 1710569 | 8226.91 | 1053 | 1027 | 207.8 |
| B | 15 | 204 | 620165 | 2979.51 | 1053 | 1027 | 207.8 |
| B | 14 | 167 | 86654 | 412.07 | 1053 | 1027 | 207.8 |
| C | 2 | 53 | 1841734 | 7609.96 | 1024 | 1026 | 241.9 |
| C | 10 | 65 | 20436 | 80.25 | 1024 | 1026 | 241.9 |
| C | 1 | 16 | 18071 | 70.47 | 1024 | 1026 | 241.9 |
| D | 2 | 32 | 86704 | 335.44 | 1049 | 1017 | 255.5 |
| D | 1 | 84 | 74143 | 286.26 | 1049 | 1017 | 255.5 |
| D | 14 | 34 | 50611 | 194.14 | 1049 | 1017 | 255.5 |
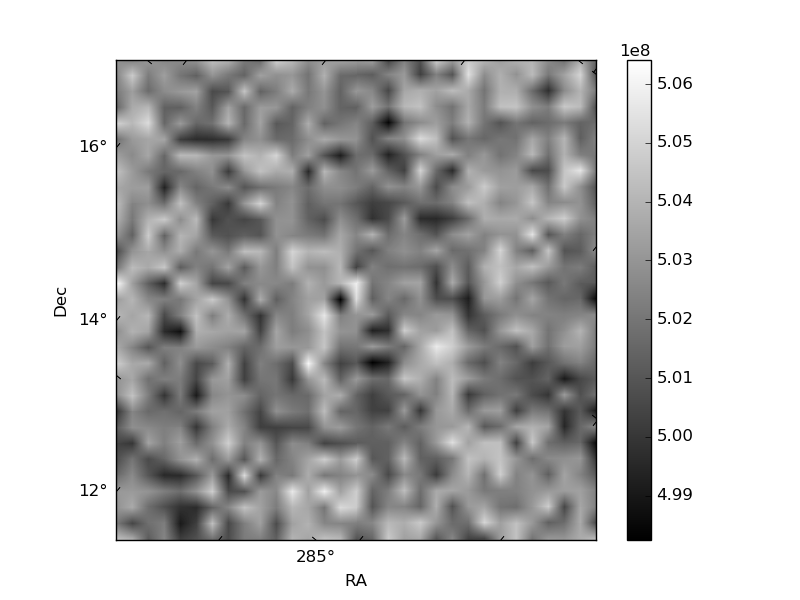
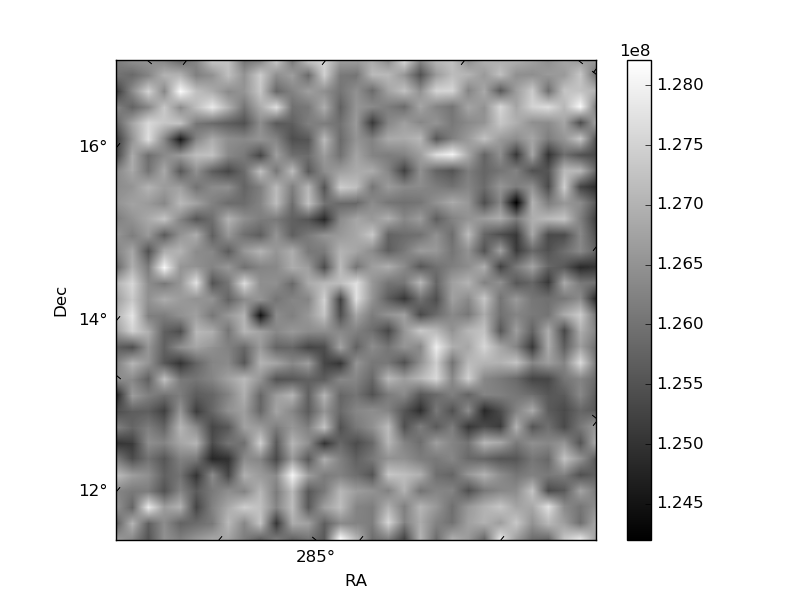
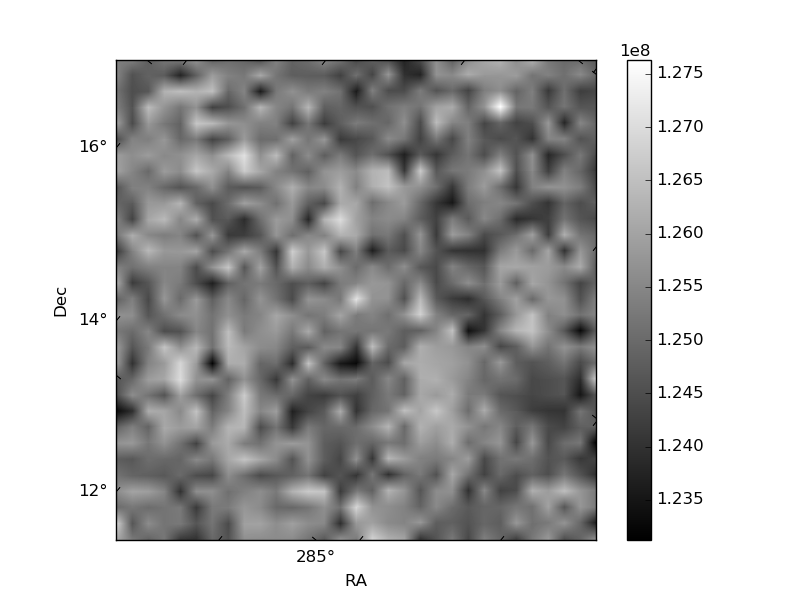
Histogram calculated using DETX and DETY for each event in the final _common_clean file
| Quadrant A | 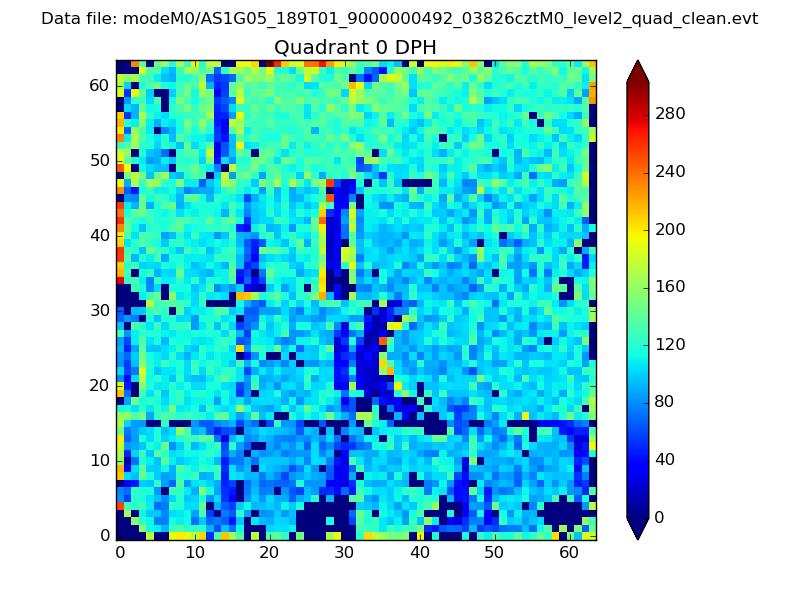 |
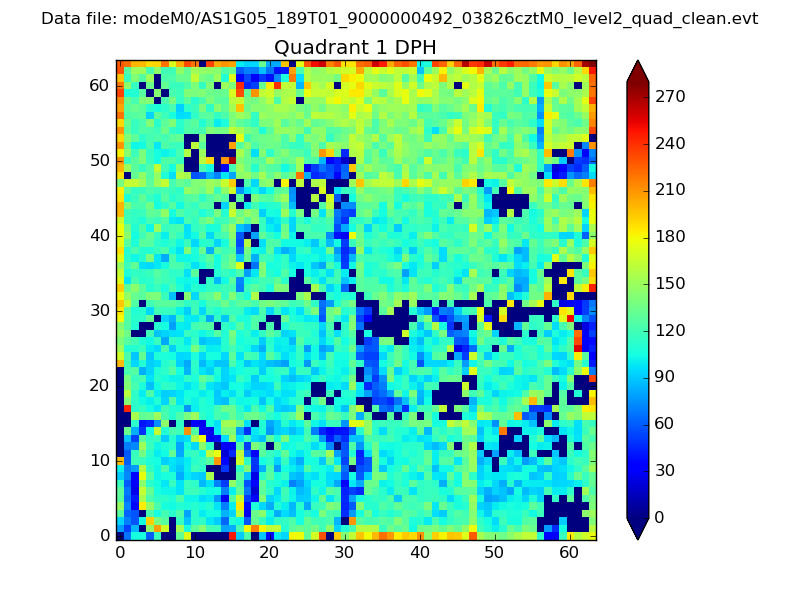 |
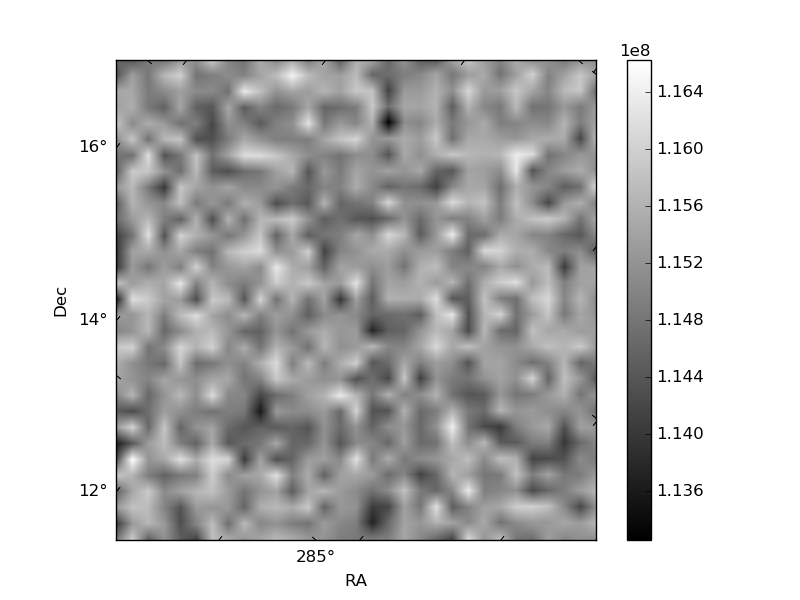
Quadrant B |
|---|---|---|---|
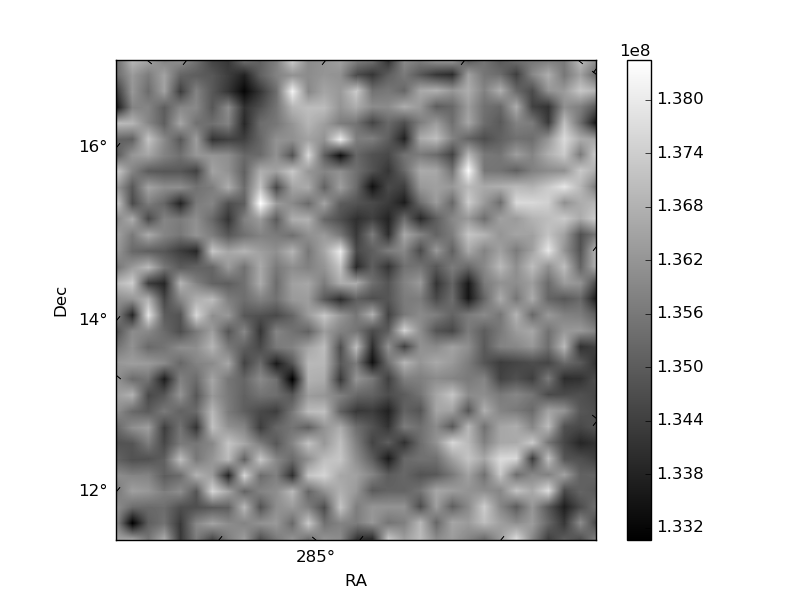
| Quadrant D | 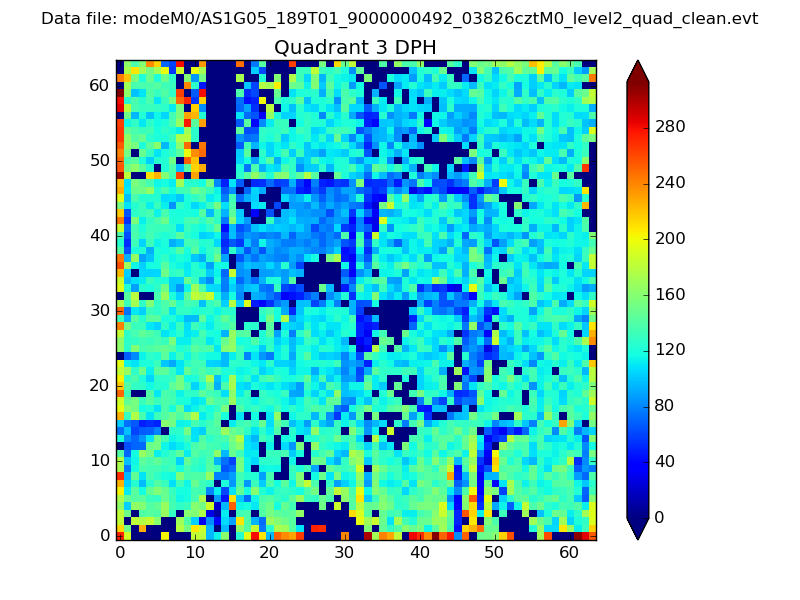 |
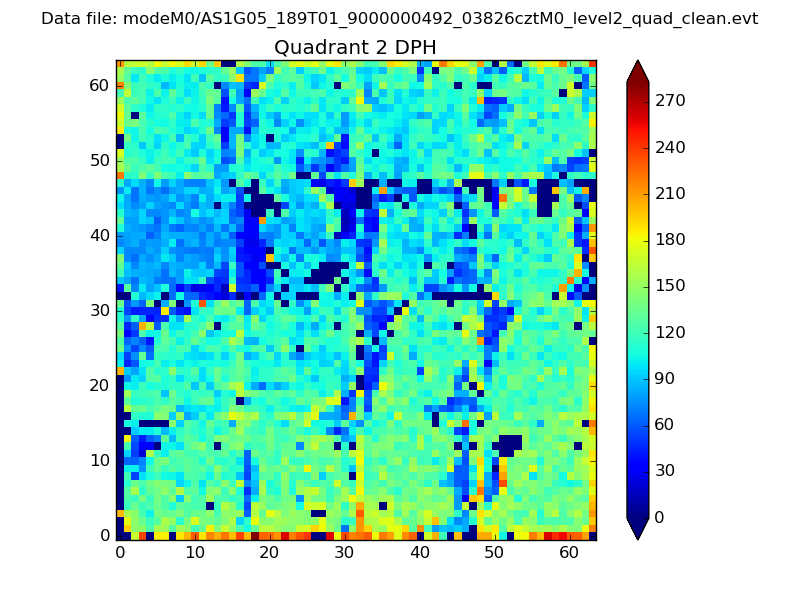 |
Quadrant C |
| Plot type | Count rate plots | Images |
|---|---|---|
| Comparison with Poisson distribution Blue bars denote a histogram of data divided into 1 sec bins. Red curve is a Poisson curve with rate = median count rate of data. |
 |
 |
| Quadrant-wise count rates Data is divided into 100 sec bins |
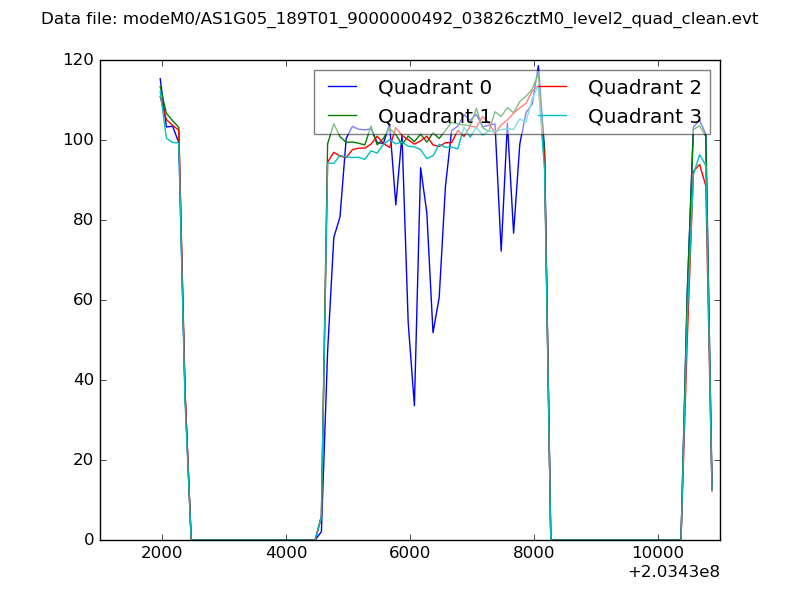 |
|
| Module-wise count rates for Quadrant A Data is divided into 100 sec bins |
 |
 |
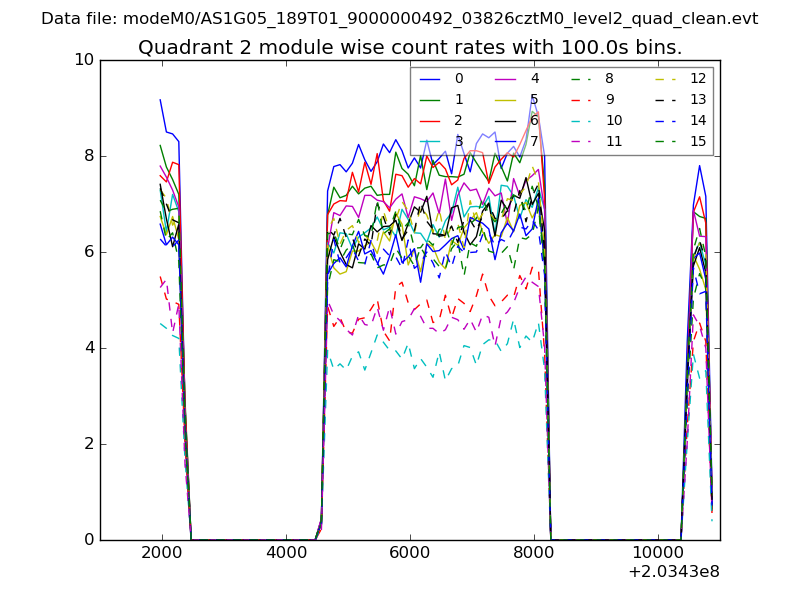
| Module-wise count rates for Quadrant B Data is divided into 100 sec bins |
 |
 |
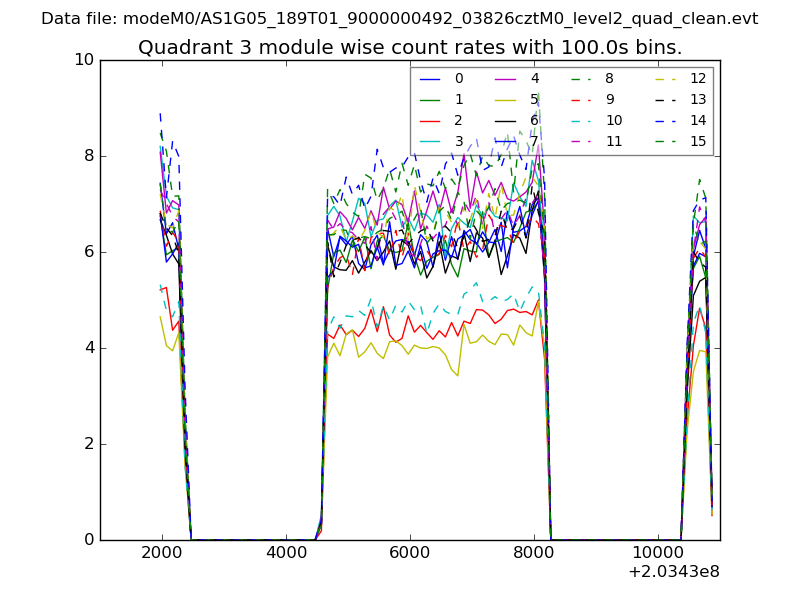
| Module-wise count rates for Quadrant C Data is divided into 100 sec bins |
 |
 |
| Module-wise count rates for Quadrant D Data is divided into 100 sec bins |
 |
 |
| Parameter | Plot |
|---|---|
| CZT HV Monitor | 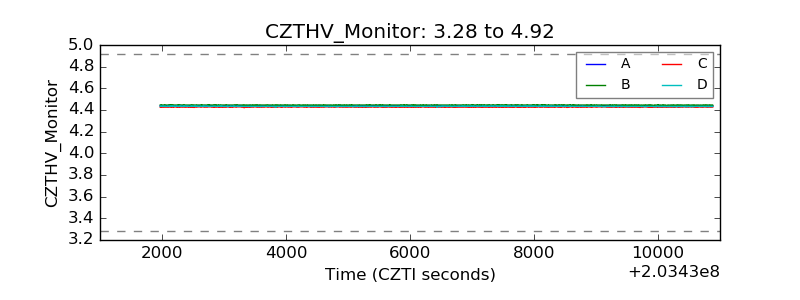 |
| D_VDD | 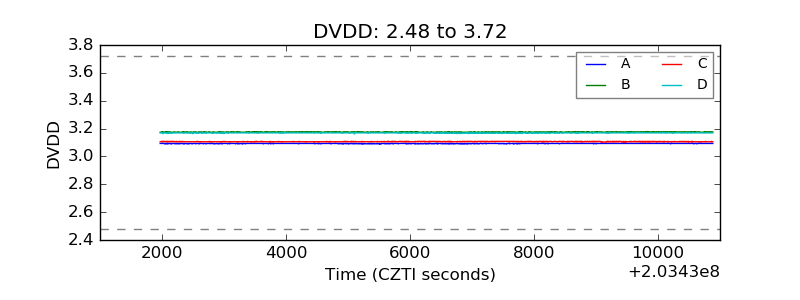 |
| Temperature 1 | 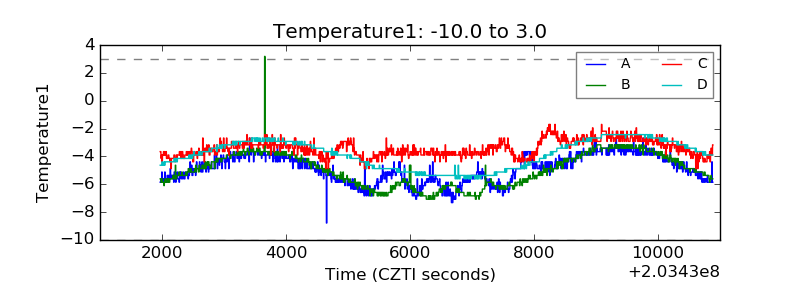 |
| Veto HV Monitor | 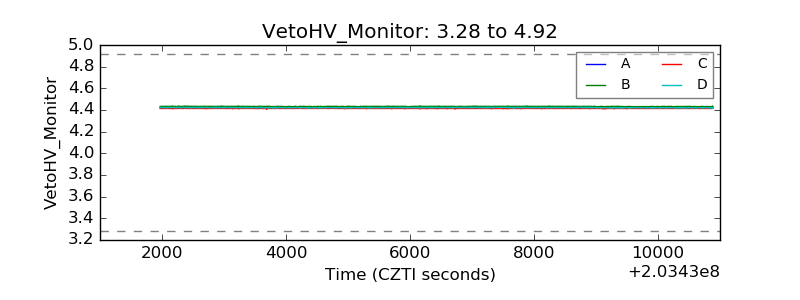 |
| Veto LLD | 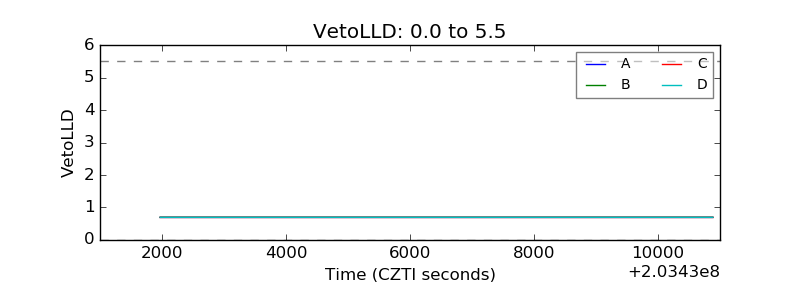 |
| Alpha Counter | 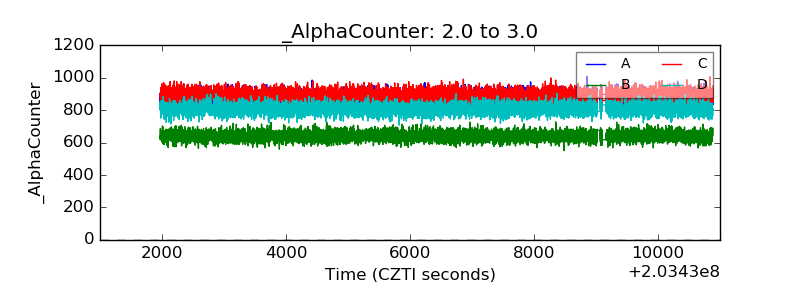 |
| _CPM_Rate | 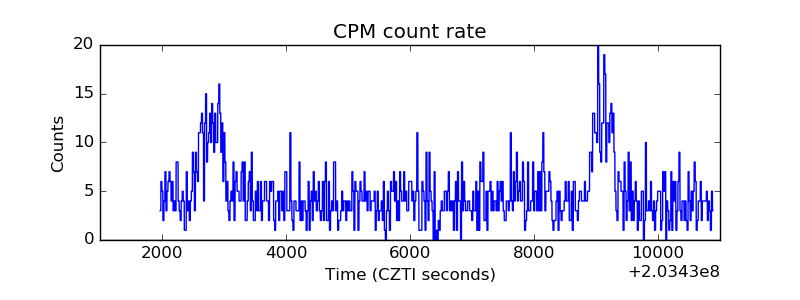 |
| CZT Counter | 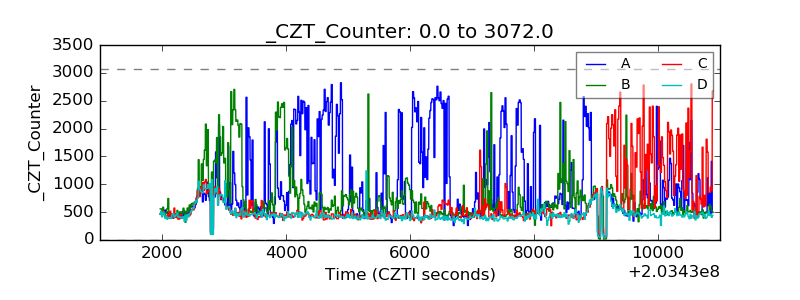 |
| +2.5 Volts monitor | 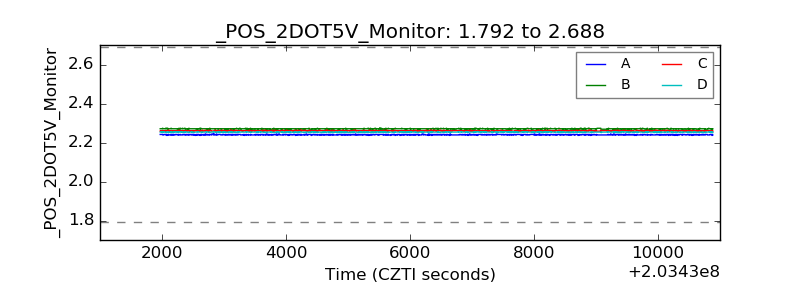 |
| +5 Volts monitor |  |
| _ROLL_ROT | 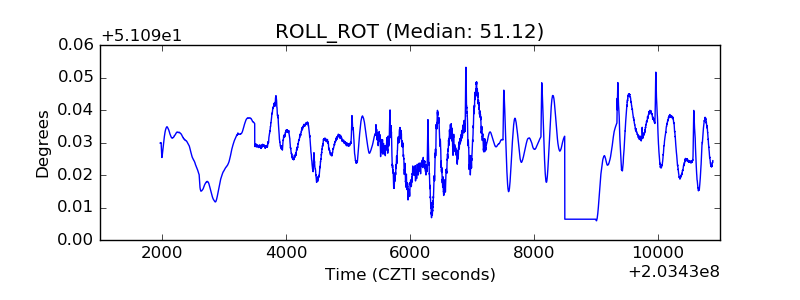 |
| _Roll_DEC | 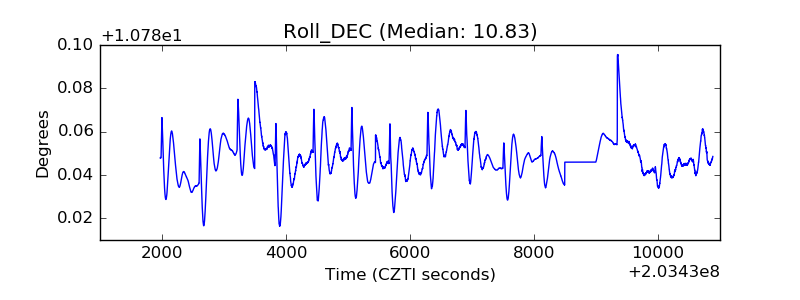 |
| _Roll_RA | 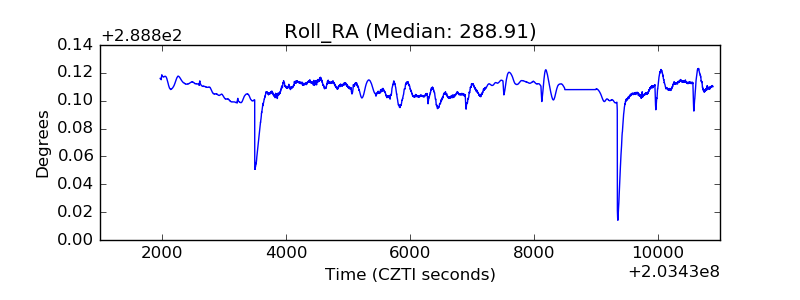 |
| Veto Counter | 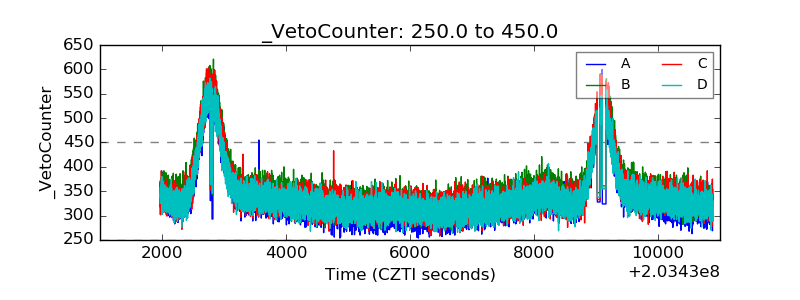 |