| Param | Original file | Final file |
|---|---|---|
| Filename | modeM0/AS1G05_189T01_9000000492_03829cztM0_level2.evt | modeM0/AS1G05_189T01_9000000492_03829cztM0_level2_quad_clean.evt |
| Size (bytes) | 1,062,564,480 | 136,788,480 |
| Size | 1013.3 MB | 130.5 MB |
| Events in quadrant A | 8,042,660 | 853,244 |
| Events in quadrant B | 5,934,064 | 867,942 |
| Events in quadrant C | 12,256,410 | 768,604 |
| Events in quadrant D | 5,147,060 | 833,322 |
| Mode M0 | |||
|---|---|---|---|
| Quadrant | BADHDUFLAG | Total packets | Discarded packets |
| A | 0 | 31963 | 3 |
| B | 0 | 25542 | 2 |
| C | 0 | 44346 | 2 |
| D | 0 | 24300 | 2 |
| Mode M9 | |||
|---|---|---|---|
| Quadrant | BADHDUFLAG | Total packets | Discarded packets |
| A | 0 | 13 | 0 |
| B | 0 | 13 | 0 |
| C | 0 | 13 | 0 |
| D | 0 | 13 | 0 |
| Mode SS | |||
|---|---|---|---|
| Quadrant | BADHDUFLAG | Total packets | Discarded packets |
| A | 0 | 242 | 0 |
| B | 0 | 242 | 0 |
| C | 0 | 242 | 0 |
| D | 0 | 242 | 0 |
| Quadrant | Total seconds | Saturated seconds | Saturation percentage |
|---|---|---|---|
| A | 11832 | 635 | 5.366802% |
| B | 11832 | 95 | 0.802907% |
| C | 11832 | 2365 | 19.988168% |
| D | 11832 | 64 | 0.540906% |
Noise dominated data is calculated using 1-second bins in cleaned event files. If a bin has >2000 counts, and if more than 50% of those come from <1% of pixels, then it is considered to be noise-dominated and hence unusable.
| Quadrant | # 1 sec bins | Bins with >0 counts | Bins with >2000 counts | High rate bins dominated by noise | Noise dominated (total time) | Noise dominated (detector-on time) | Marked lightcurve |
|---|---|---|---|---|---|---|---|
| A | 13147 | 11832 | 491 | 491 | 3.73% | 4.15% | 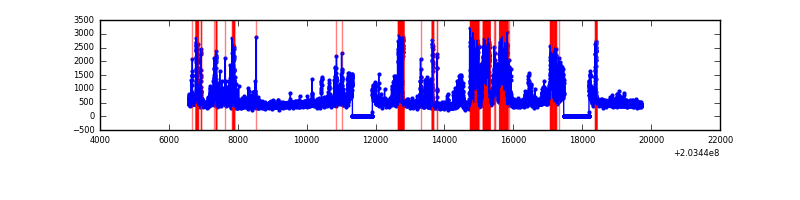 |
| B | 13147 | 11832 | 8 | 8 | 0.06% | 0.07% | 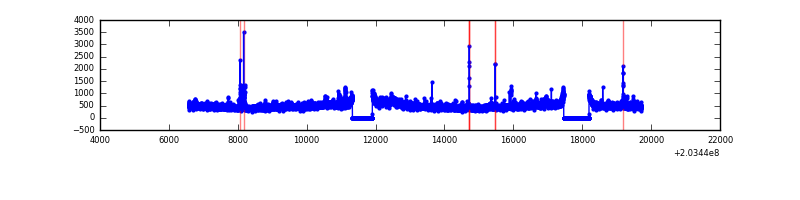 |
| C | 13147 | 11832 | 2124 | 2124 | 16.16% | 17.95% | 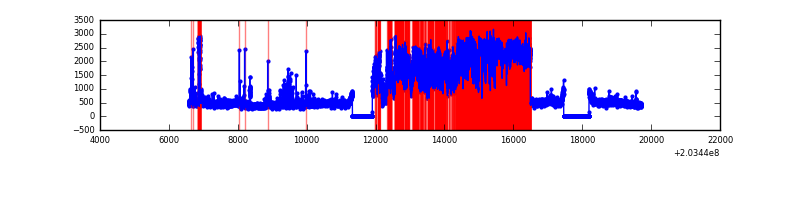 |
| D | 13147 | 11832 | 19 | 19 | 0.14% | 0.16% | 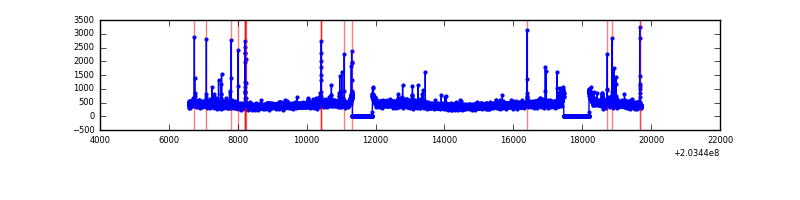 |
Top three noisy pixels from each quadrant. If the there are fewer than three noisy pixels in the level2.evt file, extra rows are filled as -1
| Pixel properties | Quadrant properties | ||||||
|---|---|---|---|---|---|---|---|
| Quadrant | DetID | PixID | Counts | Sigma | Mean | Median | Sigma |
| A | 15 | 234 | 2858433 | 10479.96 | 1333 | 1303 | 272.6 |
| A | 13 | 251 | 30843 | 108.35 | 1333 | 1303 | 272.6 |
| A | 12 | 194 | 13753 | 45.67 | 1333 | 1303 | 272.6 |
| B | 15 | 204 | 395992 | 1491.01 | 1372 | 1336 | 264.7 |
| B | 0 | 187 | 73241 | 271.66 | 1372 | 1336 | 264.7 |
| B | 10 | 246 | 46145 | 169.29 | 1372 | 1336 | 264.7 |
| C | 2 | 53 | 7415723 | 26319.17 | 1203 | 1209 | 281.7 |
| C | 1 | 241 | 51587 | 178.83 | 1203 | 1209 | 281.7 |
| C | 9 | 247 | 27211 | 92.3 | 1203 | 1209 | 281.7 |
| D | 13 | 223 | 54138 | 165.49 | 1312 | 1273 | 319.5 |
| D | 2 | 14 | 45775 | 139.31 | 1312 | 1273 | 319.5 |
| D | 1 | 84 | 30707 | 92.14 | 1312 | 1273 | 319.5 |
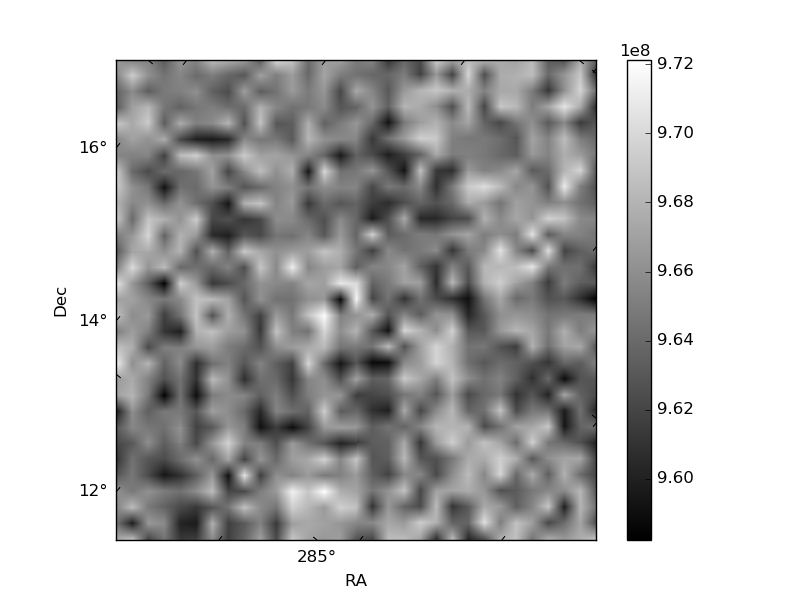
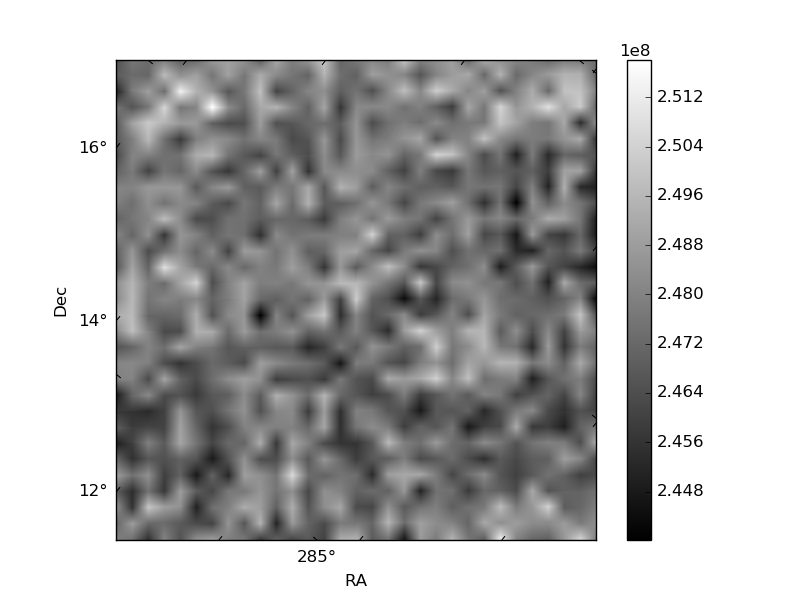
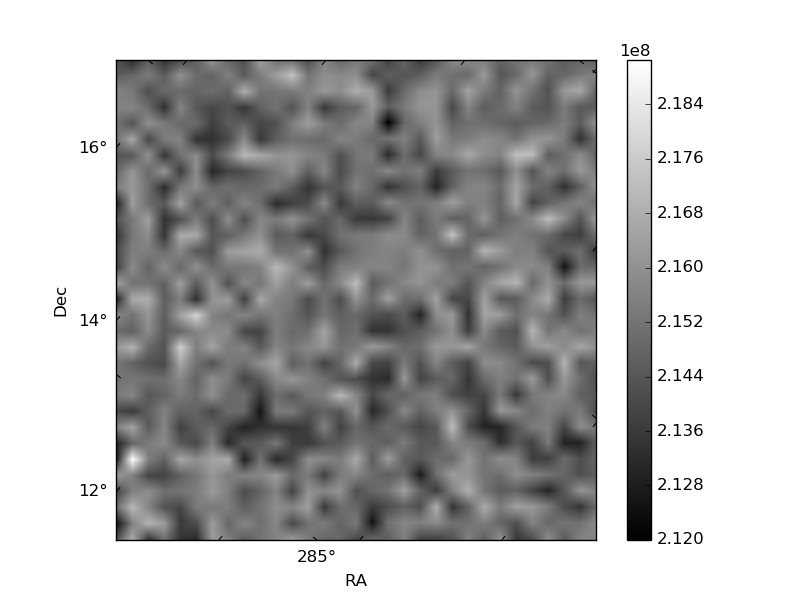
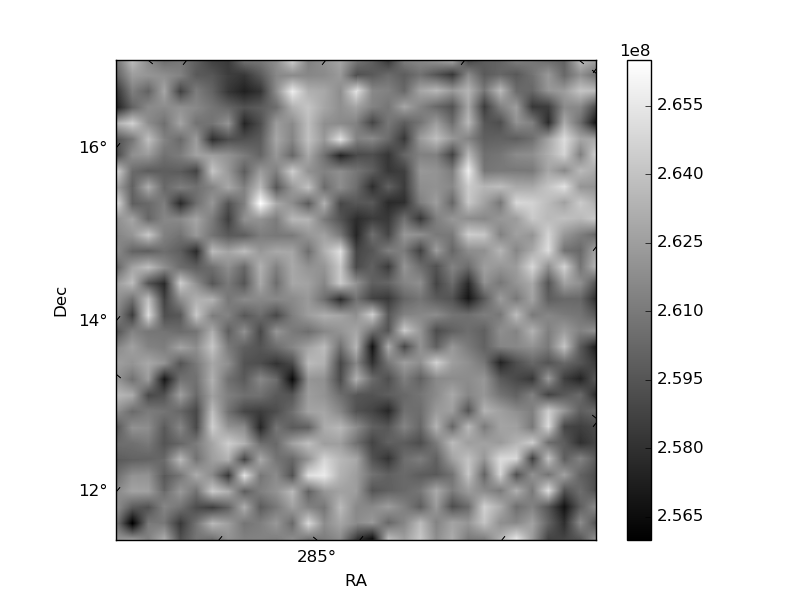
Histogram calculated using DETX and DETY for each event in the final _common_clean file
| Quadrant A | 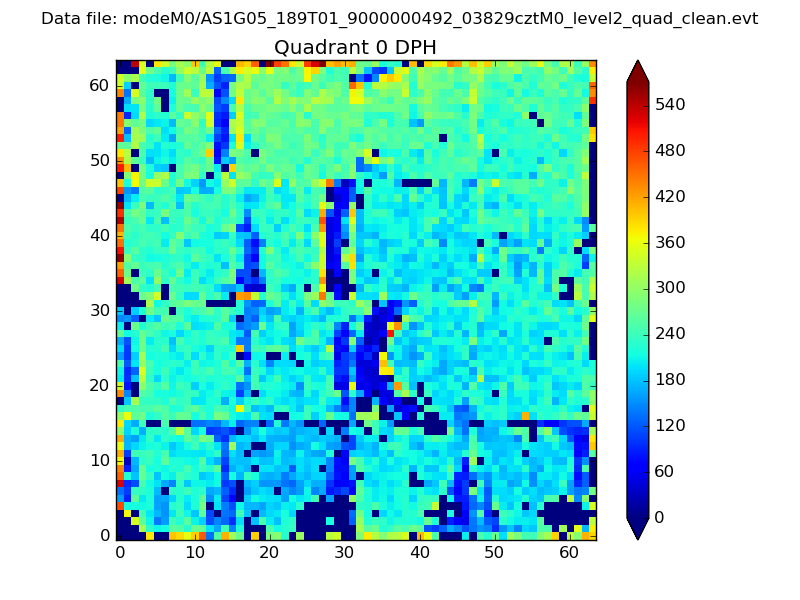 |
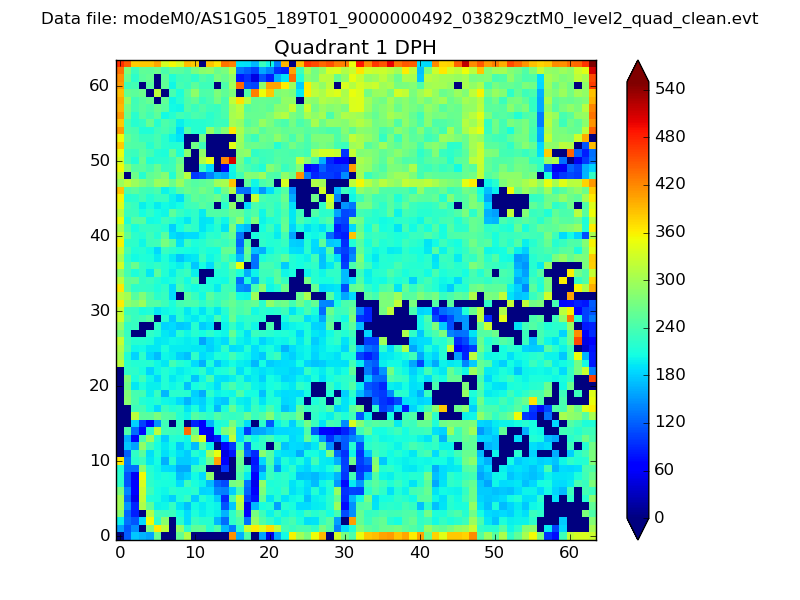 |
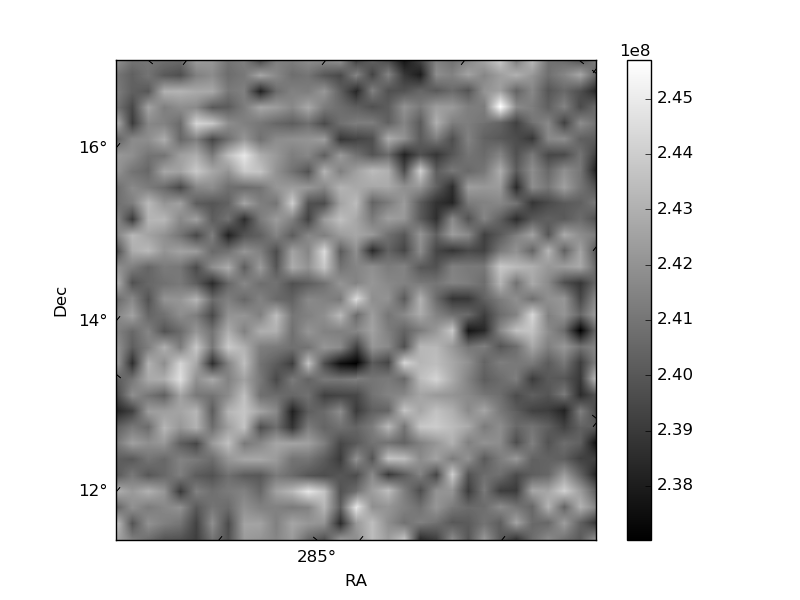
Quadrant B |
|---|---|---|---|
| Quadrant D | 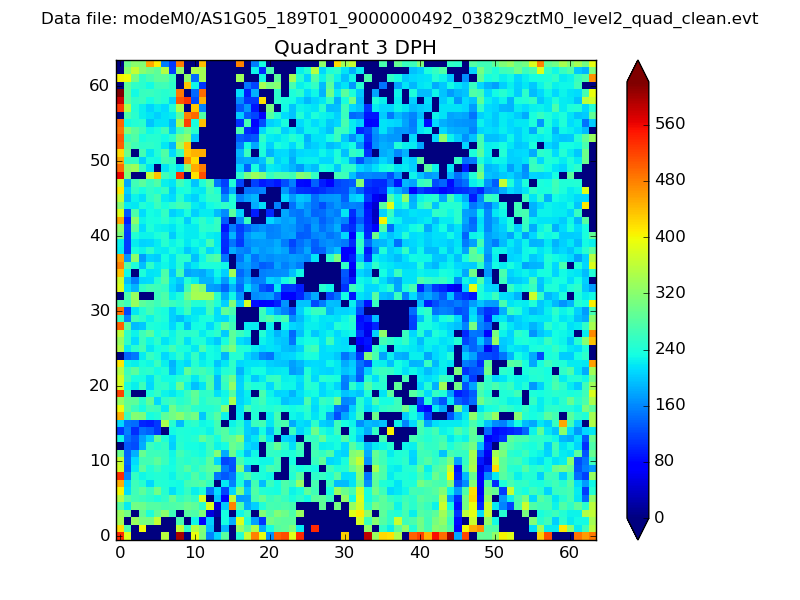 |
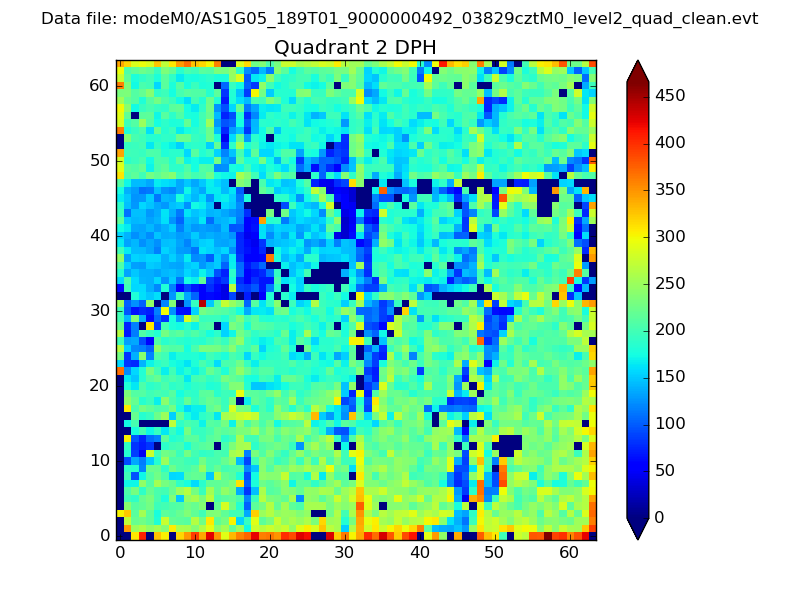 |
Quadrant C |
| Plot type | Count rate plots | Images |
|---|---|---|
| Comparison with Poisson distribution Blue bars denote a histogram of data divided into 1 sec bins. Red curve is a Poisson curve with rate = median count rate of data. |
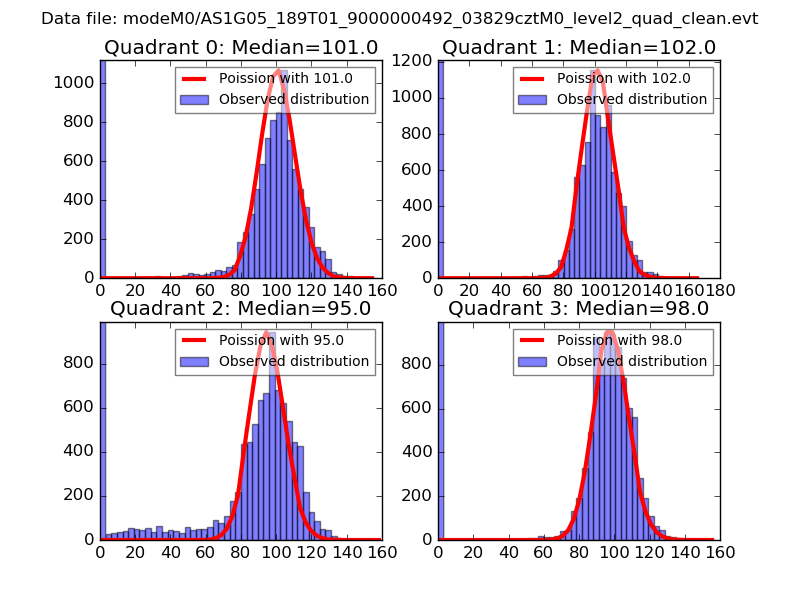 |
 |
| Quadrant-wise count rates Data is divided into 100 sec bins |
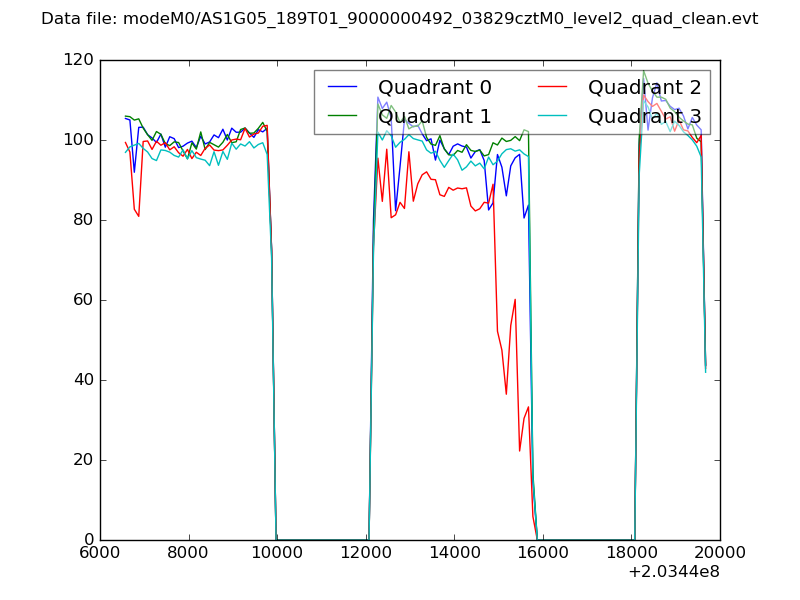 |
|
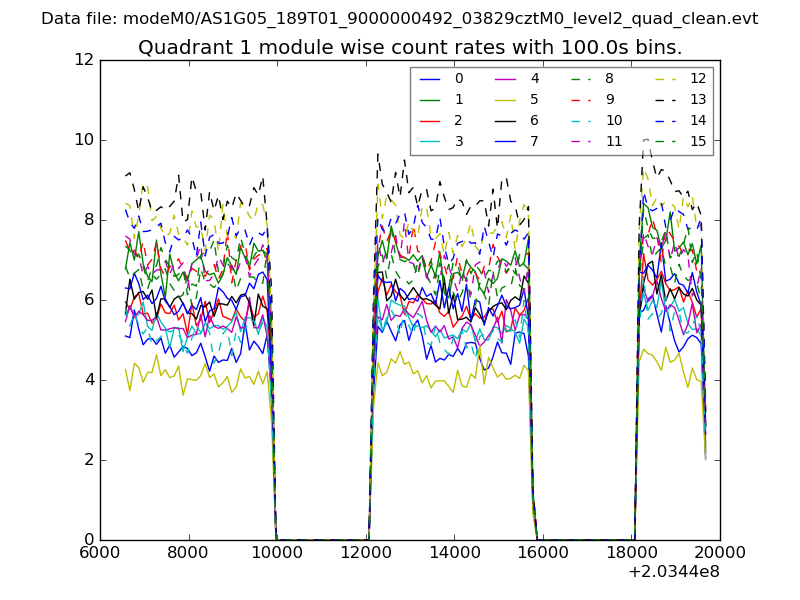
| Module-wise count rates for Quadrant A Data is divided into 100 sec bins |
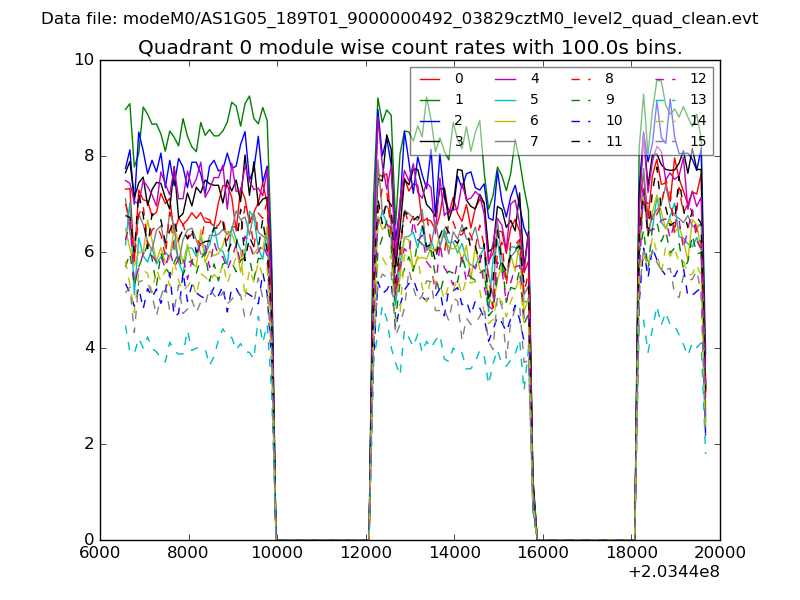 |
 |
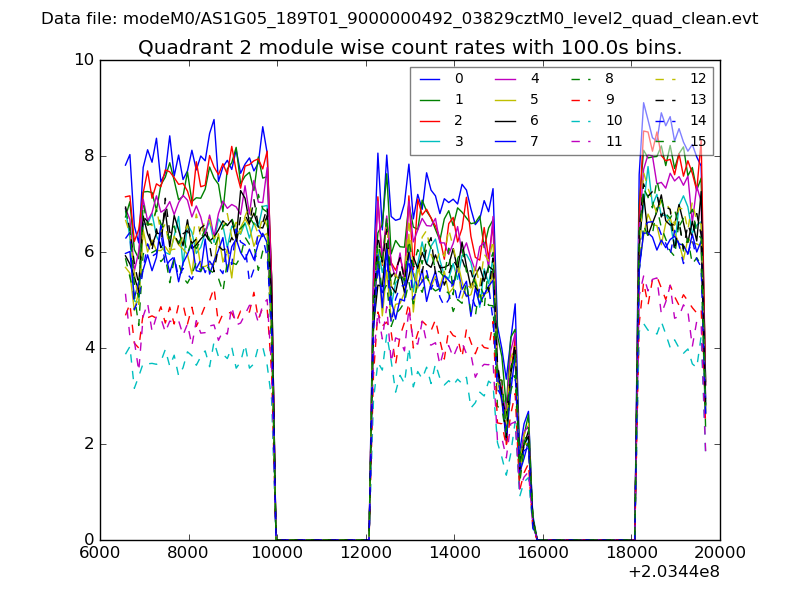
| Module-wise count rates for Quadrant B Data is divided into 100 sec bins |
 |
 |
| Module-wise count rates for Quadrant C Data is divided into 100 sec bins |
 |
 |
| Module-wise count rates for Quadrant D Data is divided into 100 sec bins |
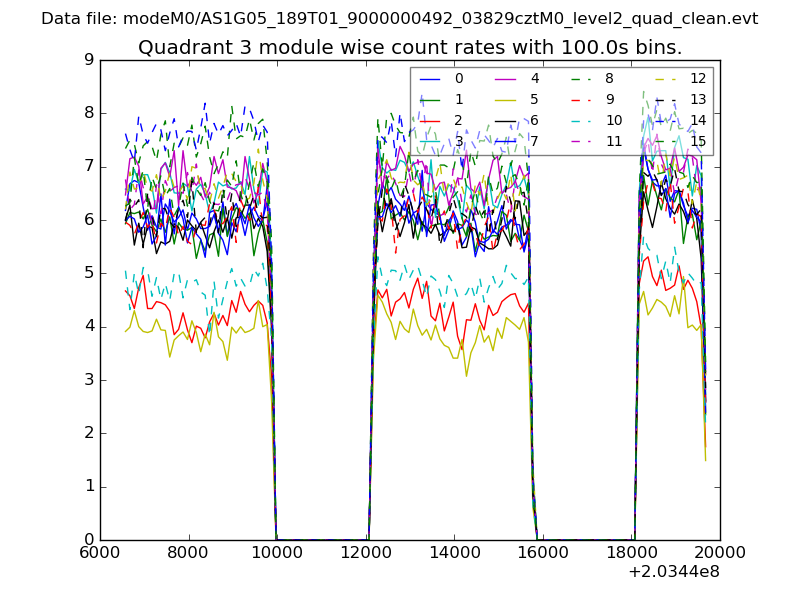 |
 |
| Parameter | Plot |
|---|---|
| CZT HV Monitor | 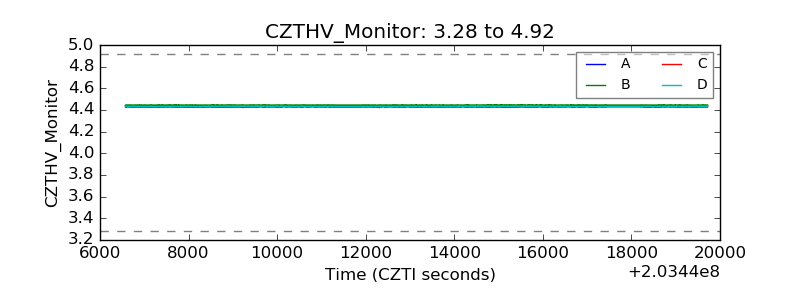 |
| D_VDD | 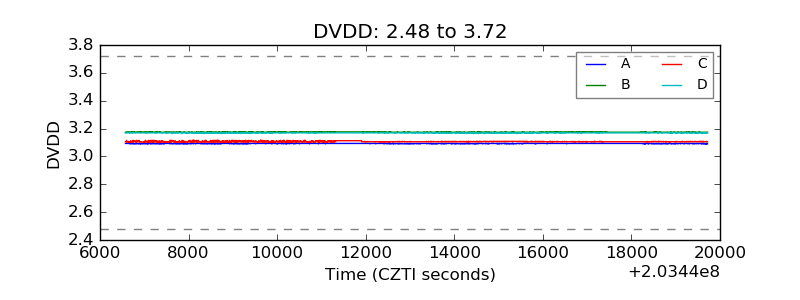 |
| Temperature 1 | 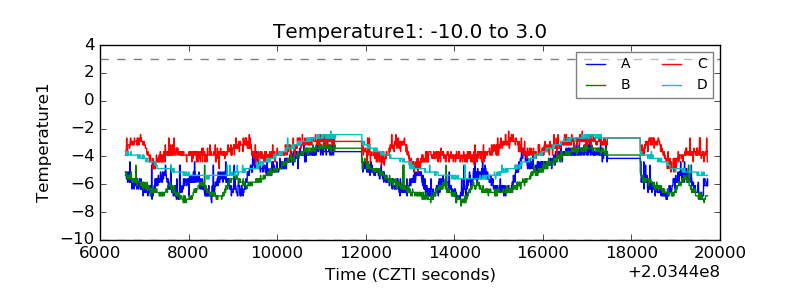 |
| Veto HV Monitor | 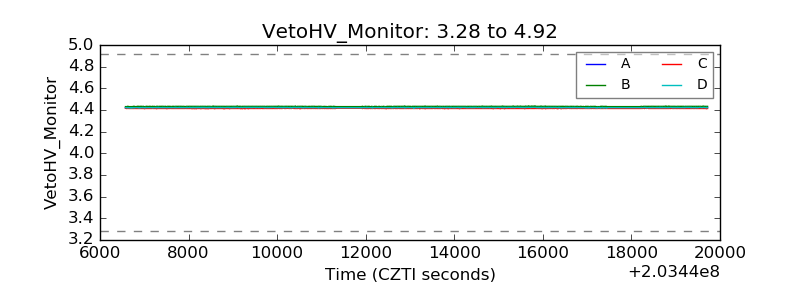 |
| Veto LLD | 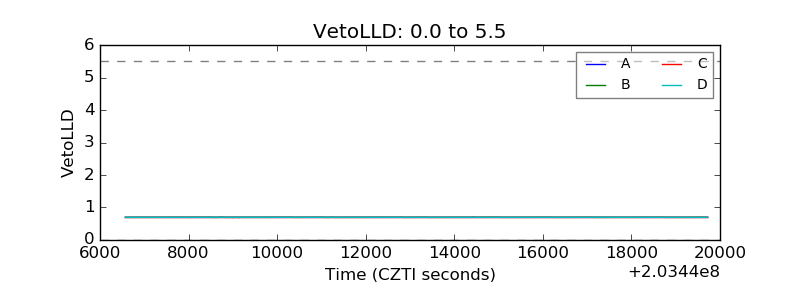 |
| Alpha Counter | 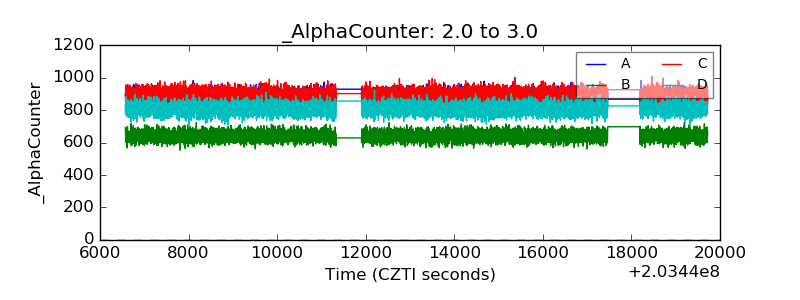 |
| _CPM_Rate | 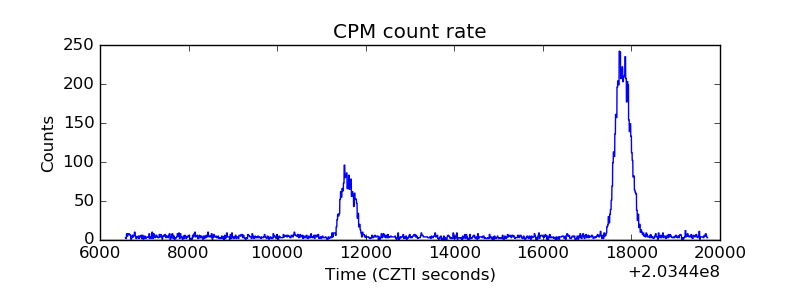 |
| CZT Counter | 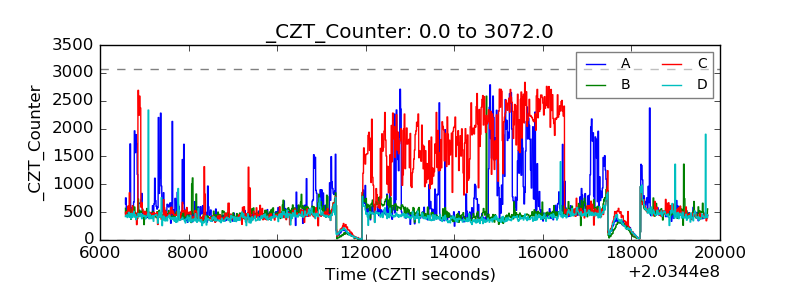 |
| +2.5 Volts monitor |  |
| +5 Volts monitor |  |
| _ROLL_ROT | 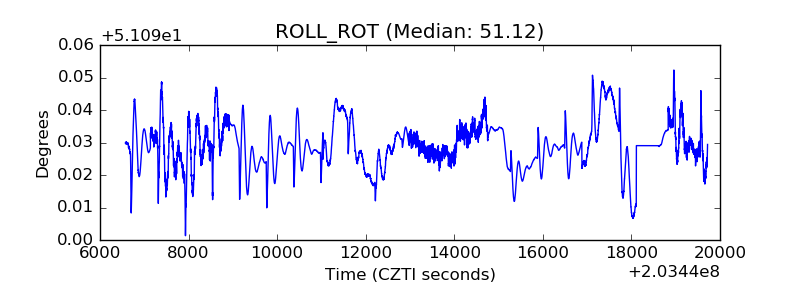 |
| _Roll_DEC | 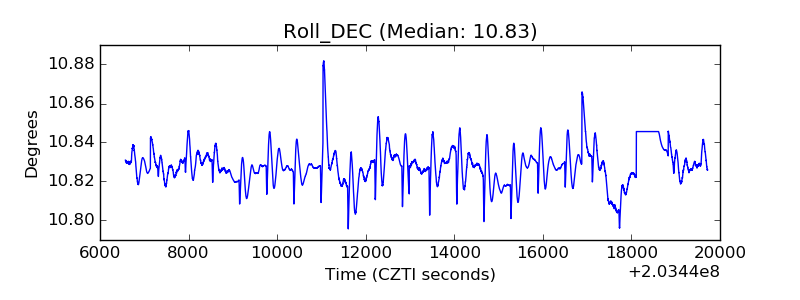 |
| _Roll_RA | 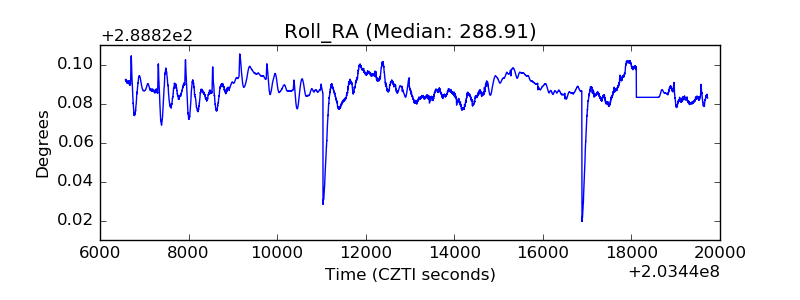 |
| Veto Counter | 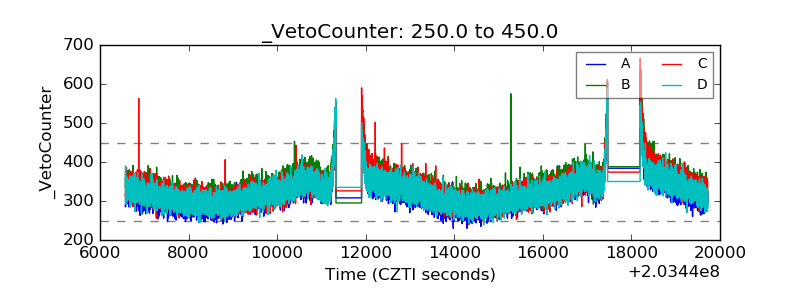 |