| Param | Original file | Final file |
|---|---|---|
| Filename | modeM0/AS1G05_189T01_9000000492_03831cztM0_level2.evt | modeM0/AS1G05_189T01_9000000492_03831cztM0_level2_quad_clean.evt |
| Size (bytes) | 430,421,760 | 68,512,320 |
| Size | 410.5 MB | 65.3 MB |
| Events in quadrant A | 3,918,559 | 409,899 |
| Events in quadrant B | 3,048,407 | 420,049 |
| Events in quadrant C | 2,800,214 | 412,785 |
| Events in quadrant D | 2,849,030 | 401,300 |
| Mode M0 | |||
|---|---|---|---|
| Quadrant | BADHDUFLAG | Total packets | Discarded packets |
| A | 0 | 16069 | 2 |
| B | 0 | 13087 | 1 |
| C | 0 | 12850 | 1 |
| D | 0 | 13123 | 1 |
| Mode M9 | |||
|---|---|---|---|
| Quadrant | BADHDUFLAG | Total packets | Discarded packets |
| A | 0 | 10 | 0 |
| B | 0 | 10 | 0 |
| C | 0 | 10 | 0 |
| D | 0 | 10 | 0 |
| Mode SS | |||
|---|---|---|---|
| Quadrant | BADHDUFLAG | Total packets | Discarded packets |
| A | 0 | 126 | 0 |
| B | 0 | 126 | 0 |
| C | 0 | 126 | 0 |
| D | 0 | 126 | 0 |
| Quadrant | Total seconds | Saturated seconds | Saturation percentage |
|---|---|---|---|
| A | 6161 | 297 | 4.820646% |
| B | 6161 | 62 | 1.006330% |
| C | 6161 | 49 | 0.795325% |
| D | 6161 | 69 | 1.119948% |
Noise dominated data is calculated using 1-second bins in cleaned event files. If a bin has >2000 counts, and if more than 50% of those come from <1% of pixels, then it is considered to be noise-dominated and hence unusable.
| Quadrant | # 1 sec bins | Bins with >0 counts | Bins with >2000 counts | High rate bins dominated by noise | Noise dominated (total time) | Noise dominated (detector-on time) | Marked lightcurve |
|---|---|---|---|---|---|---|---|
| A | 7191 | 6161 | 184 | 184 | 2.56% | 2.99% | 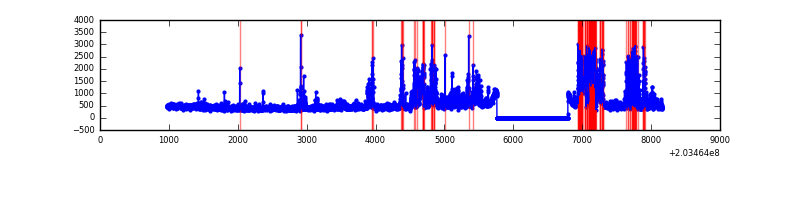 |
| B | 7191 | 6161 | 3 | 3 | 0.04% | 0.05% | 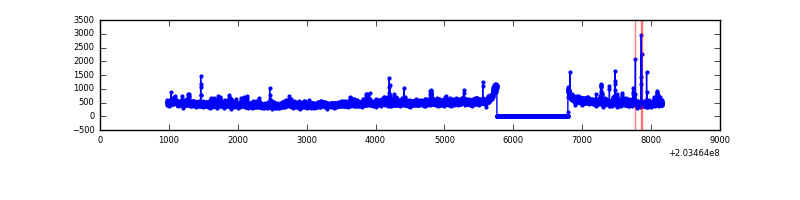 |
| C | 7191 | 6161 | 0 | 0 | 0.00% | 0.00% |  |
| D | 7191 | 6161 | 26 | 26 | 0.36% | 0.42% |  |
Top three noisy pixels from each quadrant. If the there are fewer than three noisy pixels in the level2.evt file, extra rows are filled as -1
| Pixel properties | Quadrant properties | ||||||
|---|---|---|---|---|---|---|---|
| Quadrant | DetID | PixID | Counts | Sigma | Mean | Median | Sigma |
| A | 15 | 234 | 1155341 | 8048.75 | 700 | 685 | 143.5 |
| A | 13 | 251 | 49878 | 342.91 | 700 | 685 | 143.5 |
| A | 8 | 15 | 14571 | 96.79 | 700 | 685 | 143.5 |
| B | 15 | 204 | 99287 | 712.27 | 718 | 700 | 138.4 |
| B | 14 | 167 | 61798 | 441.42 | 718 | 700 | 138.4 |
| B | 10 | 16 | 47853 | 340.67 | 718 | 700 | 138.4 |
| C | 2 | 53 | 86413 | 523.68 | 689 | 693 | 163.7 |
| C | 12 | 4 | 8004 | 44.66 | 689 | 693 | 163.7 |
| C | 13 | 61 | 5795 | 31.17 | 689 | 693 | 163.7 |
| D | 13 | 248 | 173273 | 1032.22 | 684 | 664 | 167.2 |
| D | 2 | 14 | 37468 | 220.09 | 684 | 664 | 167.2 |
| D | 2 | 32 | 17866 | 102.87 | 684 | 664 | 167.2 |
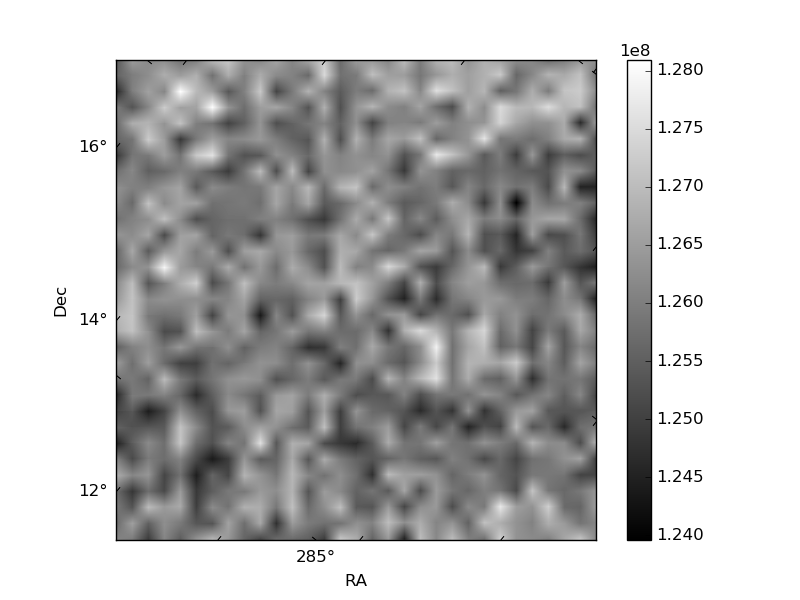
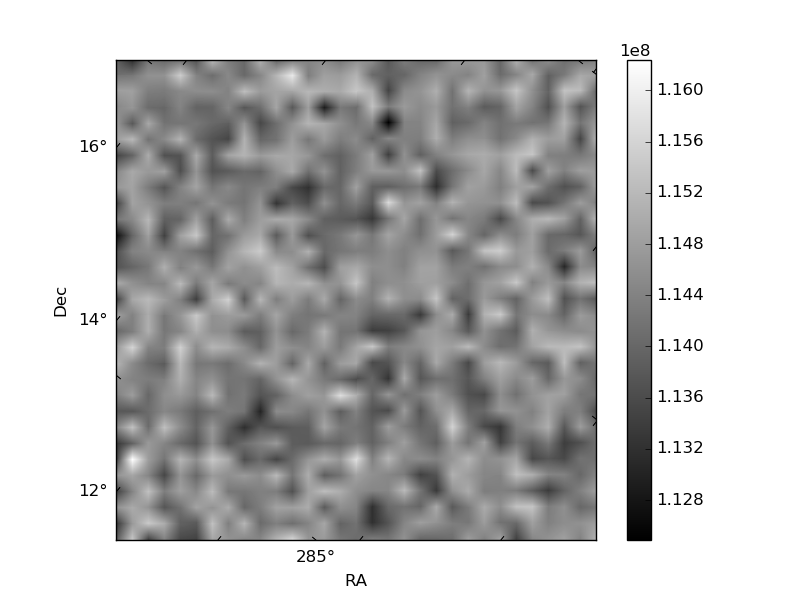
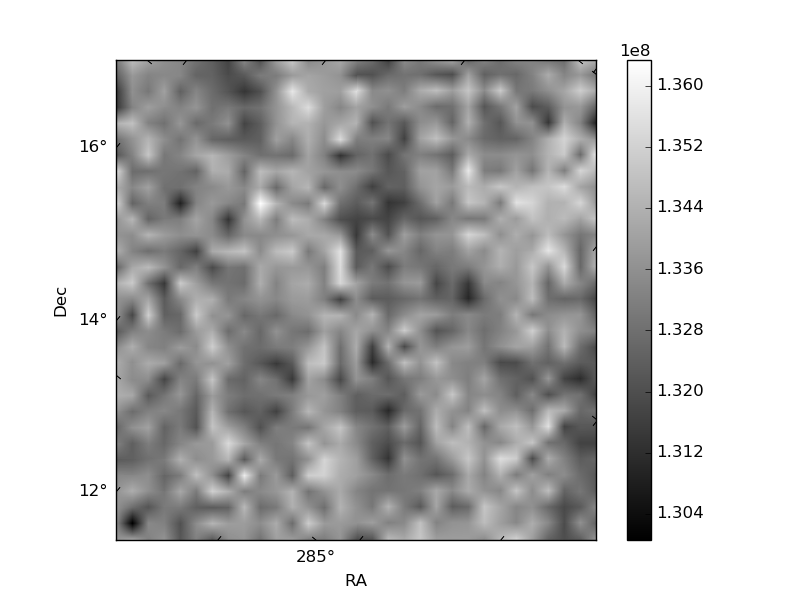
Histogram calculated using DETX and DETY for each event in the final _common_clean file
| Quadrant A | 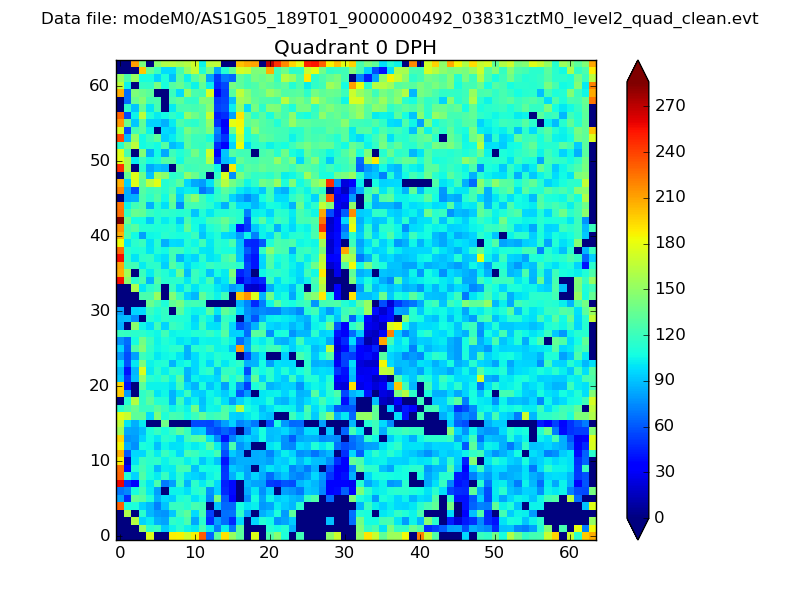 |
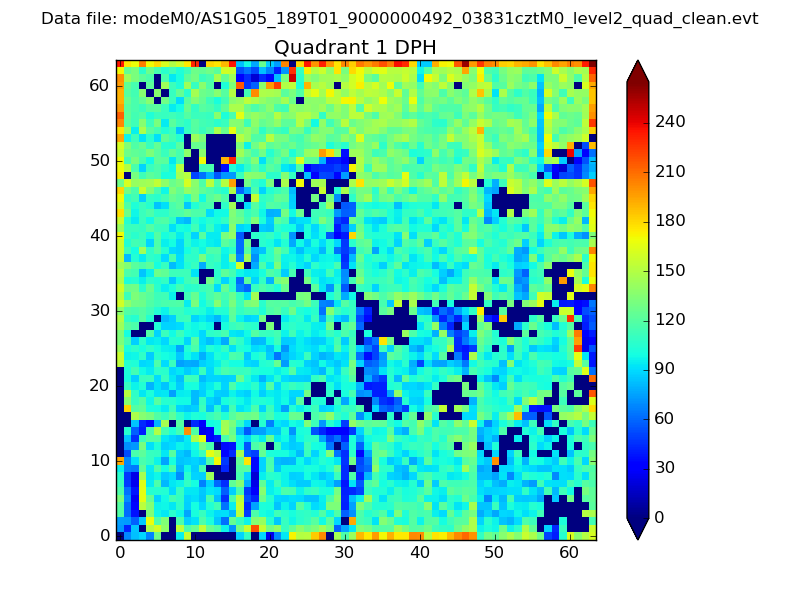 |
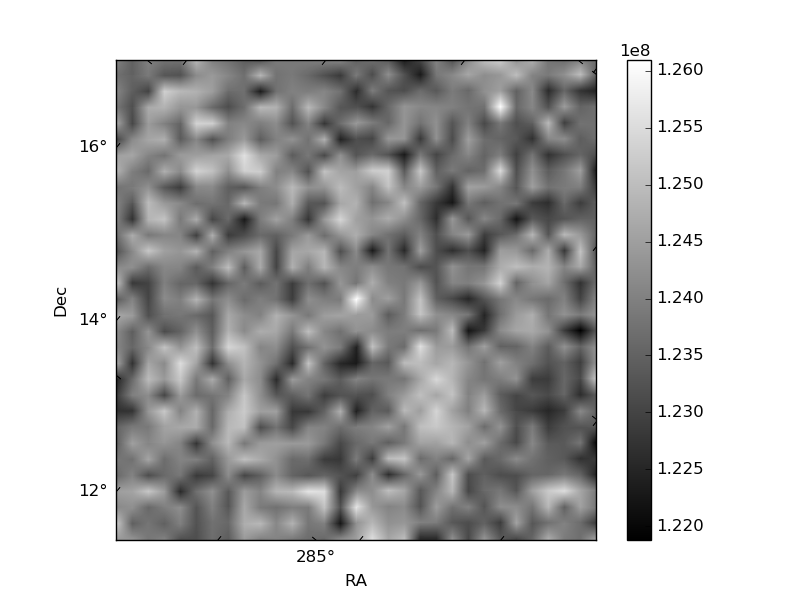
Quadrant B |
|---|---|---|---|
| Quadrant D |  |
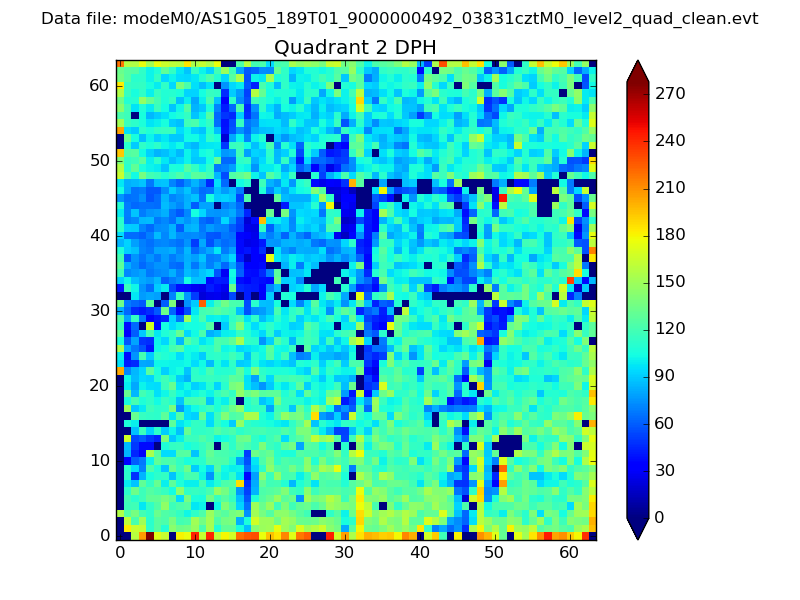 |
Quadrant C |
| Plot type | Count rate plots | Images |
|---|---|---|
| Comparison with Poisson distribution Blue bars denote a histogram of data divided into 1 sec bins. Red curve is a Poisson curve with rate = median count rate of data. |
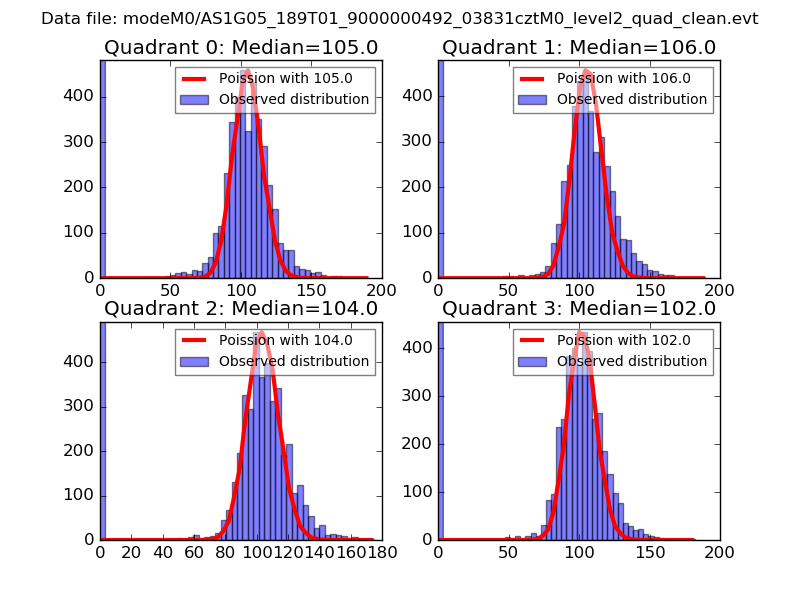 |
 |
| Quadrant-wise count rates Data is divided into 100 sec bins |
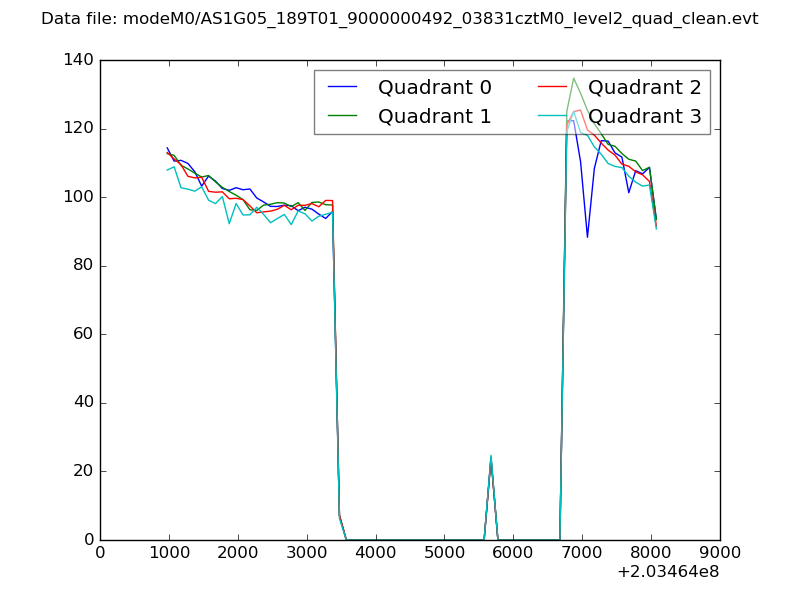 |
|
| Module-wise count rates for Quadrant A Data is divided into 100 sec bins |
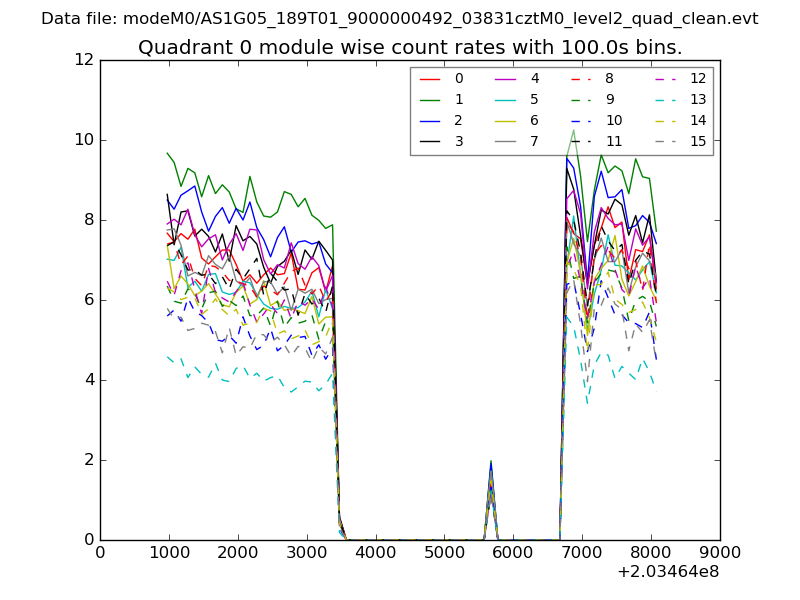 |
 |
| Module-wise count rates for Quadrant B Data is divided into 100 sec bins |
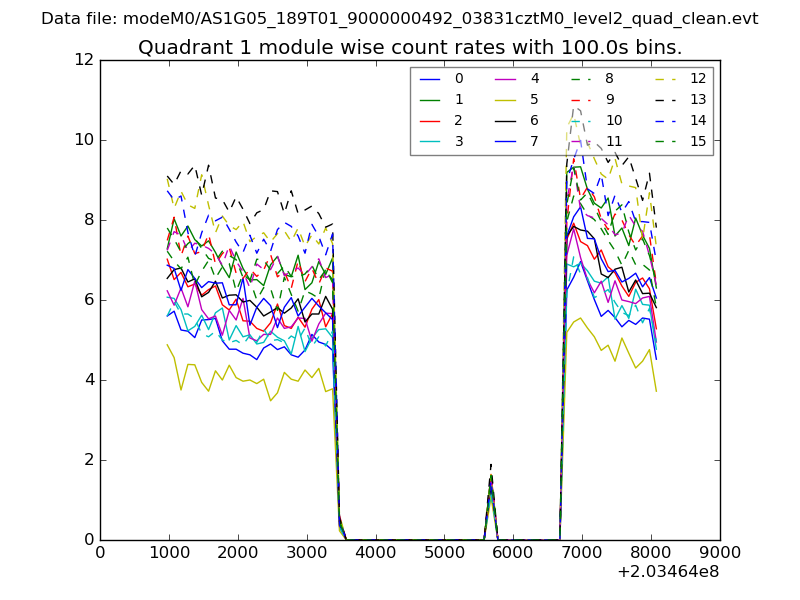 |
 |
| Module-wise count rates for Quadrant C Data is divided into 100 sec bins |
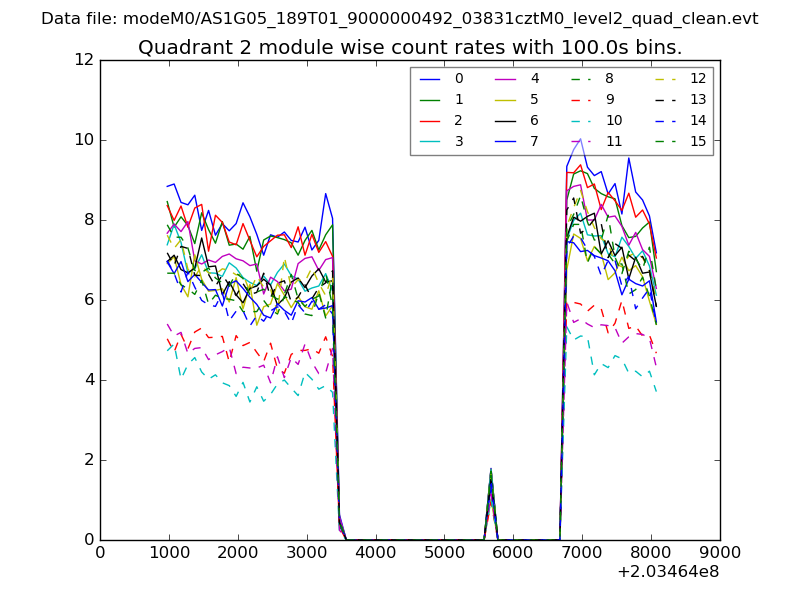 |
 |
| Module-wise count rates for Quadrant D Data is divided into 100 sec bins |
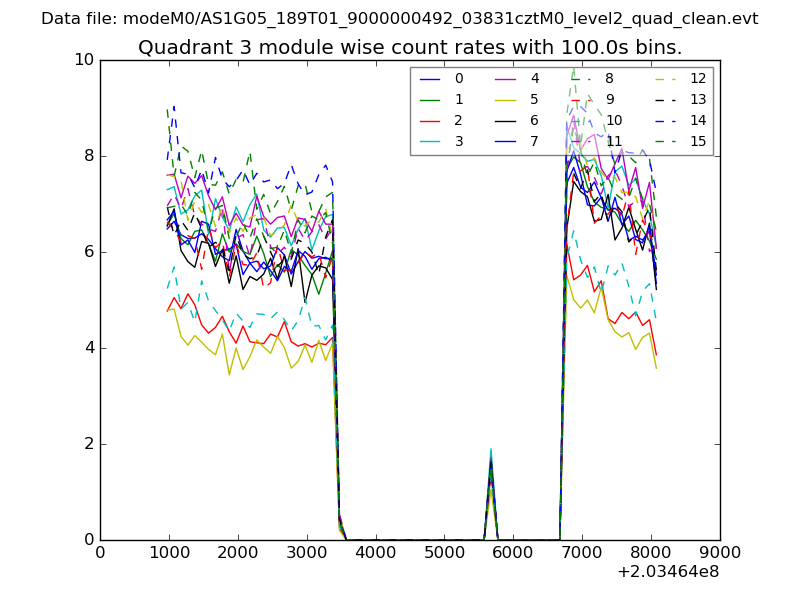 |
 |
| Parameter | Plot |
|---|---|
| CZT HV Monitor | 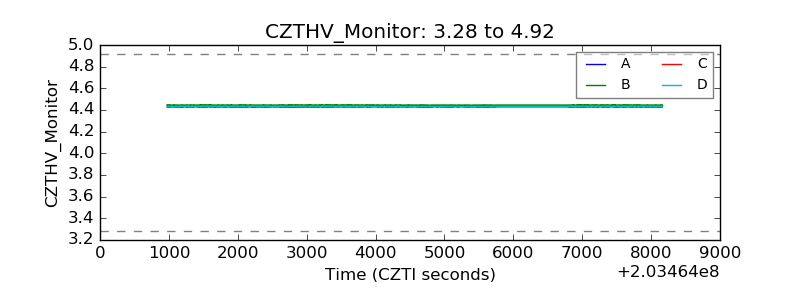 |
| D_VDD | 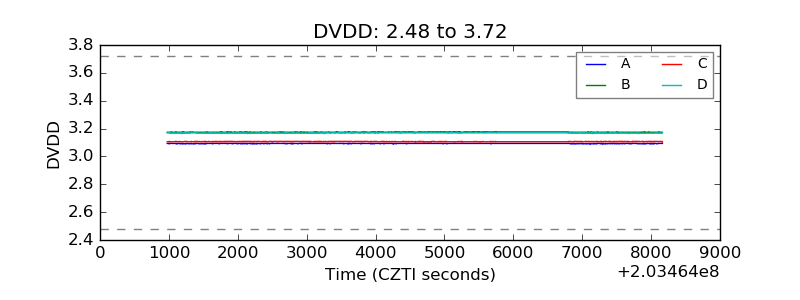 |
| Temperature 1 | 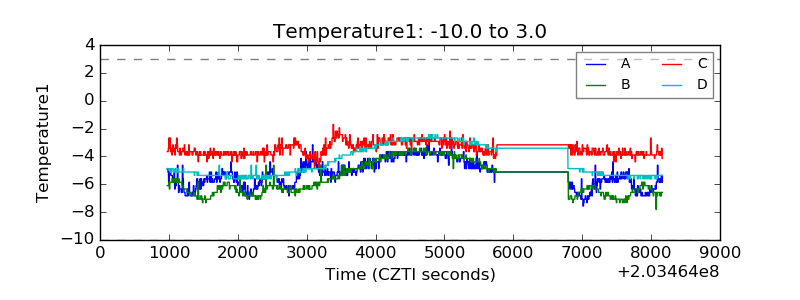 |
| Veto HV Monitor |  |
| Veto LLD | 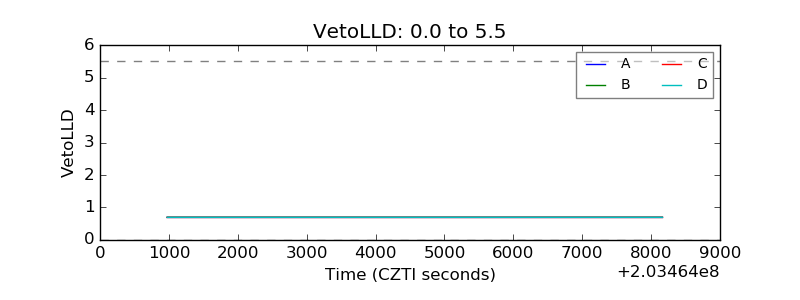 |
| Alpha Counter | 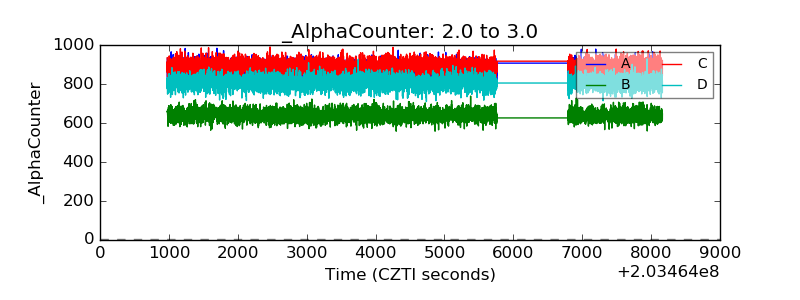 |
| _CPM_Rate | 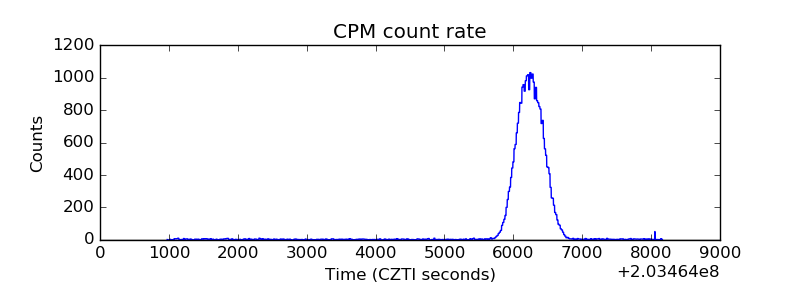 |
| CZT Counter | 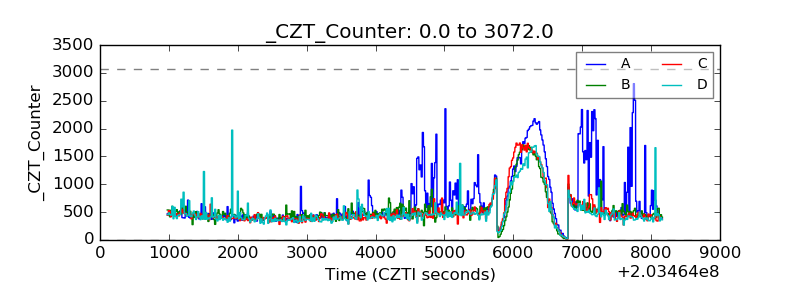 |
| +2.5 Volts monitor |  |
| +5 Volts monitor |  |
| _ROLL_ROT | 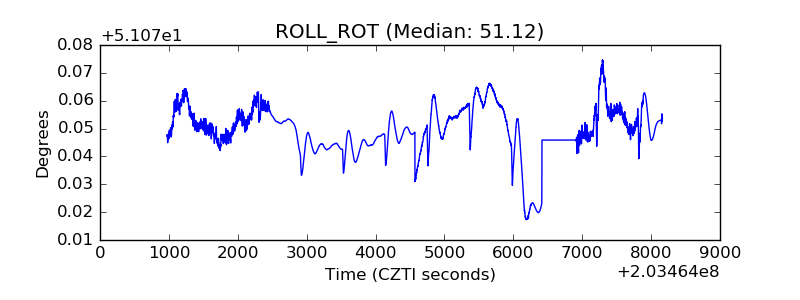 |
| _Roll_DEC | 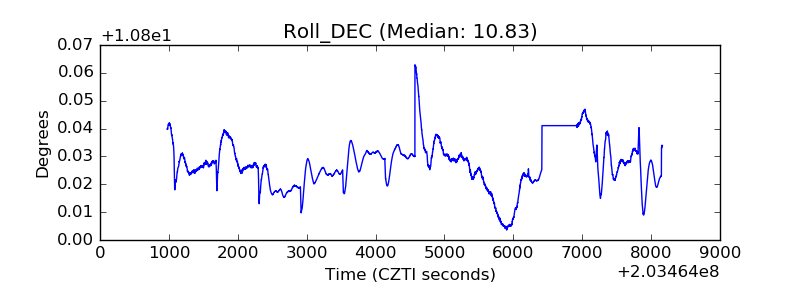 |
| _Roll_RA | 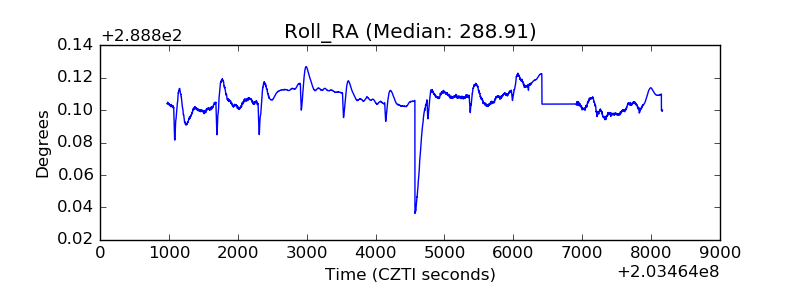 |
| Veto Counter | 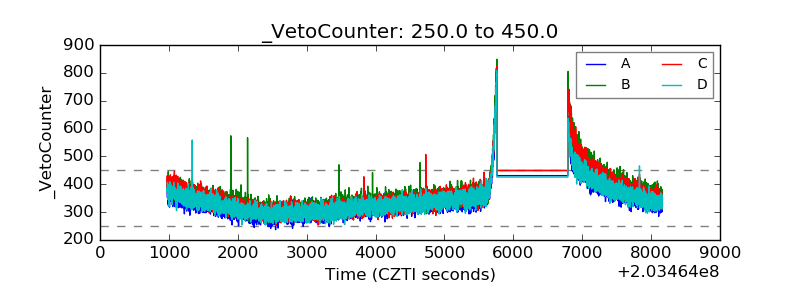 |