| Param | Original file | Final file |
|---|---|---|
| Filename | modeM0/AS1G05_189T01_9000000492_03833cztM0_level2.evt | modeM0/AS1G05_189T01_9000000492_03833cztM0_level2_quad_clean.evt |
| Size (bytes) | 465,238,080 | 75,507,840 |
| Size | 443.7 MB | 72.0 MB |
| Events in quadrant A | 4,359,522 | 460,772 |
| Events in quadrant B | 3,202,042 | 474,505 |
| Events in quadrant C | 3,079,151 | 460,261 |
| Events in quadrant D | 3,017,737 | 447,747 |
| Mode M0 | |||
|---|---|---|---|
| Quadrant | BADHDUFLAG | Total packets | Discarded packets |
| A | 0 | 17269 | 2 |
| B | 0 | 13659 | 1 |
| C | 0 | 13628 | 1 |
| D | 0 | 13619 | 1 |
| Mode M9 | |||
|---|---|---|---|
| Quadrant | BADHDUFLAG | Total packets | Discarded packets |
| A | 0 | 12 | 0 |
| B | 0 | 12 | 0 |
| C | 0 | 12 | 0 |
| D | 0 | 12 | 0 |
| Mode SS | |||
|---|---|---|---|
| Quadrant | BADHDUFLAG | Total packets | Discarded packets |
| A | 0 | 128 | 0 |
| B | 0 | 128 | 0 |
| C | 0 | 128 | 0 |
| D | 0 | 128 | 0 |
| Quadrant | Total seconds | Saturated seconds | Saturation percentage |
|---|---|---|---|
| A | 6351 | 308 | 4.849630% |
| B | 6351 | 54 | 0.850260% |
| C | 6351 | 50 | 0.787278% |
| D | 6351 | 45 | 0.708550% |
Noise dominated data is calculated using 1-second bins in cleaned event files. If a bin has >2000 counts, and if more than 50% of those come from <1% of pixels, then it is considered to be noise-dominated and hence unusable.
| Quadrant | # 1 sec bins | Bins with >0 counts | Bins with >2000 counts | High rate bins dominated by noise | Noise dominated (total time) | Noise dominated (detector-on time) | Marked lightcurve |
|---|---|---|---|---|---|---|---|
| A | 7516 | 6351 | 210 | 210 | 2.79% | 3.31% | 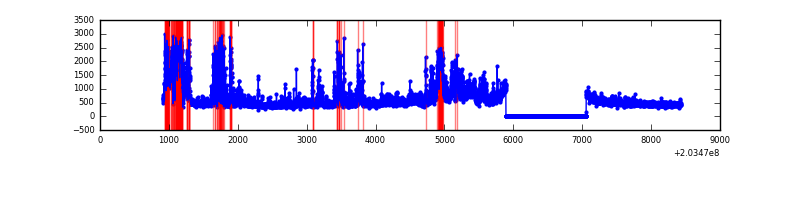 |
| B | 7516 | 6351 | 8 | 8 | 0.11% | 0.13% | 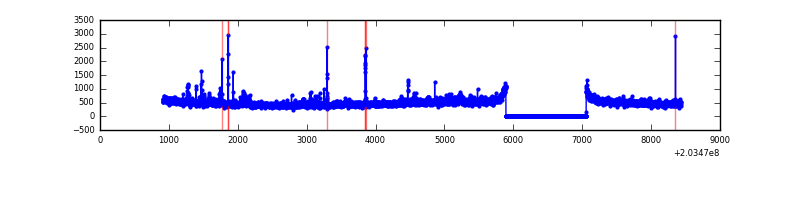 |
| C | 7516 | 6351 | 22 | 22 | 0.29% | 0.35% | 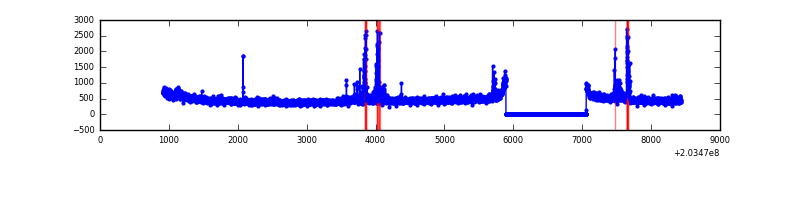 |
| D | 7516 | 6352 | 29 | 29 | 0.39% | 0.46% | 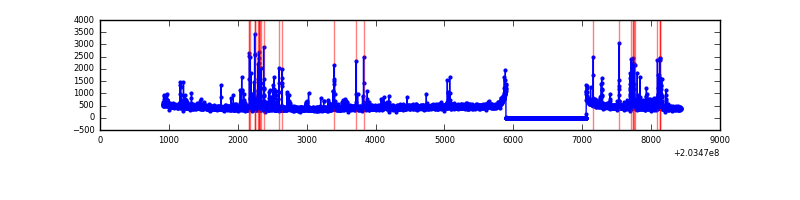 |
Top three noisy pixels from each quadrant. If the there are fewer than three noisy pixels in the level2.evt file, extra rows are filled as -1
| Pixel properties | Quadrant properties | ||||||
|---|---|---|---|---|---|---|---|
| Quadrant | DetID | PixID | Counts | Sigma | Mean | Median | Sigma |
| A | 15 | 234 | 1476003 | 9876.43 | 736 | 722 | 149.4 |
| A | 8 | 15 | 23020 | 149.28 | 736 | 722 | 149.4 |
| A | 15 | 174 | 14984 | 95.48 | 736 | 722 | 149.4 |
| B | 15 | 204 | 126027 | 868.24 | 756 | 738 | 144.3 |
| B | 10 | 16 | 72191 | 495.16 | 756 | 738 | 144.3 |
| B | 14 | 167 | 34235 | 232.13 | 756 | 738 | 144.3 |
| C | 2 | 53 | 126731 | 749.52 | 721 | 725 | 168.1 |
| C | 10 | 65 | 104117 | 615.0 | 721 | 725 | 168.1 |
| C | 9 | 247 | 11437 | 63.72 | 721 | 725 | 168.1 |
| D | 13 | 248 | 249277 | 1435.36 | 716 | 694 | 173.2 |
| D | 2 | 14 | 21194 | 118.37 | 716 | 694 | 173.2 |
| D | 5 | 233 | 15528 | 85.65 | 716 | 694 | 173.2 |
Histogram calculated using DETX and DETY for each event in the final _common_clean file
| Quadrant A | 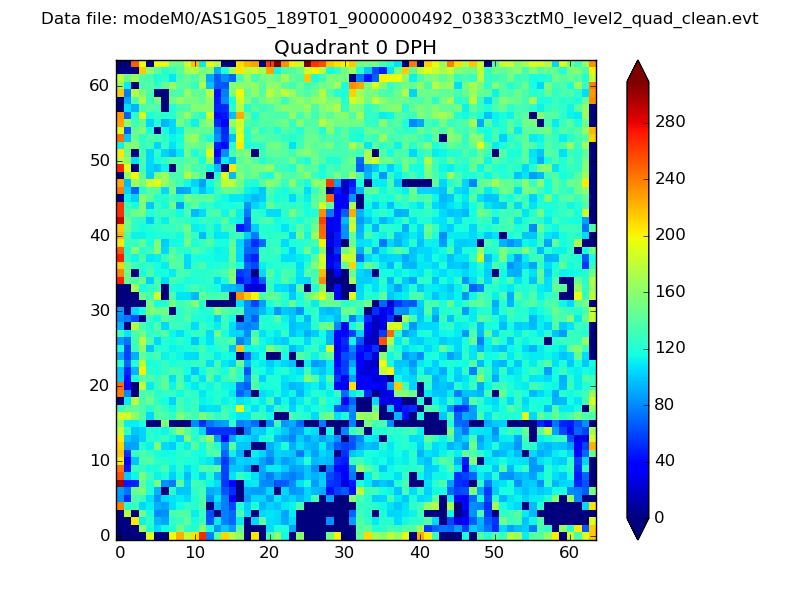 |
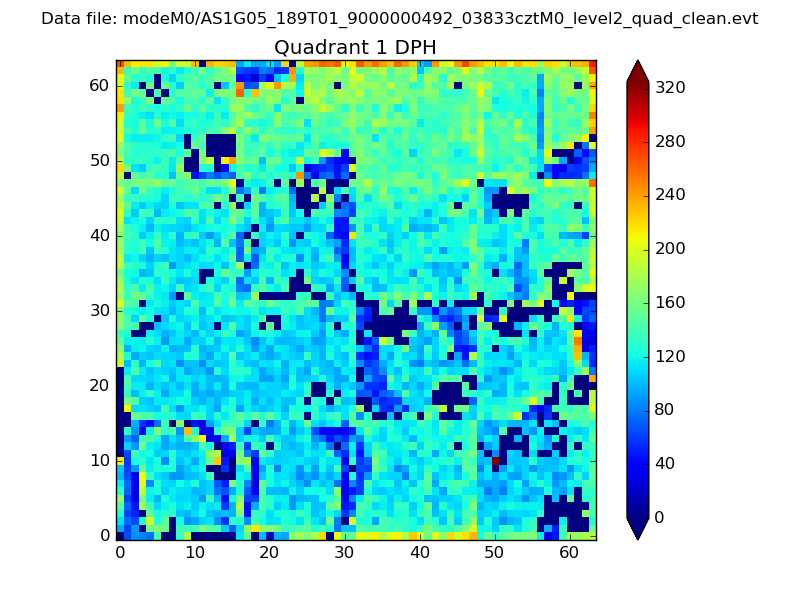 |
Quadrant B |
|---|---|---|---|
| Quadrant D | 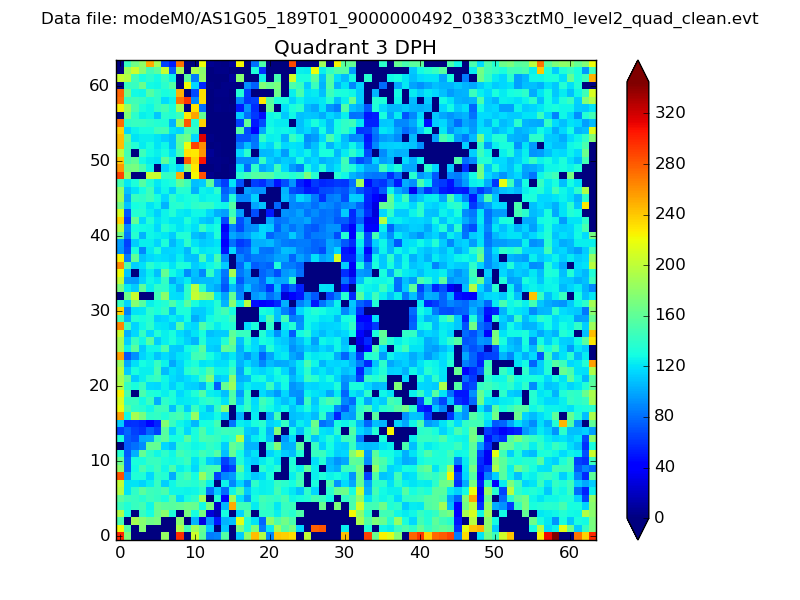 |
 |
Quadrant C |
| Plot type | Count rate plots | Images |
|---|---|---|
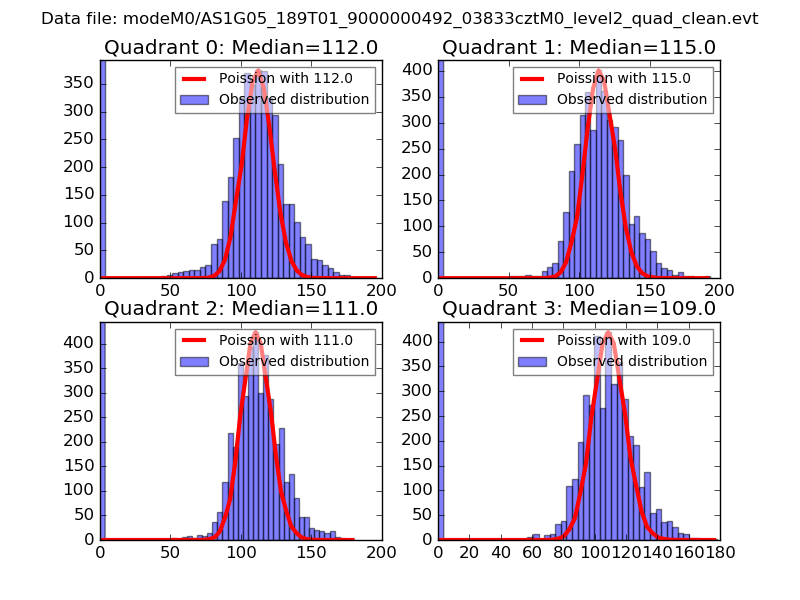
| Comparison with Poisson distribution Blue bars denote a histogram of data divided into 1 sec bins. Red curve is a Poisson curve with rate = median count rate of data. |
 |
 |
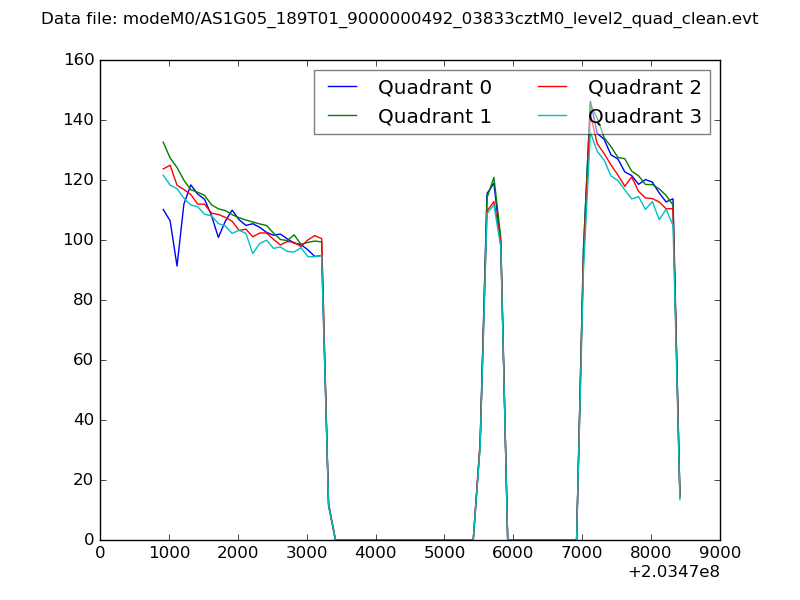
| Quadrant-wise count rates Data is divided into 100 sec bins |
 |
|
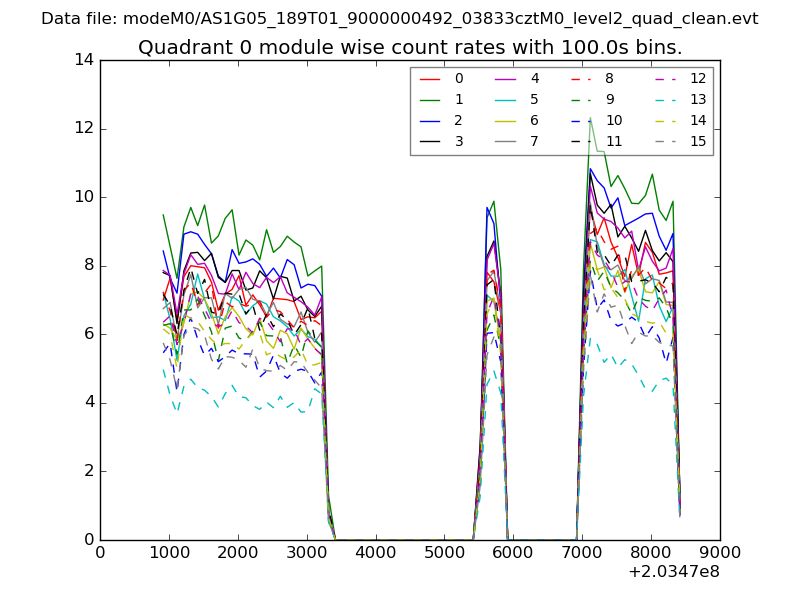
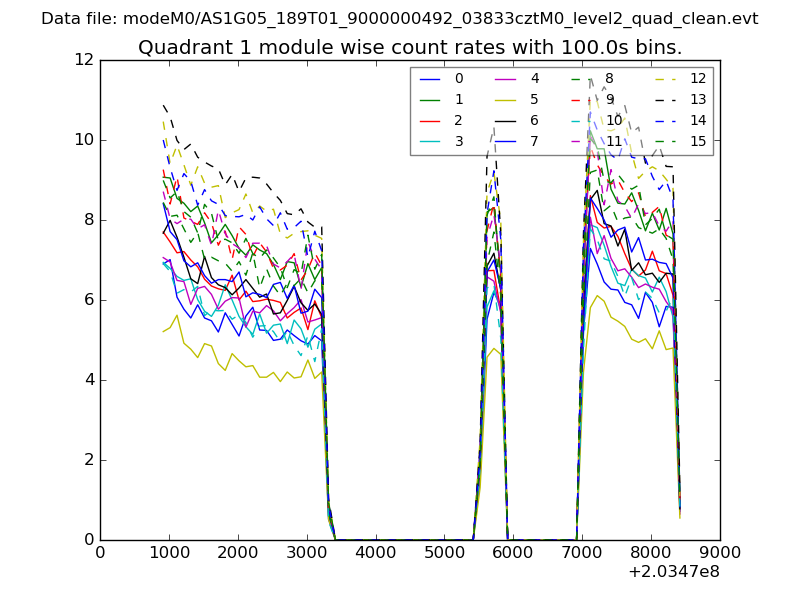
| Module-wise count rates for Quadrant A Data is divided into 100 sec bins |
 |
 |
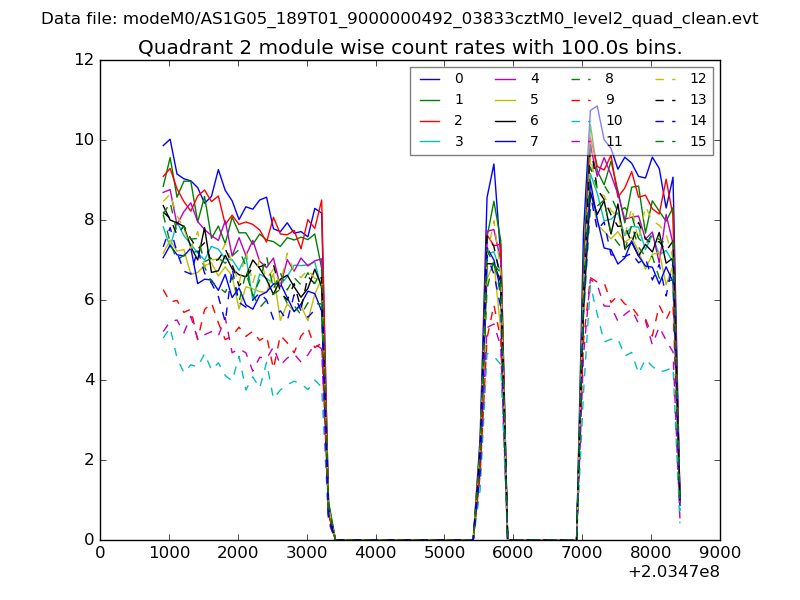
| Module-wise count rates for Quadrant B Data is divided into 100 sec bins |
 |
 |
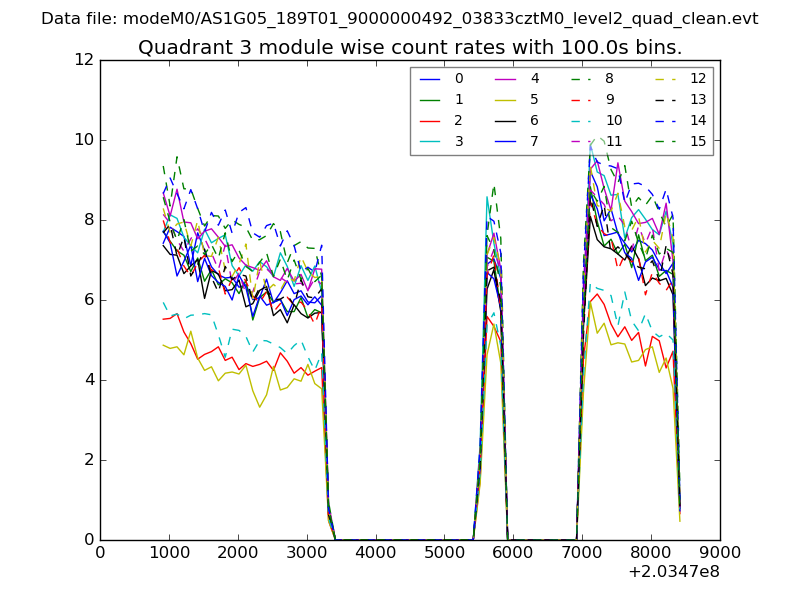
| Module-wise count rates for Quadrant C Data is divided into 100 sec bins |
 |
 |
| Module-wise count rates for Quadrant D Data is divided into 100 sec bins |
 |
 |
| Parameter | Plot |
|---|---|
| CZT HV Monitor | 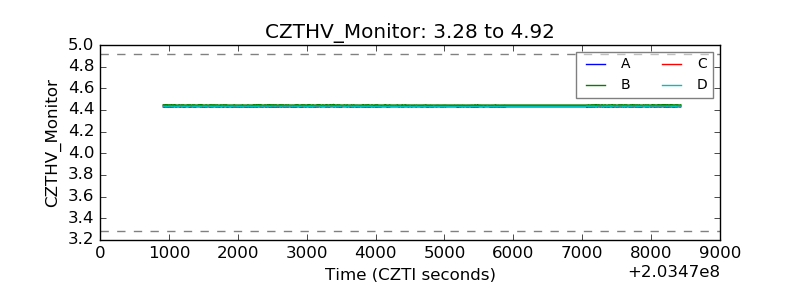 |
| D_VDD | 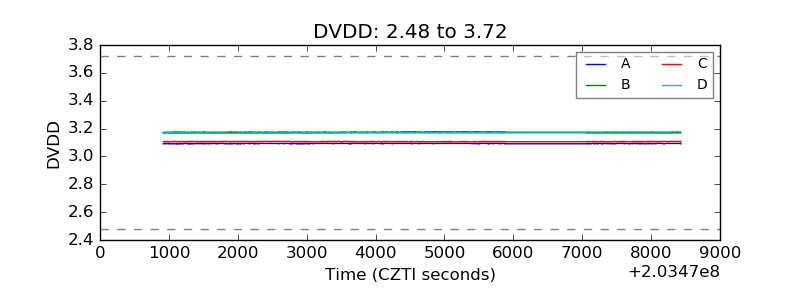 |
| Temperature 1 | 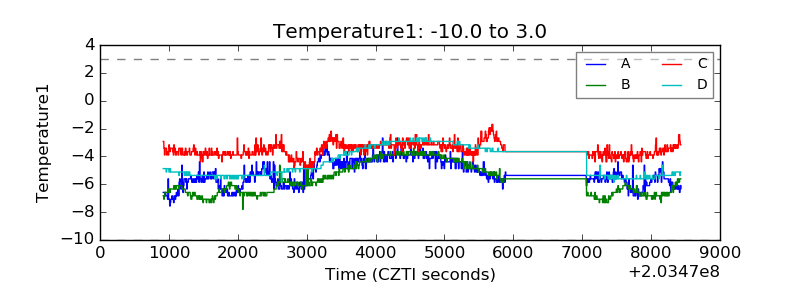 |
| Veto HV Monitor | 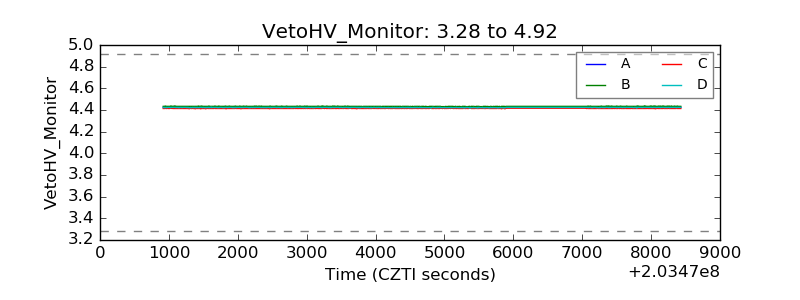 |
| Veto LLD |  |
| Alpha Counter | 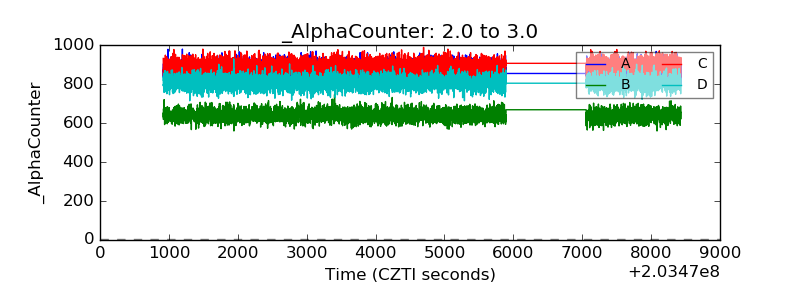 |
| _CPM_Rate | 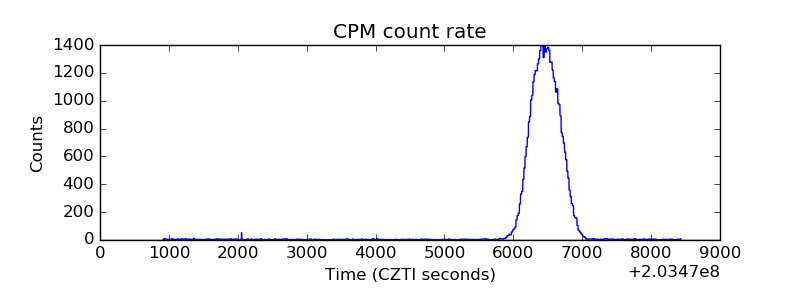 |
| CZT Counter | 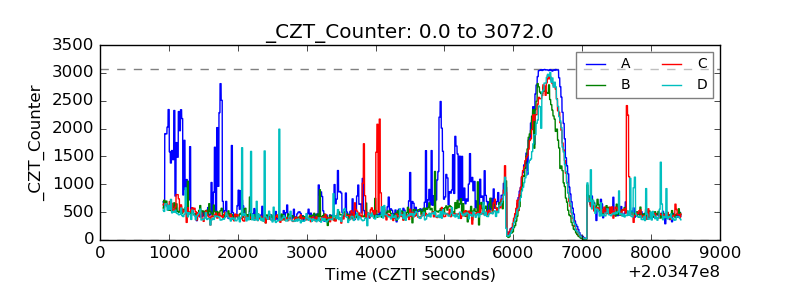 |
| +2.5 Volts monitor |  |
| +5 Volts monitor |  |
| Veto Counter | 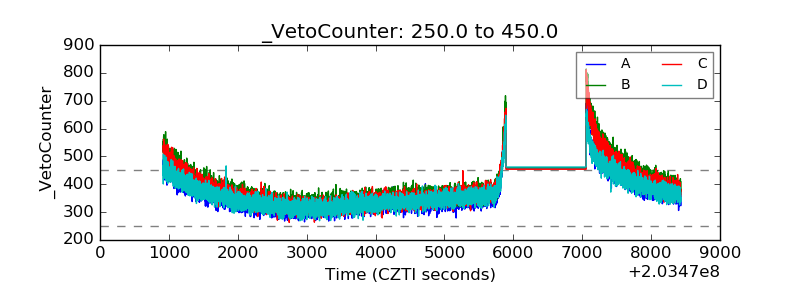 |