| Param | Original file | Final file |
|---|---|---|
| Filename | modeM0/AS1G05_189T01_9000000492_03834cztM0_level2.evt | modeM0/AS1G05_189T01_9000000492_03834cztM0_level2_quad_clean.evt |
| Size (bytes) | 382,426,560 | 65,609,280 |
| Size | 364.7 MB | 62.6 MB |
| Events in quadrant A | 2,992,528 | 404,928 |
| Events in quadrant B | 2,900,828 | 409,116 |
| Events in quadrant C | 2,649,784 | 394,032 |
| Events in quadrant D | 2,655,755 | 385,119 |
| Mode M0 | |||
|---|---|---|---|
| Quadrant | BADHDUFLAG | Total packets | Discarded packets |
| A | 0 | 12499 | 2 |
| B | 0 | 12033 | 1 |
| C | 0 | 11676 | 1 |
| D | 0 | 11985 | 1 |
| Mode M9 | |||
|---|---|---|---|
| Quadrant | BADHDUFLAG | Total packets | Discarded packets |
| A | 0 | 13 | 0 |
| B | 0 | 13 | 0 |
| C | 0 | 13 | 0 |
| D | 0 | 13 | 0 |
| Mode SS | |||
|---|---|---|---|
| Quadrant | BADHDUFLAG | Total packets | Discarded packets |
| A | 0 | 114 | 0 |
| B | 0 | 114 | 0 |
| C | 0 | 114 | 0 |
| D | 0 | 114 | 0 |
| Quadrant | Total seconds | Saturated seconds | Saturation percentage |
|---|---|---|---|
| A | 5626 | 62 | 1.102026% |
| B | 5626 | 64 | 1.137576% |
| C | 5626 | 54 | 0.959829% |
| D | 5626 | 46 | 0.817632% |
Noise dominated data is calculated using 1-second bins in cleaned event files. If a bin has >2000 counts, and if more than 50% of those come from <1% of pixels, then it is considered to be noise-dominated and hence unusable.
| Quadrant | # 1 sec bins | Bins with >0 counts | Bins with >2000 counts | High rate bins dominated by noise | Noise dominated (total time) | Noise dominated (detector-on time) | Marked lightcurve |
|---|---|---|---|---|---|---|---|
| A | 6851 | 5626 | 10 | 10 | 0.15% | 0.18% | 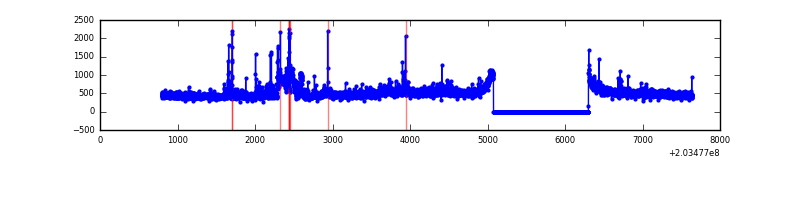 |
| B | 6851 | 5626 | 2 | 2 | 0.03% | 0.04% | 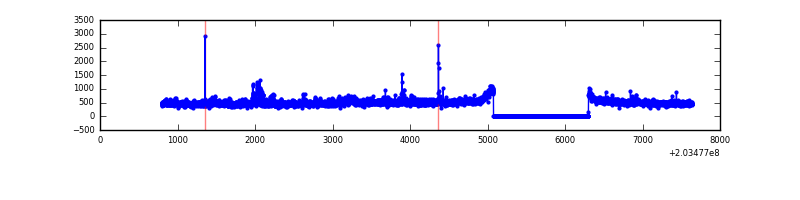 |
| C | 6851 | 5626 | 6 | 6 | 0.09% | 0.11% | 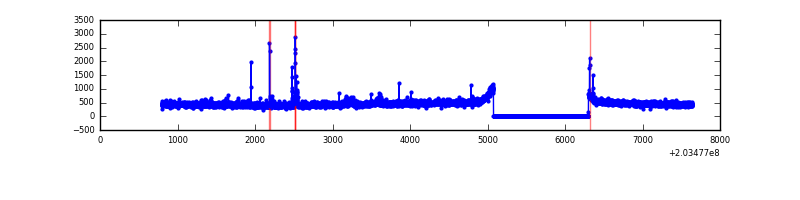 |
| D | 6851 | 5627 | 20 | 20 | 0.29% | 0.36% | 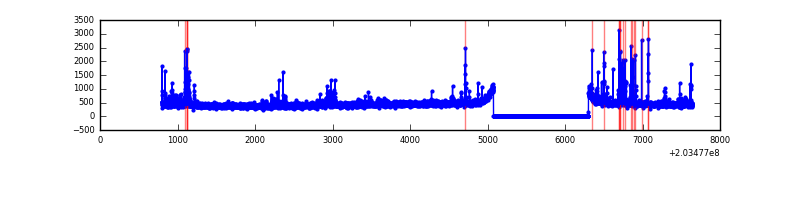 |
Top three noisy pixels from each quadrant. If the there are fewer than three noisy pixels in the level2.evt file, extra rows are filled as -1
| Pixel properties | Quadrant properties | ||||||
|---|---|---|---|---|---|---|---|
| Quadrant | DetID | PixID | Counts | Sigma | Mean | Median | Sigma |
| A | 15 | 234 | 311004 | 2232.7 | 682 | 669 | 139.0 |
| A | 13 | 251 | 27296 | 191.57 | 682 | 669 | 139.0 |
| A | 0 | 199 | 17718 | 122.66 | 682 | 669 | 139.0 |
| B | 15 | 204 | 110627 | 842.63 | 686 | 670 | 130.5 |
| B | 14 | 167 | 79863 | 606.87 | 686 | 670 | 130.5 |
| B | 4 | 81 | 33933 | 254.9 | 686 | 670 | 130.5 |
| C | 2 | 53 | 51538 | 332.89 | 651 | 655 | 152.9 |
| C | 9 | 247 | 17428 | 109.73 | 651 | 655 | 152.9 |
| C | 10 | 65 | 14551 | 90.91 | 651 | 655 | 152.9 |
| D | 13 | 248 | 163204 | 1018.89 | 651 | 633 | 159.6 |
| D | 2 | 14 | 17684 | 106.86 | 651 | 633 | 159.6 |
| D | 13 | 223 | 10652 | 62.79 | 651 | 633 | 159.6 |
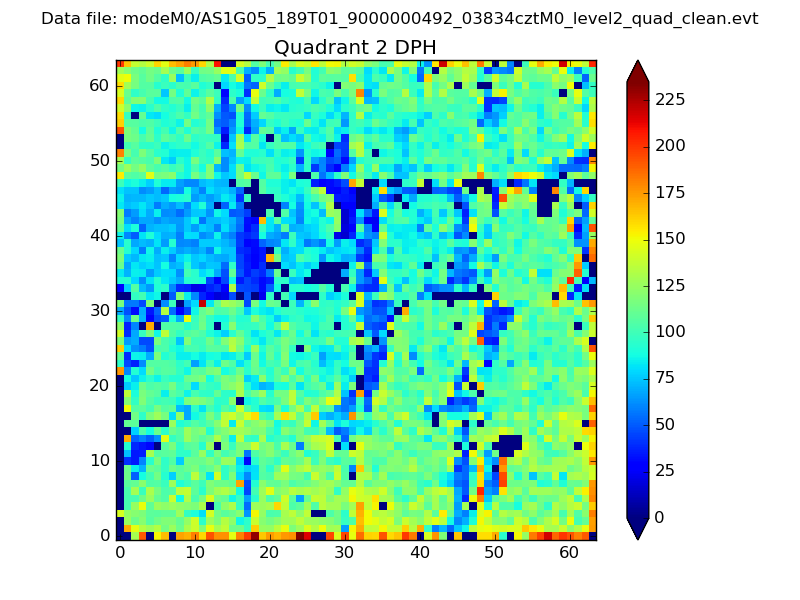
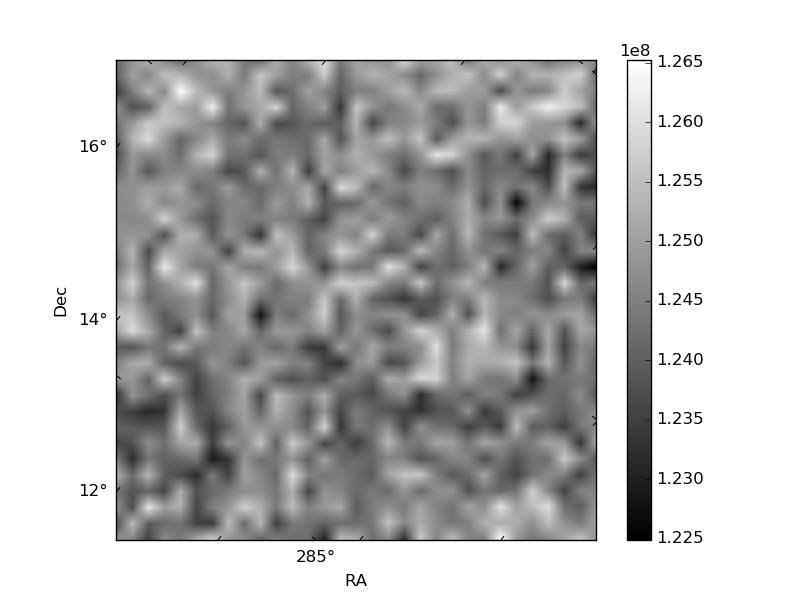
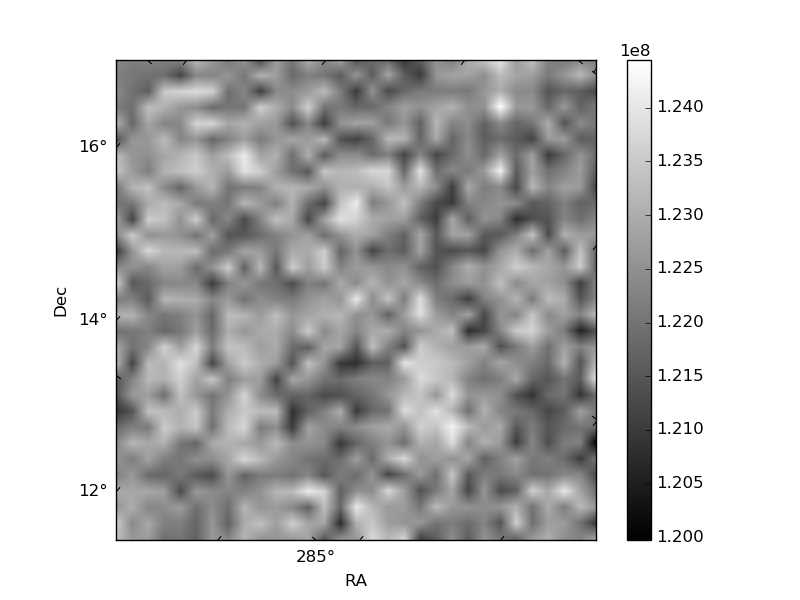
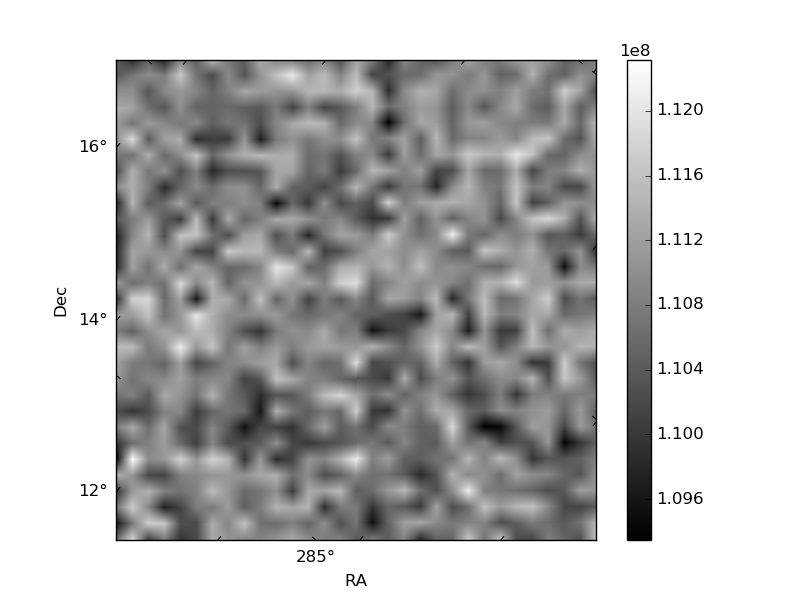
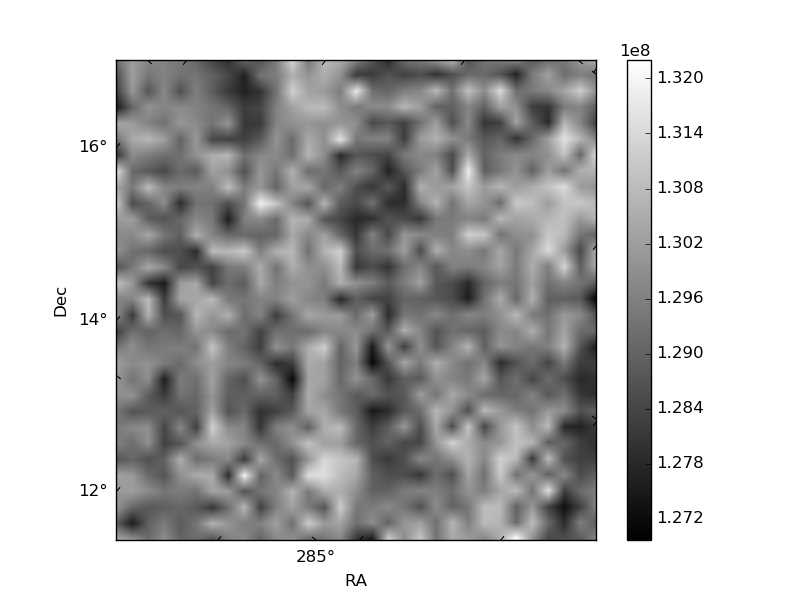
Histogram calculated using DETX and DETY for each event in the final _common_clean file
| Quadrant A | 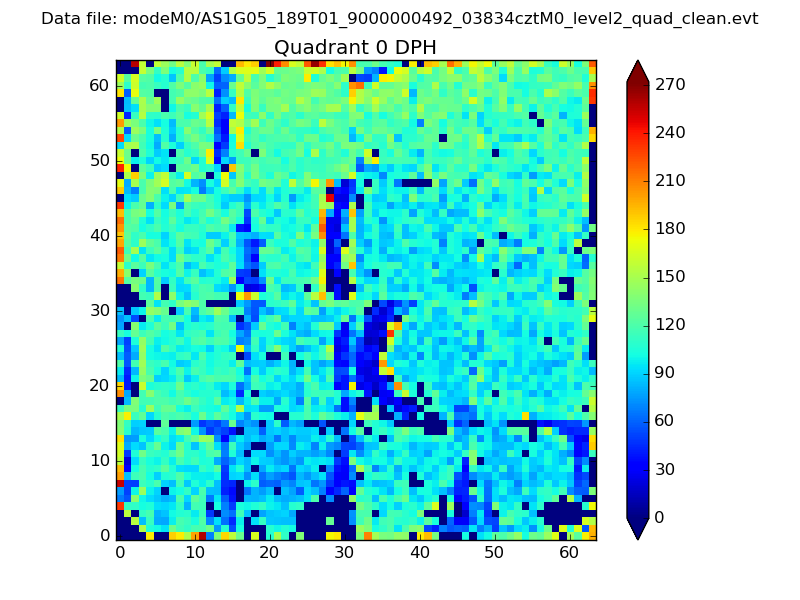 |
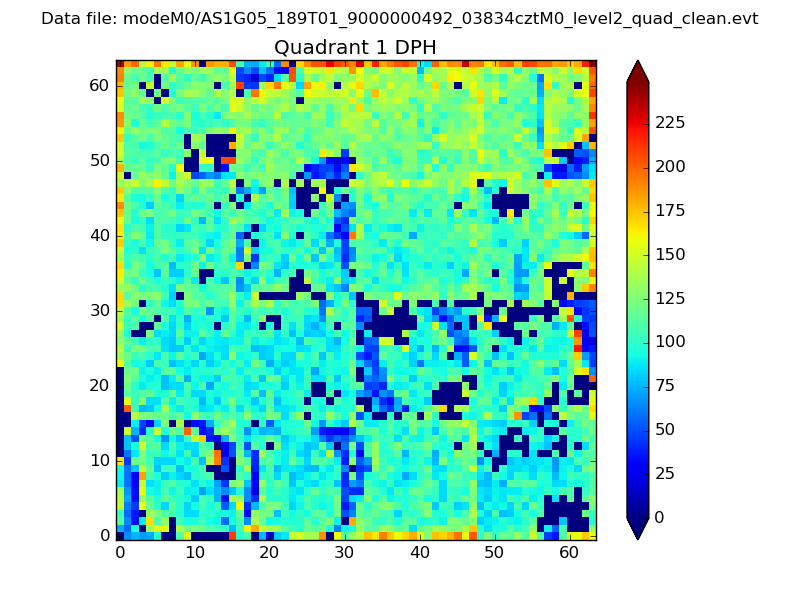 |
Quadrant B |
|---|---|---|---|
| Quadrant D | 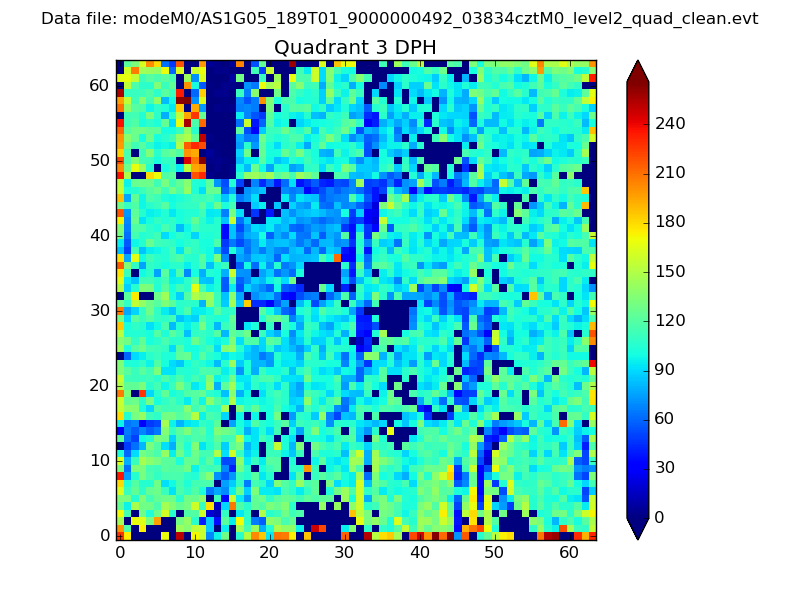 |
 |
Quadrant C |
| Plot type | Count rate plots | Images |
|---|---|---|
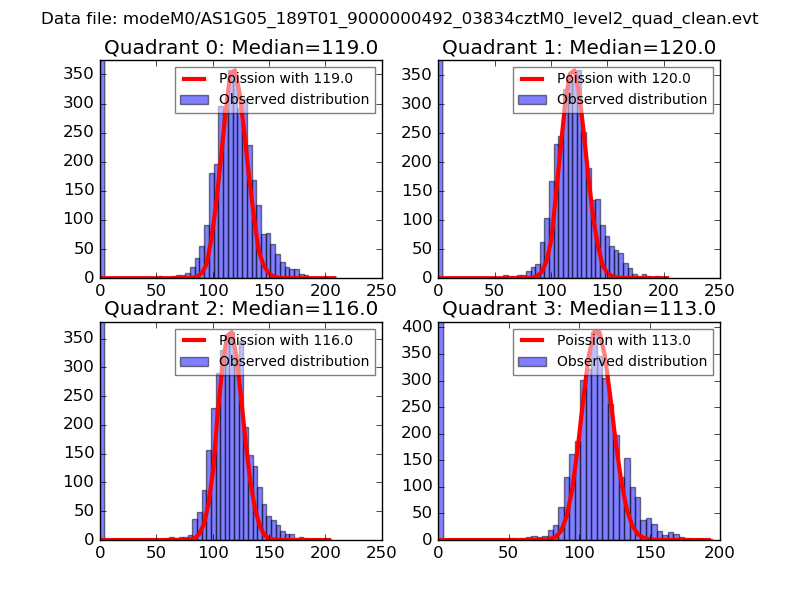
| Comparison with Poisson distribution Blue bars denote a histogram of data divided into 1 sec bins. Red curve is a Poisson curve with rate = median count rate of data. |
 |
 |
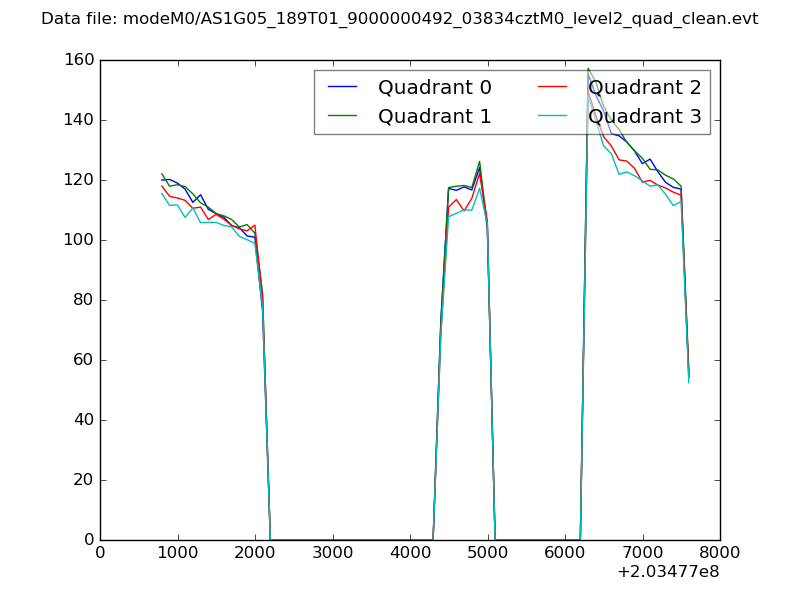
| Quadrant-wise count rates Data is divided into 100 sec bins |
 |
|
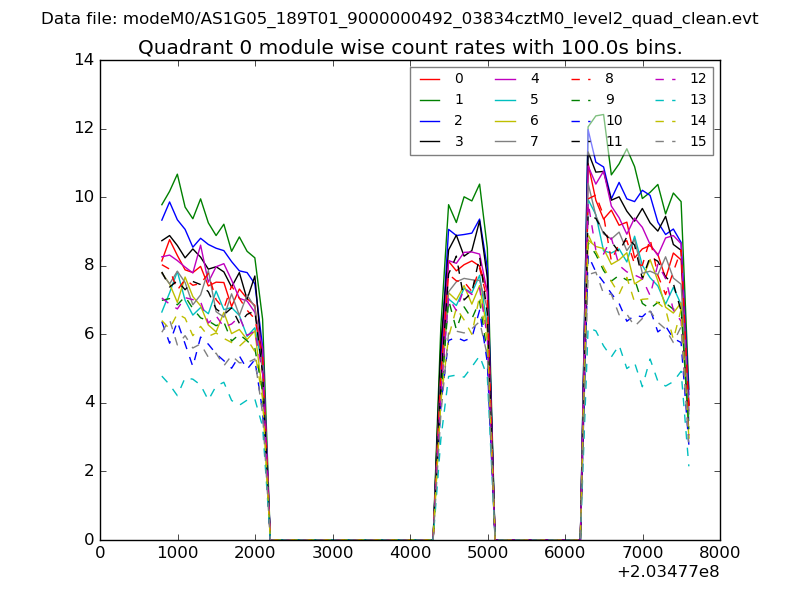
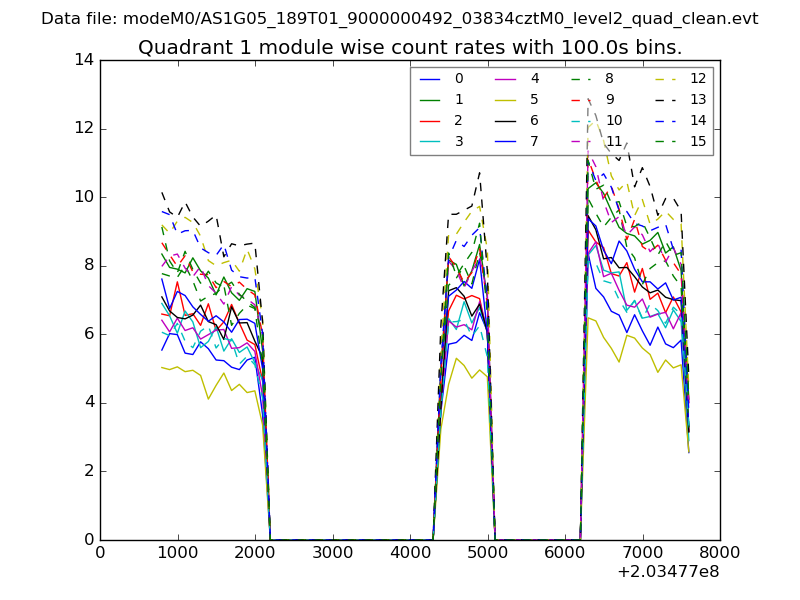
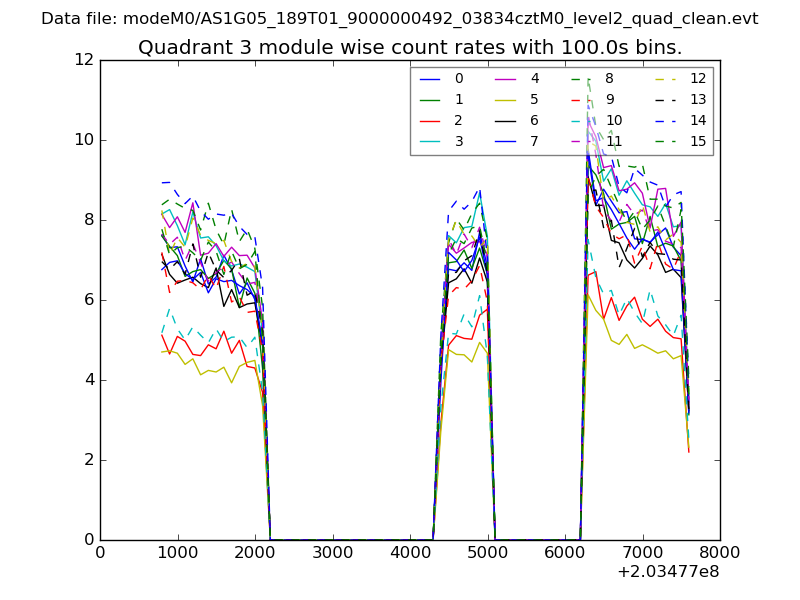
| Module-wise count rates for Quadrant A Data is divided into 100 sec bins |
 |
 |
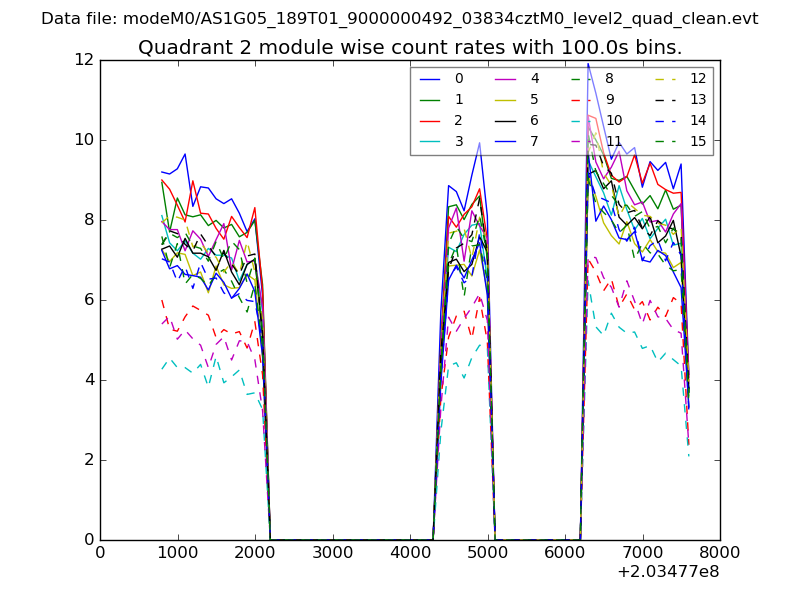
| Module-wise count rates for Quadrant B Data is divided into 100 sec bins |
 |
 |
| Module-wise count rates for Quadrant C Data is divided into 100 sec bins |
 |
 |
| Module-wise count rates for Quadrant D Data is divided into 100 sec bins |
 |
 |
| Parameter | Plot |
|---|---|
| CZT HV Monitor | 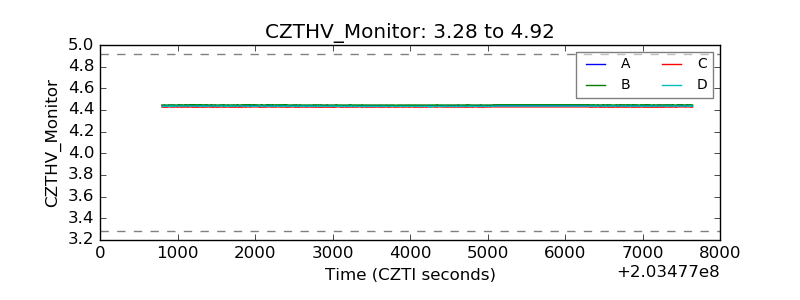 |
| D_VDD | 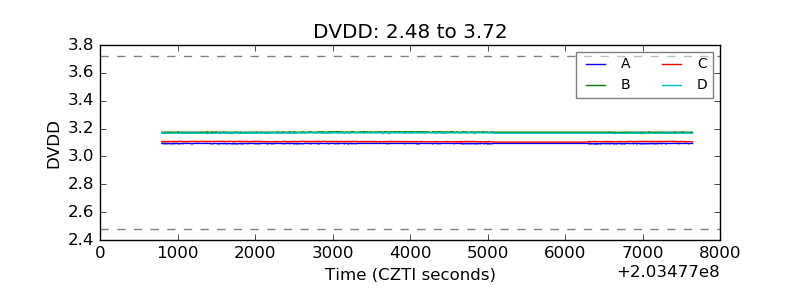 |
| Temperature 1 | 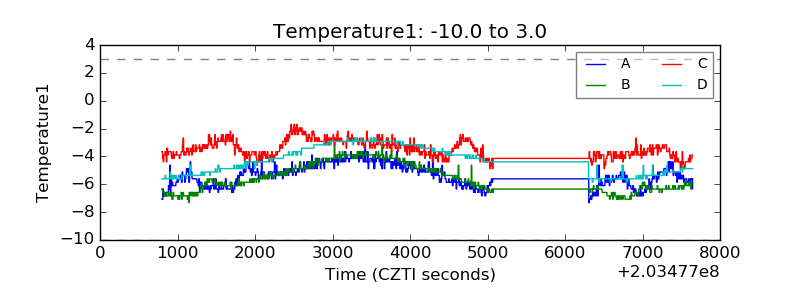 |
| Veto HV Monitor | 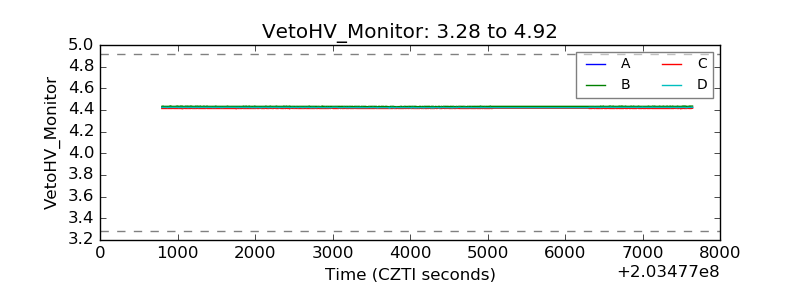 |
| Veto LLD | 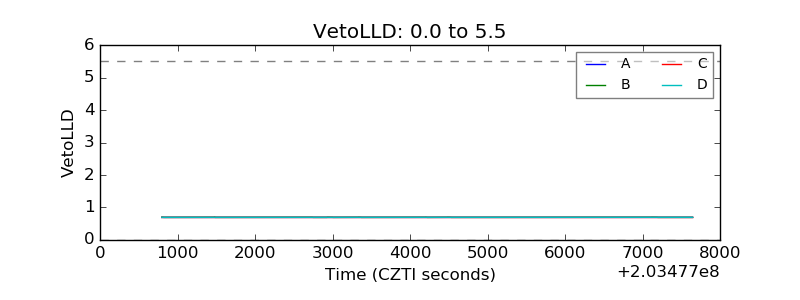 |
| Alpha Counter | 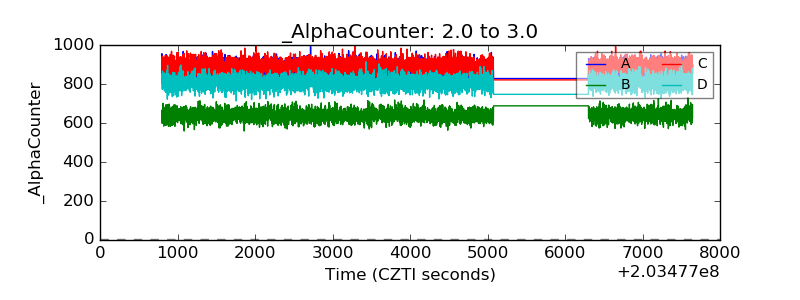 |
| _CPM_Rate | 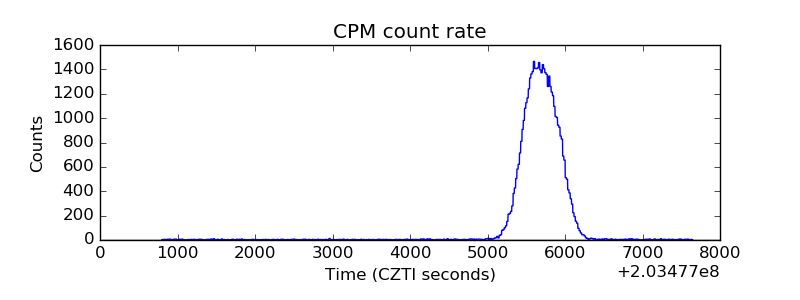 |
| CZT Counter | 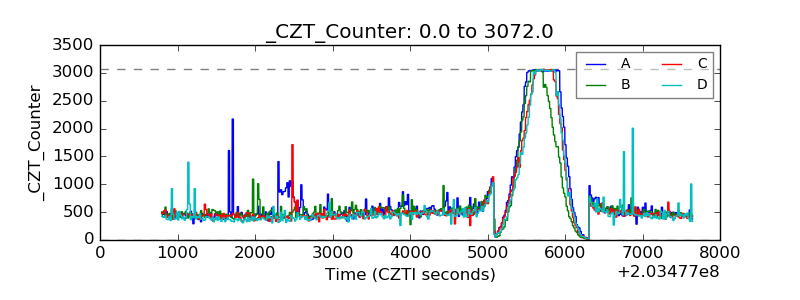 |
| +2.5 Volts monitor |  |
| +5 Volts monitor |  |
| Veto Counter | 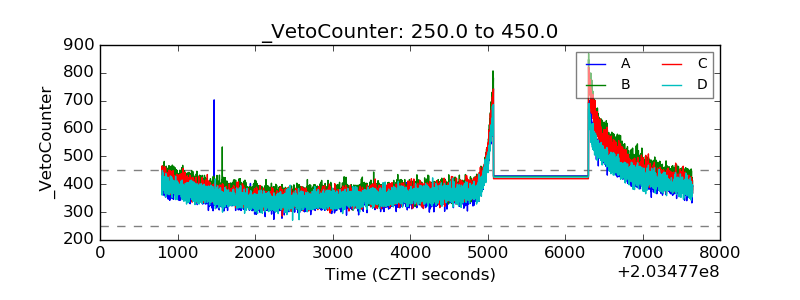 |