| Param | Original file | Final file |
|---|---|---|
| Filename | modeM0/AS1G05_189T01_9000000492_03835cztM0_level2.evt | modeM0/AS1G05_189T01_9000000492_03835cztM0_level2_quad_clean.evt |
| Size (bytes) | 9,627,840 | 2,514,240 |
| Size | 9.2 MB | 2.4 MB |
| Events in quadrant A | 41,100 | 6,137 |
| Events in quadrant B | 69,945 | 15,092 |
| Events in quadrant C | 83,917 | 15,812 |
| Events in quadrant D | 79,816 | 16,626 |
| Mode M0 | |||
|---|---|---|---|
| Quadrant | BADHDUFLAG | Total packets | Discarded packets |
| A | 0 | 9291 | 9128 |
| B | 0 | 8695 | 8421 |
| C | 0 | 8408 | 8056 |
| D | 0 | 8797 | 8460 |
| Mode M9 | |||
|---|---|---|---|
| Quadrant | BADHDUFLAG | Total packets | Discarded packets |
| A | 0 | 13 | 0 |
| B | 1 | 13 | 0 |
| C | 1 | -1 | -1 |
| D | 1 | -1 | -1 |
| Mode SS | |||
|---|---|---|---|
| Quadrant | BADHDUFLAG | Total packets | Discarded packets |
| A | 0 | 83 | 50 |
| B | 0 | 83 | 52 |
| C | 0 | 83 | 53 |
| D | 0 | 83 | 53 |
| Quadrant | Total seconds | Saturated seconds | Saturation percentage |
|---|---|---|---|
| A | 82 | 1 | 1.219512% |
| B | 137 | 0 | 0.000000% |
| C | 177 | 1 | 0.564972% |
| D | 169 | 0 | 0.000000% |
Noise dominated data is calculated using 1-second bins in cleaned event files. If a bin has >2000 counts, and if more than 50% of those come from <1% of pixels, then it is considered to be noise-dominated and hence unusable.
| Quadrant | # 1 sec bins | Bins with >0 counts | Bins with >2000 counts | High rate bins dominated by noise | Noise dominated (total time) | Noise dominated (detector-on time) | Marked lightcurve |
|---|---|---|---|---|---|---|---|
| A | 5456 | 161 | 0 | 0 | 0.00% | 0.00% | 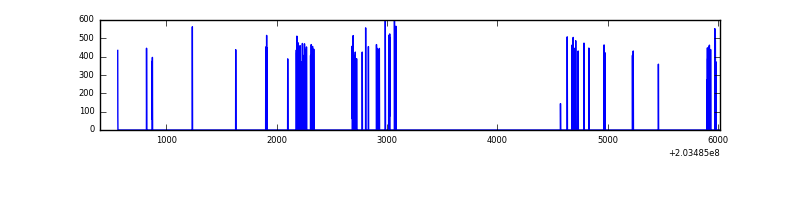 |
| B | 5593 | 271 | 0 | 0 | 0.00% | 0.00% | 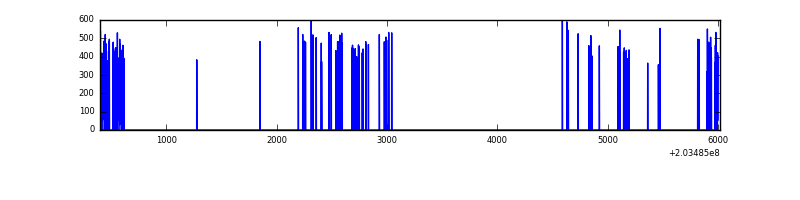 |
| C | 5610 | 352 | 0 | 0 | 0.00% | 0.00% | 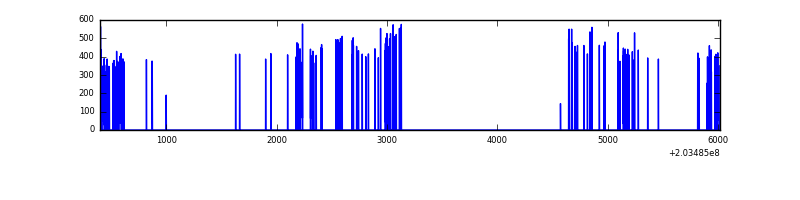 |
| D | 5617 | 335 | 0 | 0 | 0.00% | 0.00% | 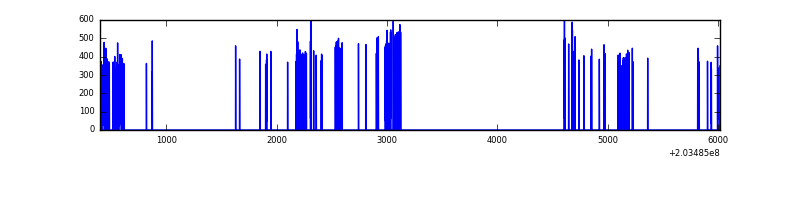 |
Top three noisy pixels from each quadrant. If the there are fewer than three noisy pixels in the level2.evt file, extra rows are filled as -1
| Pixel properties | Quadrant properties | ||||||
|---|---|---|---|---|---|---|---|
| Quadrant | DetID | PixID | Counts | Sigma | Mean | Median | Sigma |
| A | 15 | 234 | 695 | 177.54 | 10 | 10 | 3.9 |
| A | 15 | 174 | 176 | 43.02 | 10 | 10 | 3.9 |
| A | 12 | 194 | 118 | 27.99 | 10 | 10 | 3.9 |
| B | 15 | 204 | 3211 | 607.66 | 16 | 16 | 5.3 |
| B | 14 | 167 | 705 | 131.04 | 16 | 16 | 5.3 |
| B | 0 | 173 | 449 | 82.35 | 16 | 16 | 5.3 |
| C | 2 | 53 | 479 | 67.21 | 21 | 21 | 6.8 |
| C | 10 | 65 | 257 | 34.63 | 21 | 21 | 6.8 |
| C | 13 | 61 | 162 | 20.69 | 21 | 21 | 6.8 |
| D | 13 | 248 | 845 | 119.97 | 20 | 19 | 6.9 |
| D | 7 | 223 | 445 | 61.88 | 20 | 19 | 6.9 |
| D | 2 | 206 | 405 | 56.07 | 20 | 19 | 6.9 |
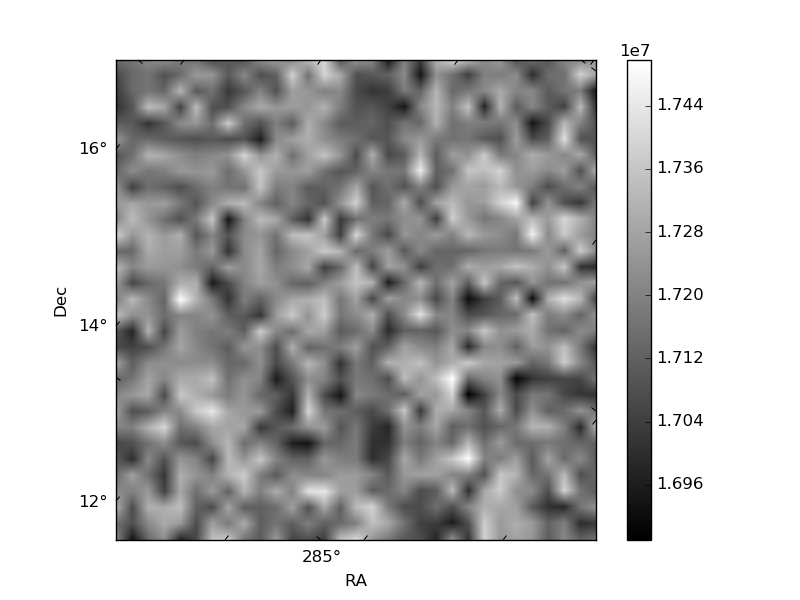
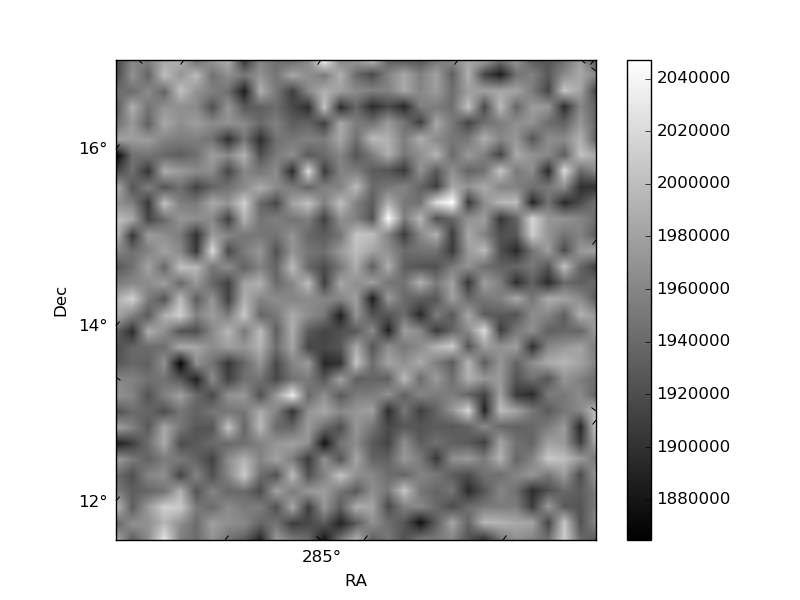
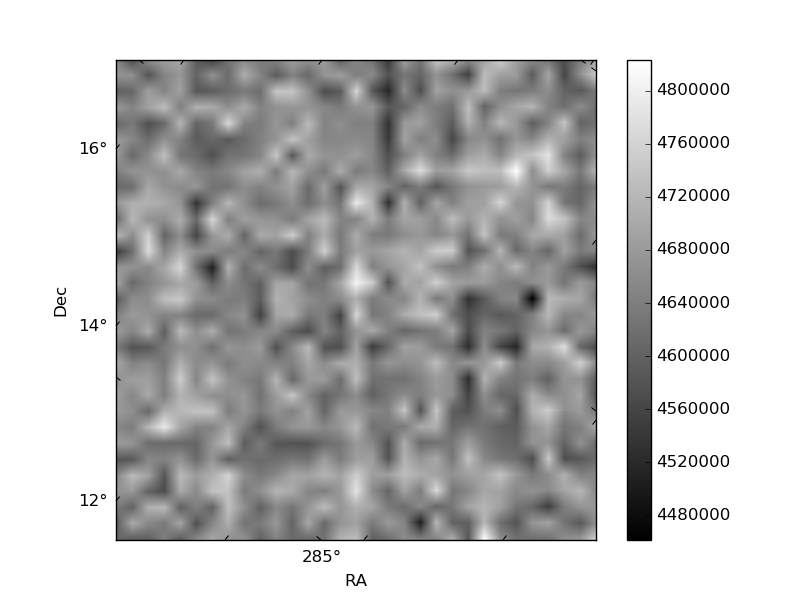
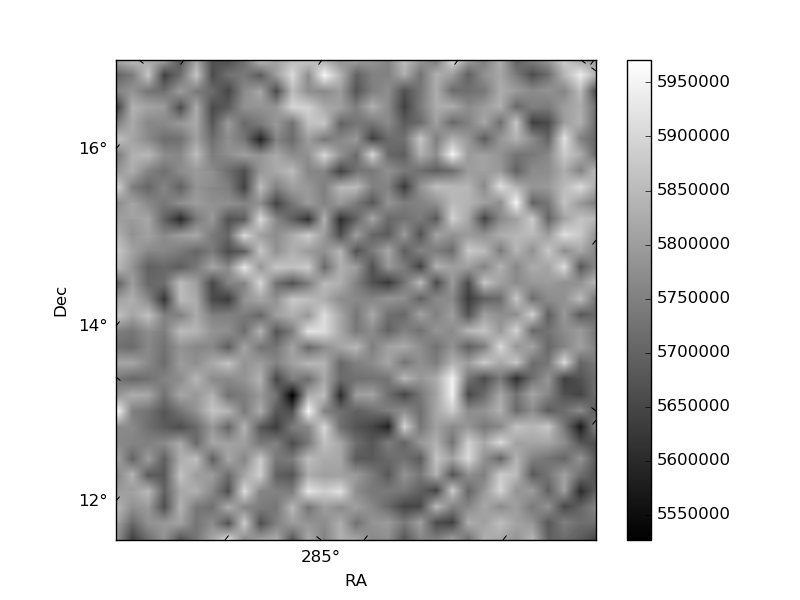
Histogram calculated using DETX and DETY for each event in the final _common_clean file
| Quadrant A | 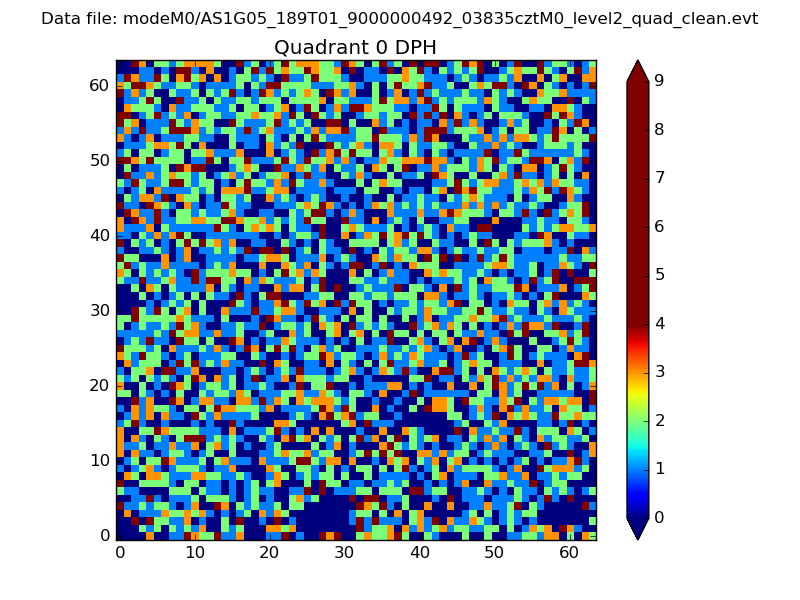 |
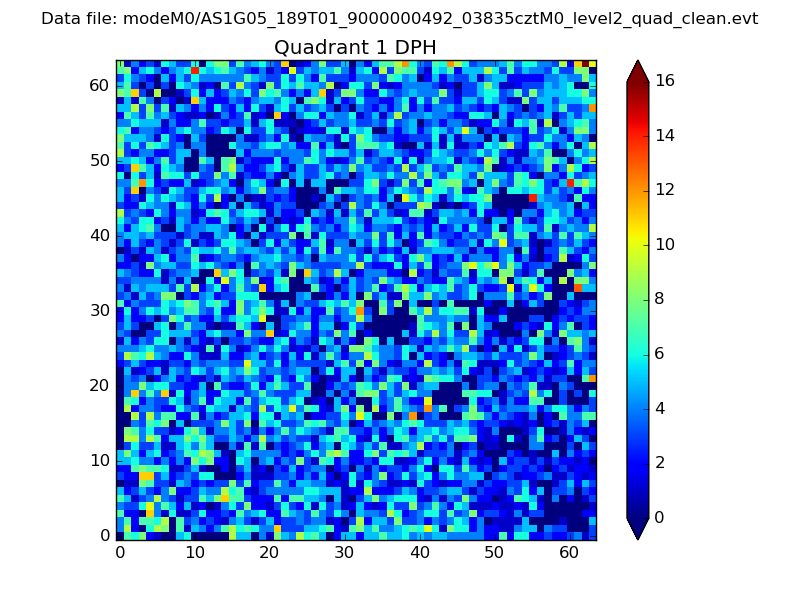 |
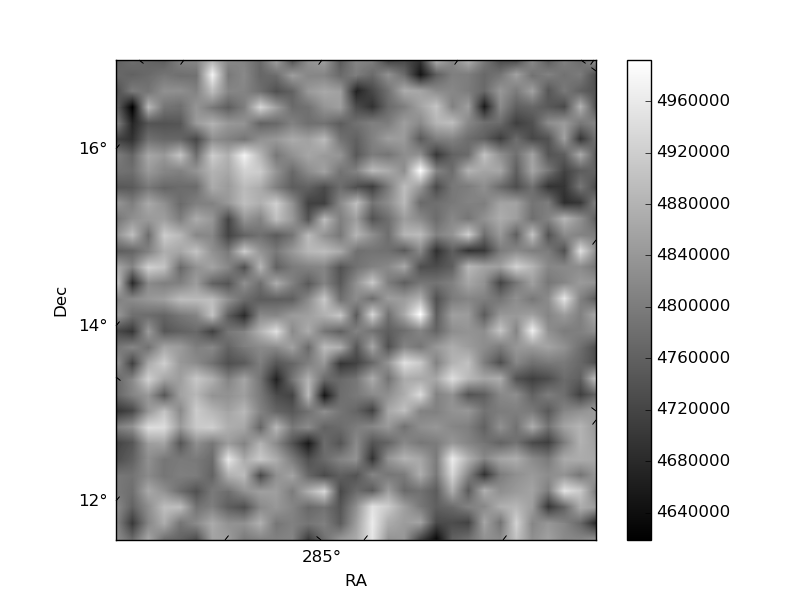
Quadrant B |
|---|---|---|---|
| Quadrant D | 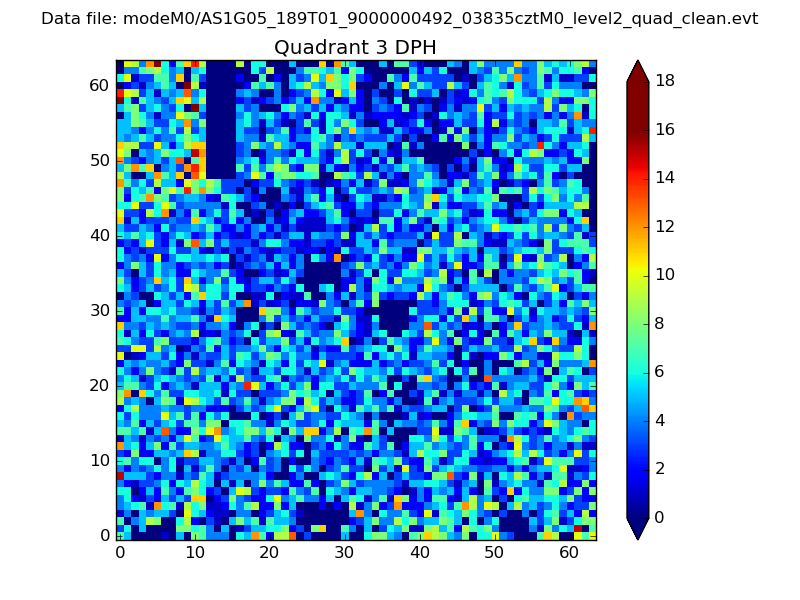 |
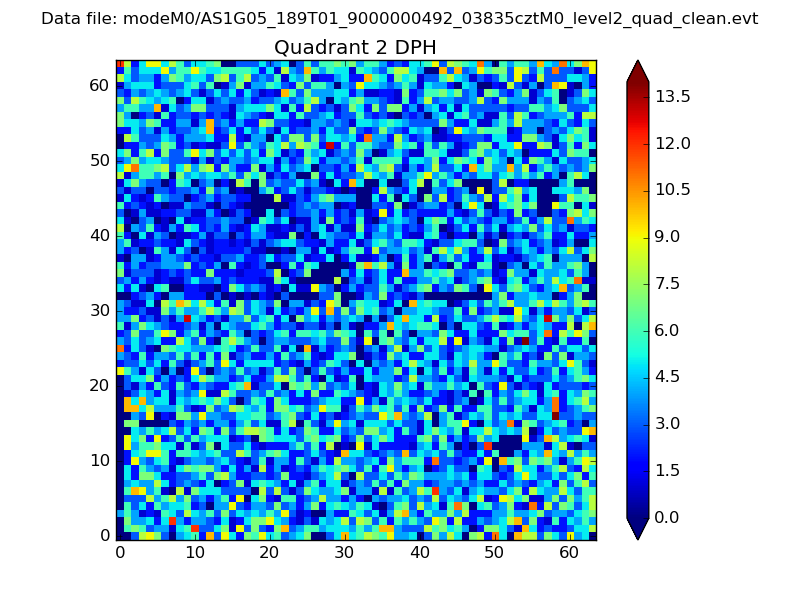 |
Quadrant C |
| Plot type | Count rate plots | Images |
|---|---|---|
| Comparison with Poisson distribution Blue bars denote a histogram of data divided into 1 sec bins. Red curve is a Poisson curve with rate = median count rate of data. |
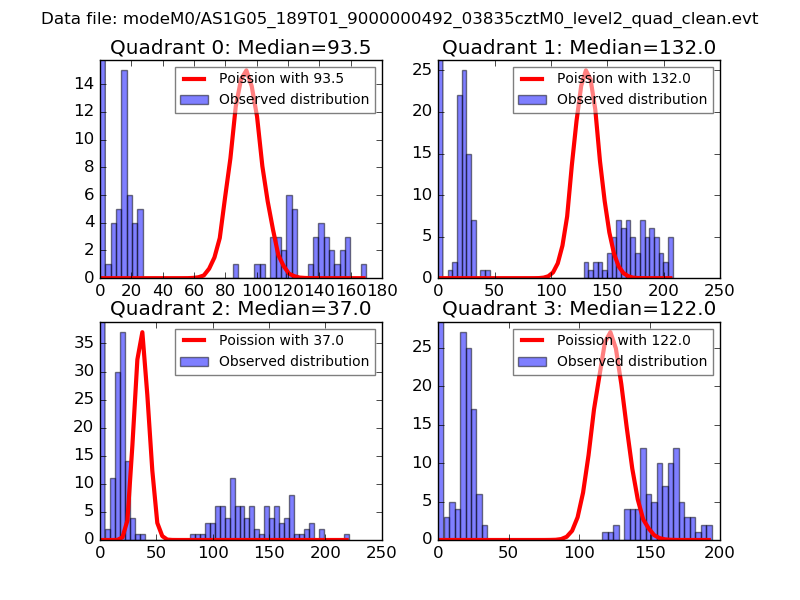 |
 |
| Quadrant-wise count rates Data is divided into 100 sec bins |
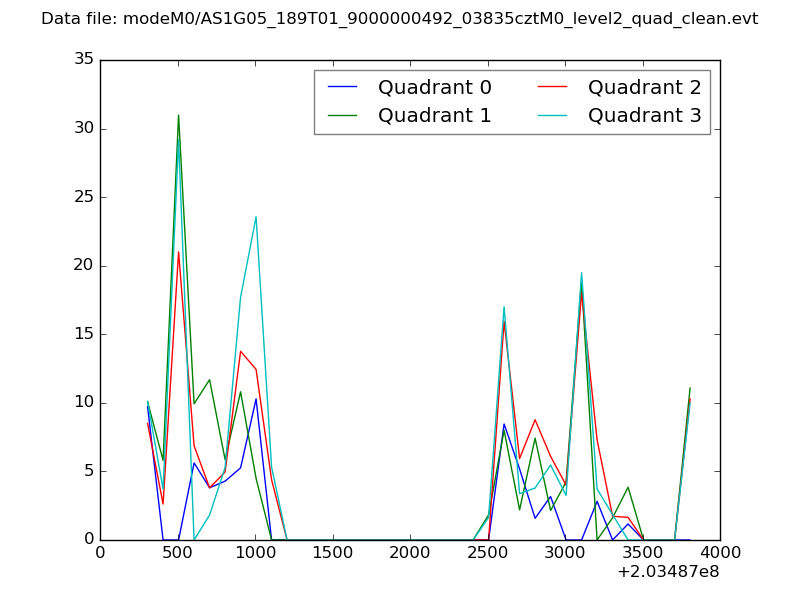 |
|
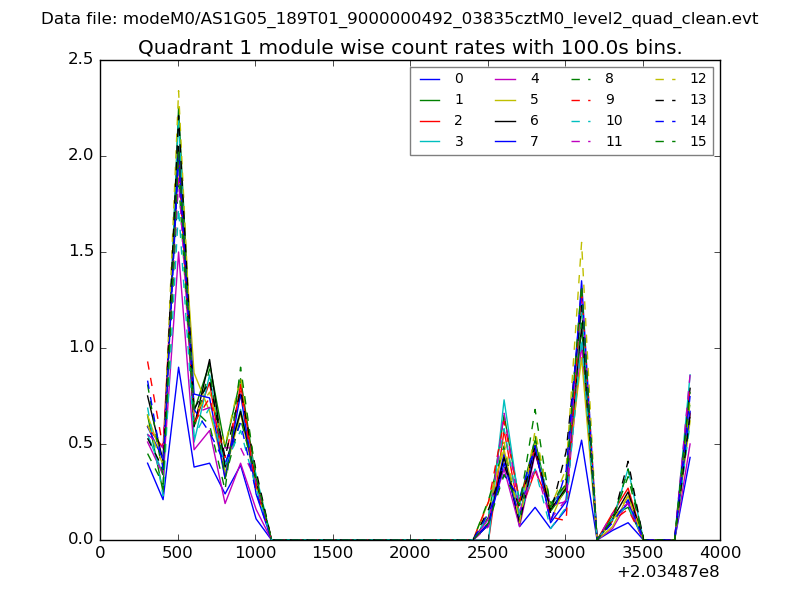
| Module-wise count rates for Quadrant A Data is divided into 100 sec bins |
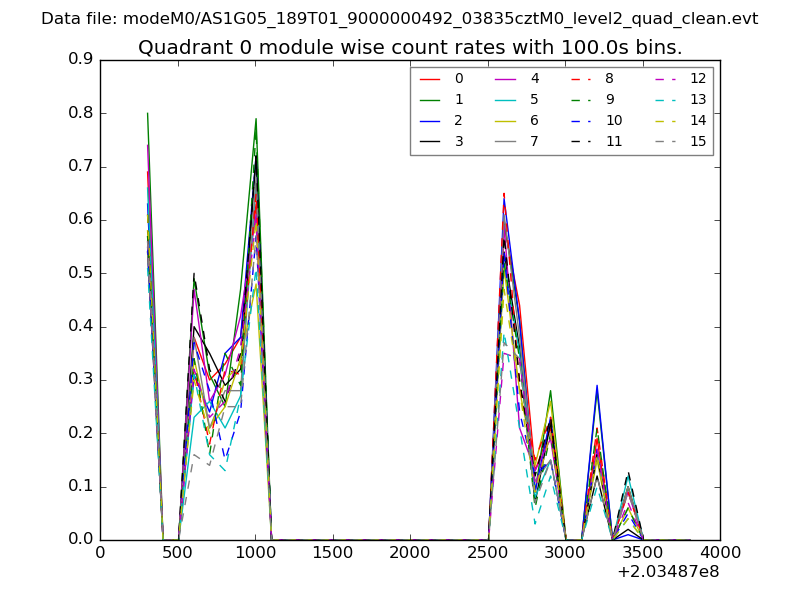 |
 |
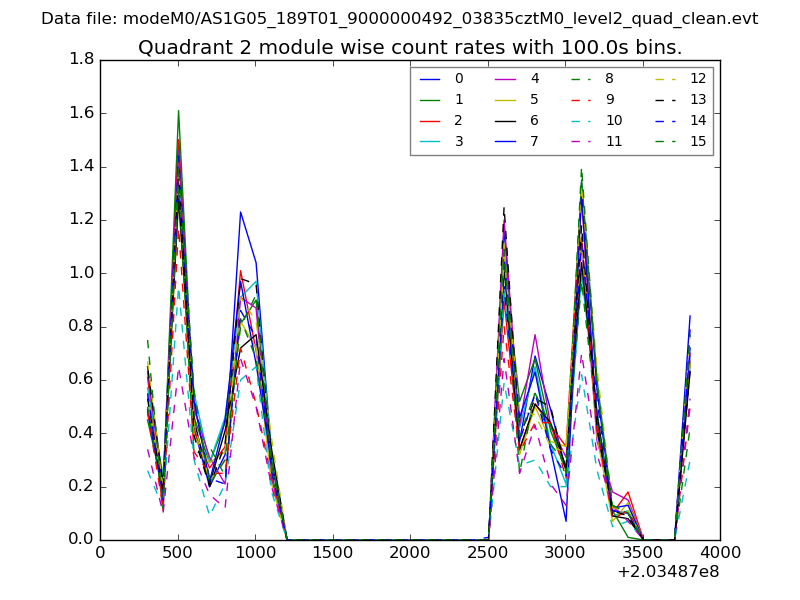
| Module-wise count rates for Quadrant B Data is divided into 100 sec bins |
 |
 |
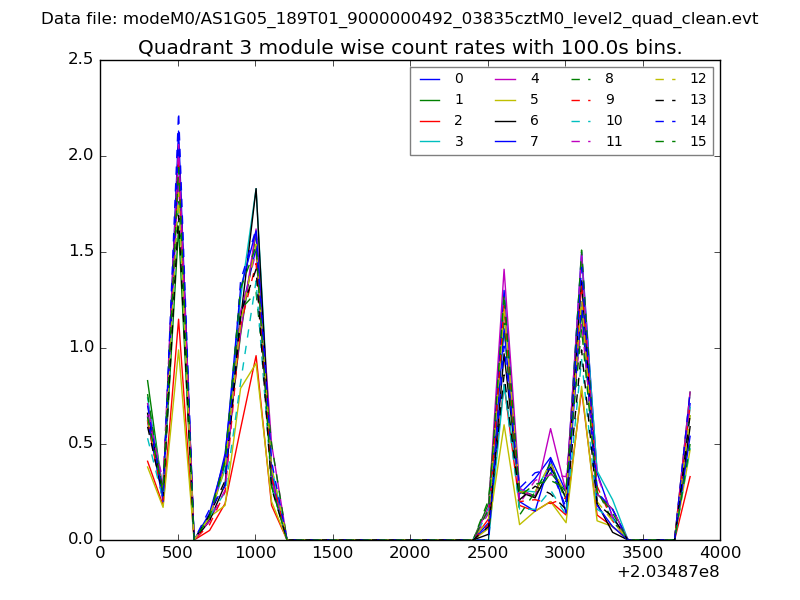
| Module-wise count rates for Quadrant C Data is divided into 100 sec bins |
 |
 |
| Module-wise count rates for Quadrant D Data is divided into 100 sec bins |
 |
 |
| Parameter | Plot |
|---|---|
| CZT HV Monitor | 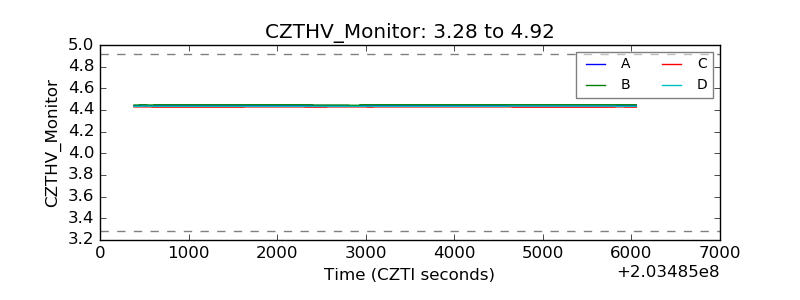 |
| D_VDD | 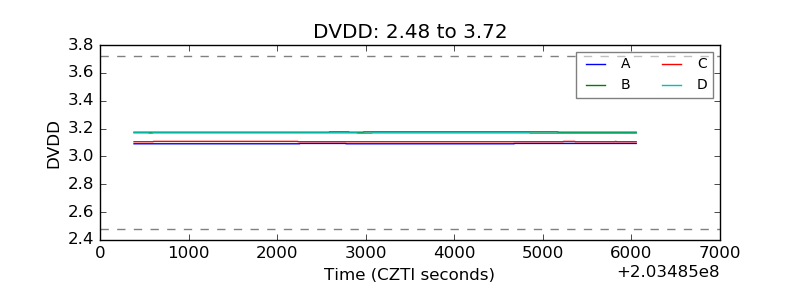 |
| Temperature 1 | 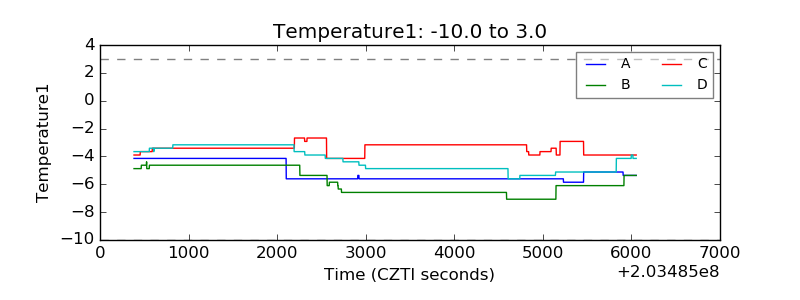 |
| Veto HV Monitor | 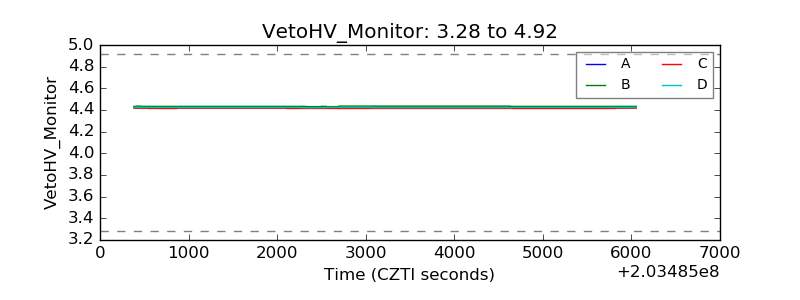 |
| Veto LLD | 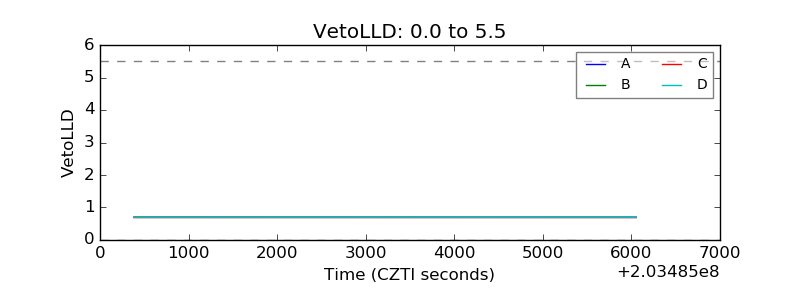 |
| Alpha Counter | 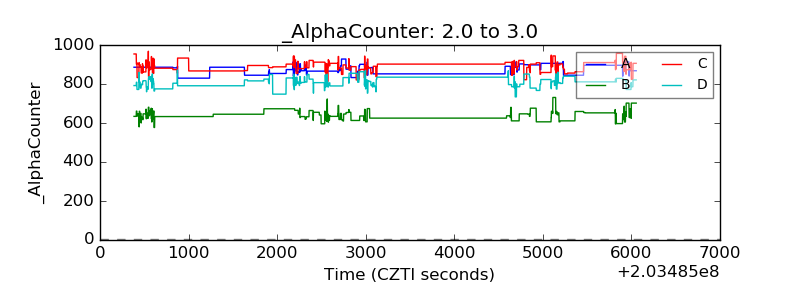 |
| _CPM_Rate | 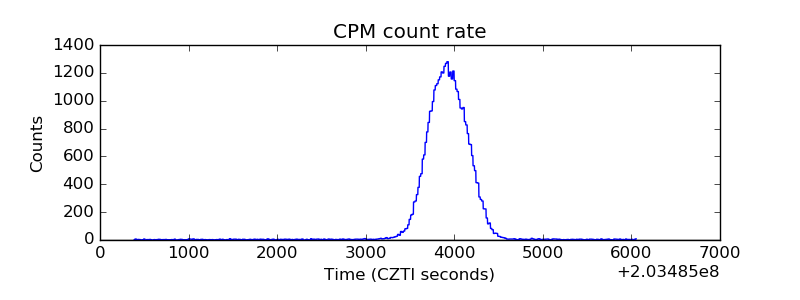 |
| CZT Counter | 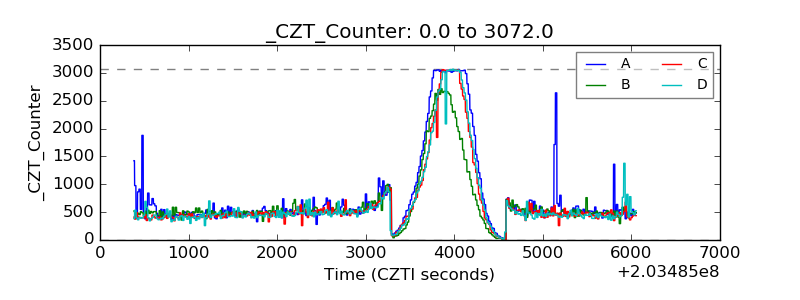 |
| +2.5 Volts monitor |  |
| +5 Volts monitor |  |
| _ROLL_ROT | 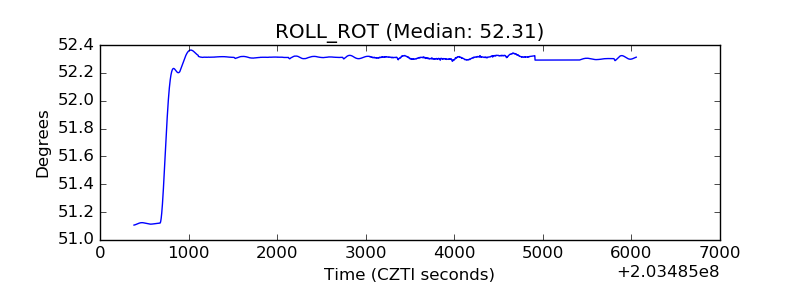 |
| _Roll_DEC | 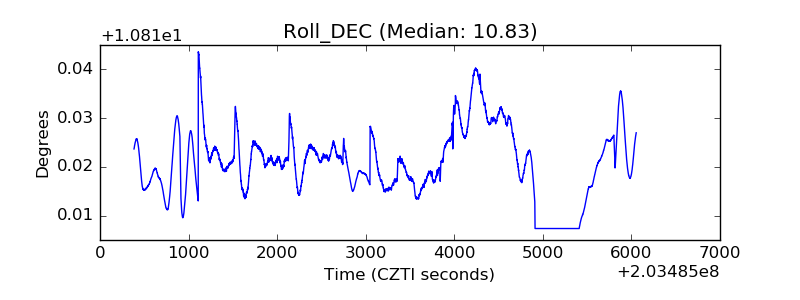 |
| _Roll_RA | 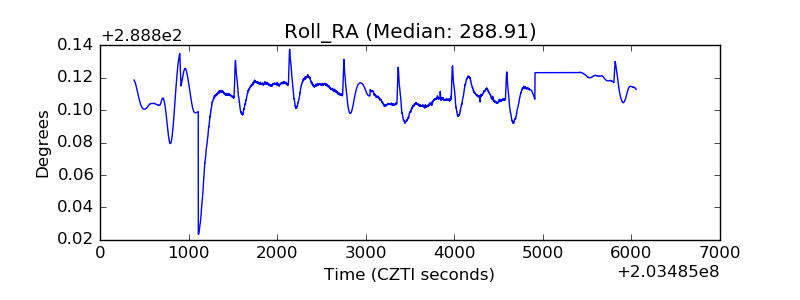 |
| Veto Counter | 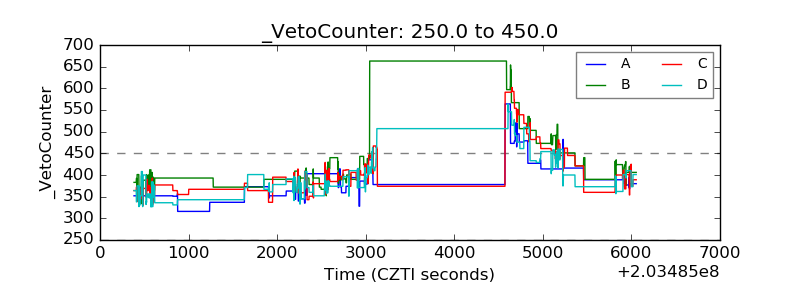 |