| Param | Original file | Final file |
|---|---|---|
| Filename | modeM0/AS1G05_189T01_9000000492_03836cztM0_level2.evt | modeM0/AS1G05_189T01_9000000492_03836cztM0_level2_quad_clean.evt |
| Size (bytes) | 374,140,800 | 56,136,960 |
| Size | 356.8 MB | 53.5 MB |
| Events in quadrant A | 2,839,558 | 333,133 |
| Events in quadrant B | 2,838,584 | 338,464 |
| Events in quadrant C | 2,614,883 | 325,883 |
| Events in quadrant D | 2,661,449 | 314,973 |
| Mode M0 | |||
|---|---|---|---|
| Quadrant | BADHDUFLAG | Total packets | Discarded packets |
| A | 0 | 11884 | 0 |
| B | 0 | 11788 | 0 |
| C | 0 | 11407 | 0 |
| D | 0 | 11741 | 0 |
| Mode M9 | |||
|---|---|---|---|
| Quadrant | BADHDUFLAG | Total packets | Discarded packets |
| A | 0 | 12 | 0 |
| B | 0 | 12 | 0 |
| C | 0 | 12 | 0 |
| D | 0 | 12 | 0 |
| Mode SS | |||
|---|---|---|---|
| Quadrant | BADHDUFLAG | Total packets | Discarded packets |
| A | 0 | 114 | 0 |
| B | 0 | 114 | 0 |
| C | 0 | 114 | 0 |
| D | 0 | 114 | 0 |
| Quadrant | Total seconds | Saturated seconds | Saturation percentage |
|---|---|---|---|
| A | 5524 | 66 | 1.194786% |
| B | 5524 | 75 | 1.357712% |
| C | 5524 | 32 | 0.579290% |
| D | 5524 | 45 | 0.814627% |
Noise dominated data is calculated using 1-second bins in cleaned event files. If a bin has >2000 counts, and if more than 50% of those come from <1% of pixels, then it is considered to be noise-dominated and hence unusable.
| Quadrant | # 1 sec bins | Bins with >0 counts | Bins with >2000 counts | High rate bins dominated by noise | Noise dominated (total time) | Noise dominated (detector-on time) | Marked lightcurve |
|---|---|---|---|---|---|---|---|
| A | 6794 | 5524 | 4 | 4 | 0.06% | 0.07% | 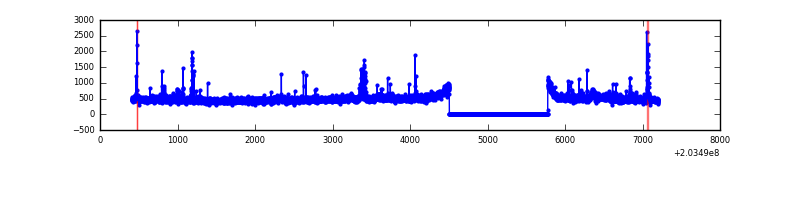 |
| B | 6794 | 5524 | 0 | 0 | 0.00% | 0.00% | 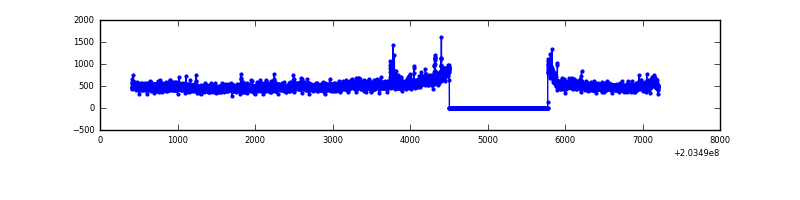 |
| C | 6794 | 5525 | 0 | 0 | 0.00% | 0.00% | 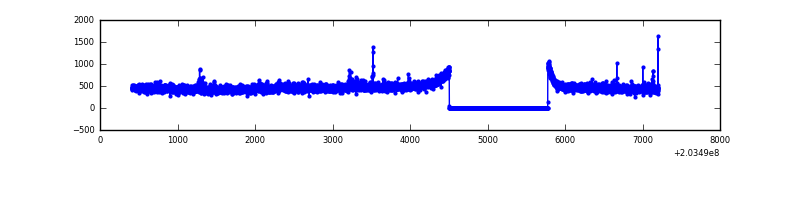 |
| D | 6794 | 5525 | 19 | 19 | 0.28% | 0.34% | 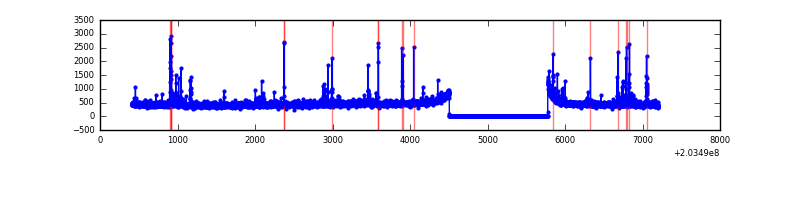 |
Top three noisy pixels from each quadrant. If the there are fewer than three noisy pixels in the level2.evt file, extra rows are filled as -1
| Pixel properties | Quadrant properties | ||||||
|---|---|---|---|---|---|---|---|
| Quadrant | DetID | PixID | Counts | Sigma | Mean | Median | Sigma |
| A | 15 | 234 | 148941 | 1070.58 | 683 | 671 | 138.5 |
| A | 13 | 251 | 44402 | 315.76 | 683 | 671 | 138.5 |
| A | 0 | 226 | 7459 | 49.01 | 683 | 671 | 138.5 |
| B | 15 | 204 | 108347 | 814.77 | 687 | 672 | 132.2 |
| B | 14 | 167 | 29622 | 219.06 | 687 | 672 | 132.2 |
| B | 10 | 246 | 25003 | 184.11 | 687 | 672 | 132.2 |
| C | 2 | 53 | 41756 | 270.58 | 650 | 655 | 151.9 |
| C | 9 | 247 | 13311 | 83.32 | 650 | 655 | 151.9 |
| C | 10 | 21 | 7373 | 44.23 | 650 | 655 | 151.9 |
| D | 13 | 248 | 81862 | 511.43 | 653 | 634 | 158.8 |
| D | 2 | 14 | 25250 | 154.99 | 653 | 634 | 158.8 |
| D | 2 | 63 | 23148 | 141.75 | 653 | 634 | 158.8 |
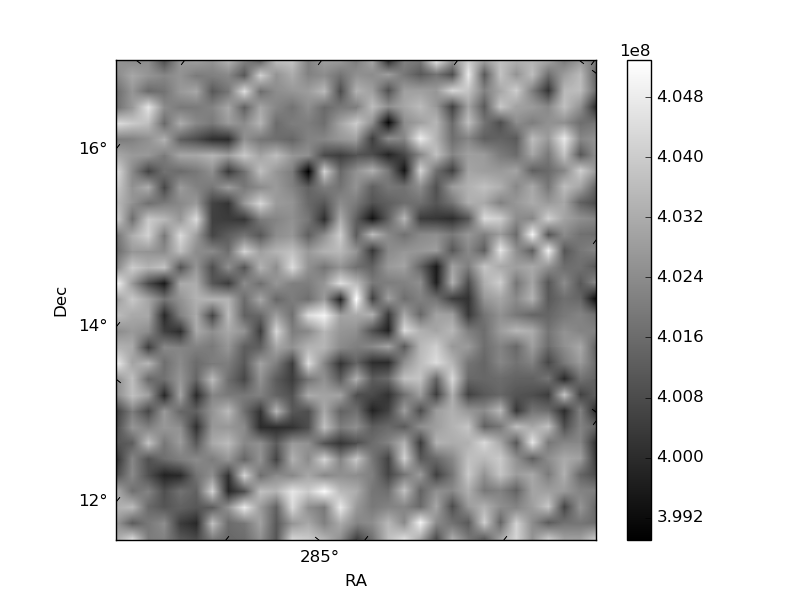
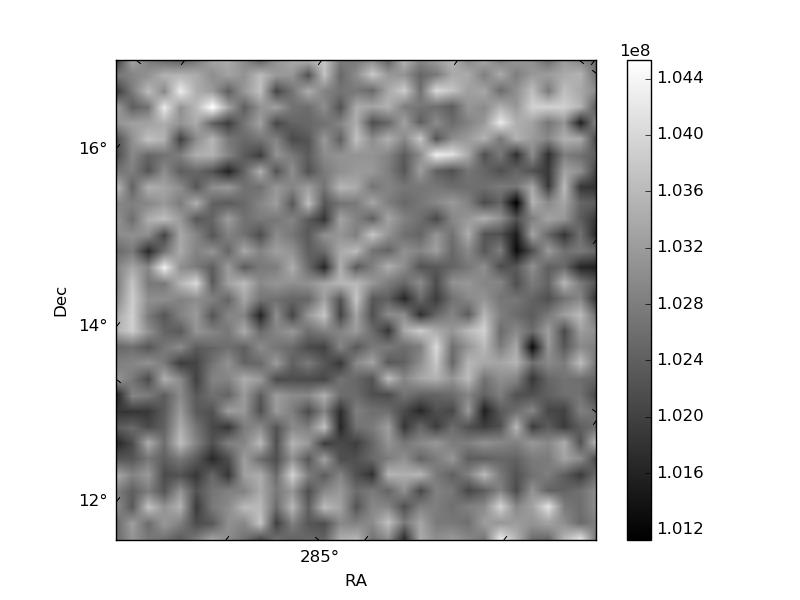
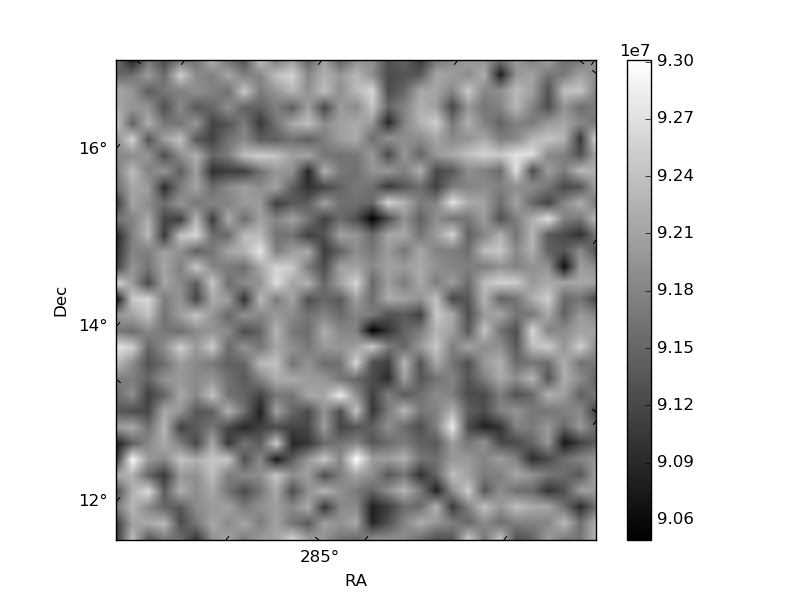
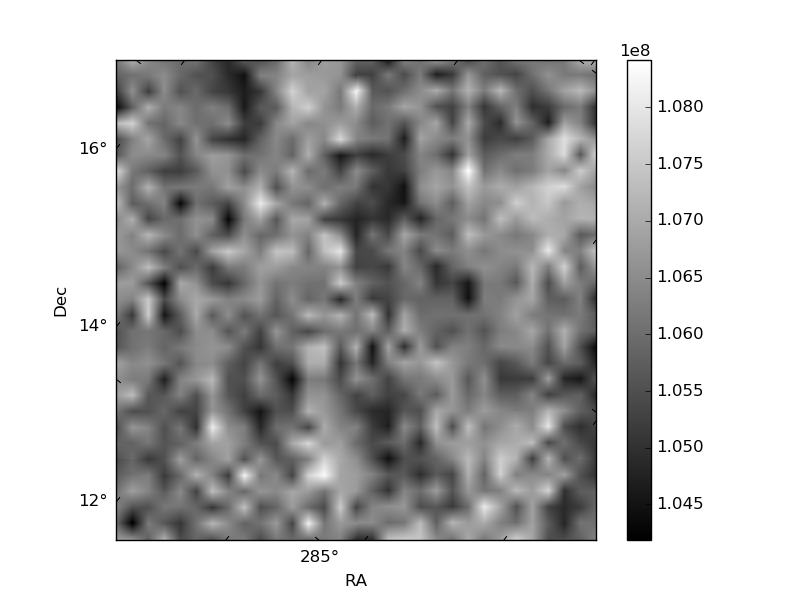
Histogram calculated using DETX and DETY for each event in the final _common_clean file
| Quadrant A | 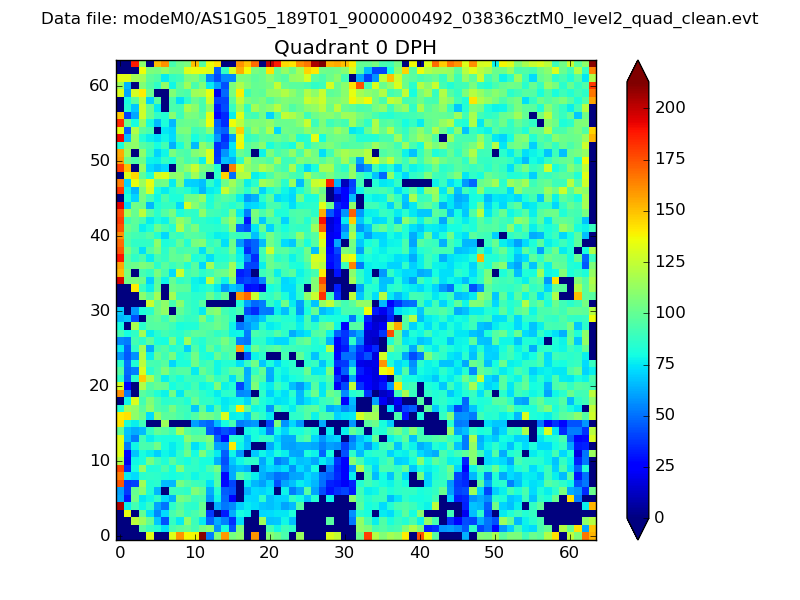 |
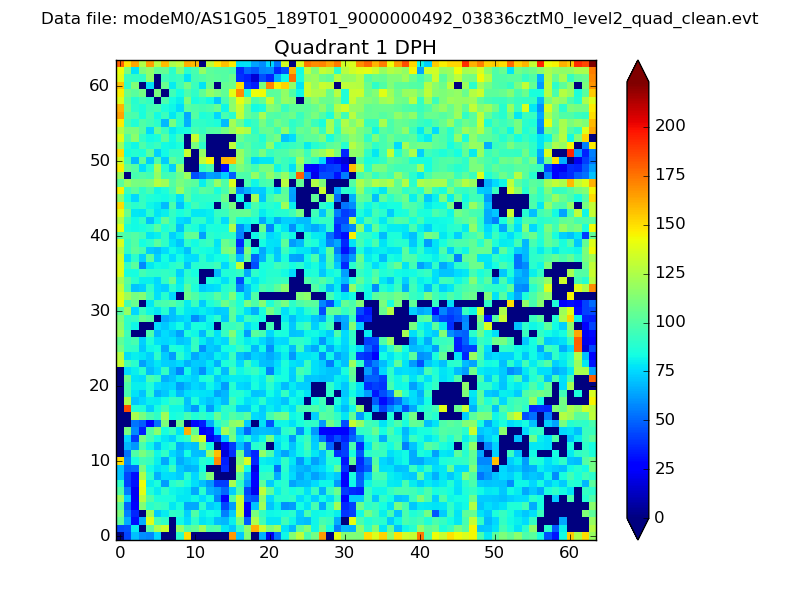 |
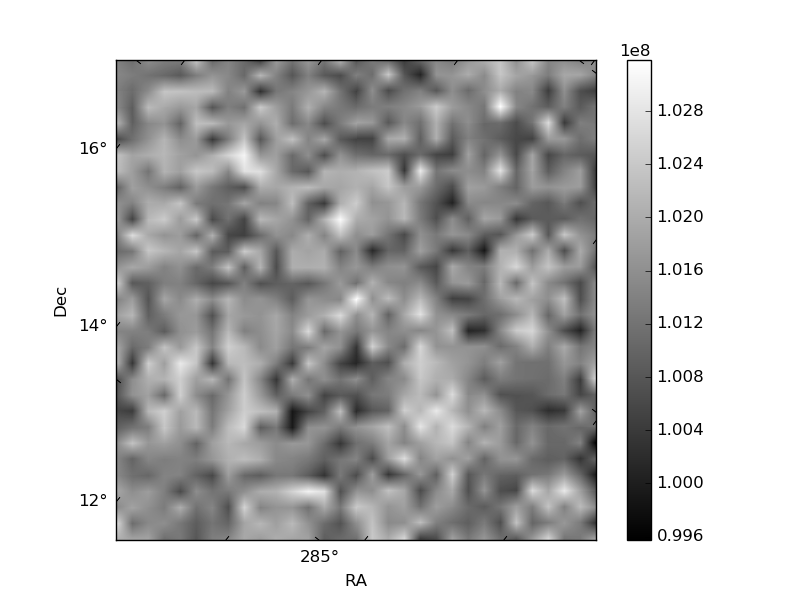
Quadrant B |
|---|---|---|---|
| Quadrant D | 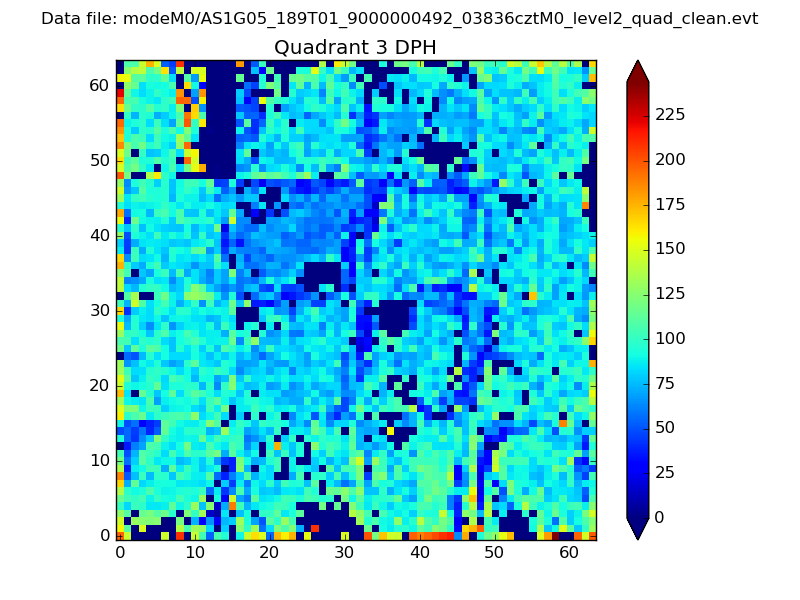 |
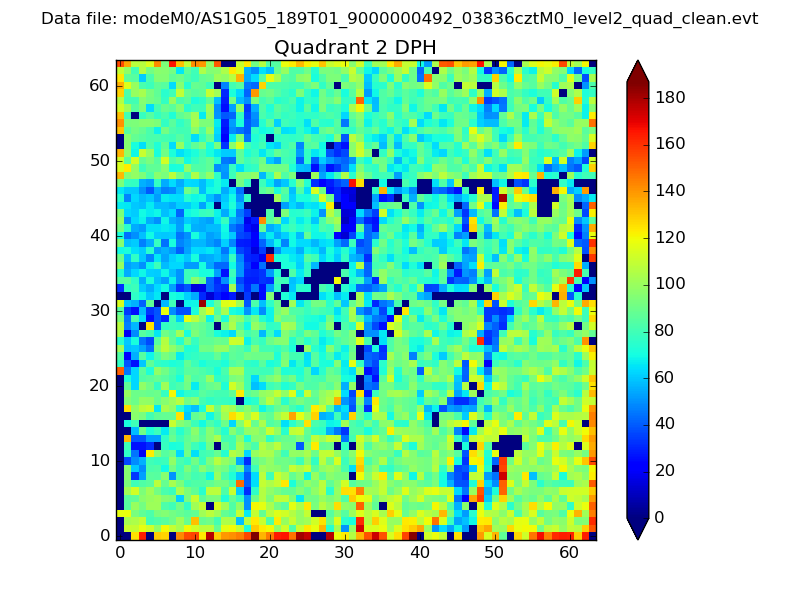 |
Quadrant C |
| Plot type | Count rate plots | Images |
|---|---|---|
| Comparison with Poisson distribution Blue bars denote a histogram of data divided into 1 sec bins. Red curve is a Poisson curve with rate = median count rate of data. |
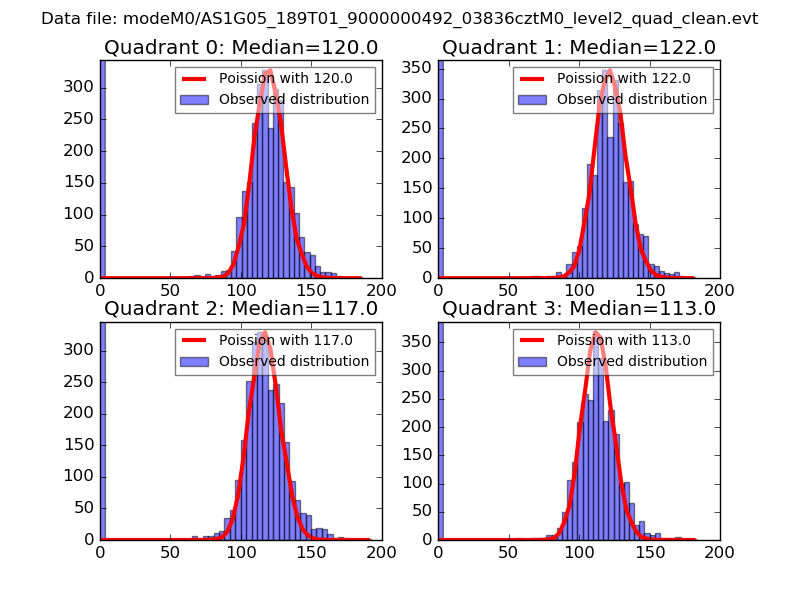 |
 |
| Quadrant-wise count rates Data is divided into 100 sec bins |
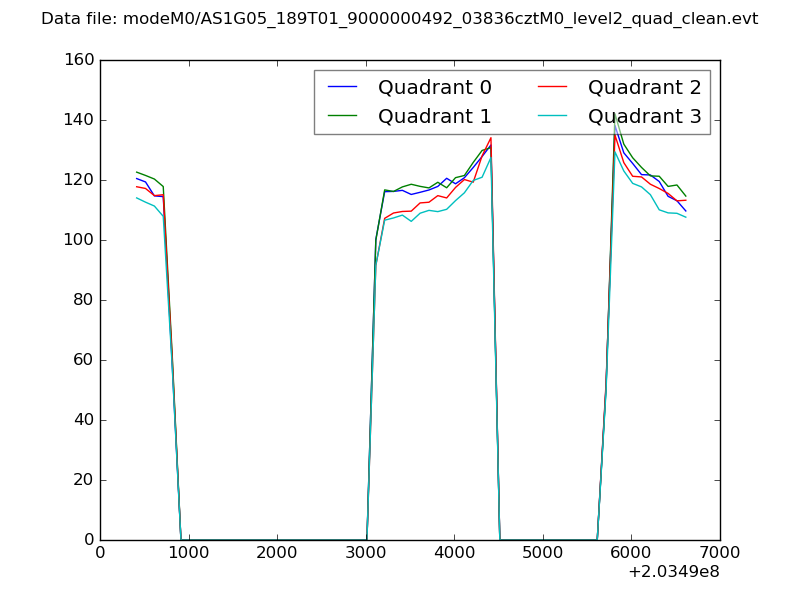 |
|
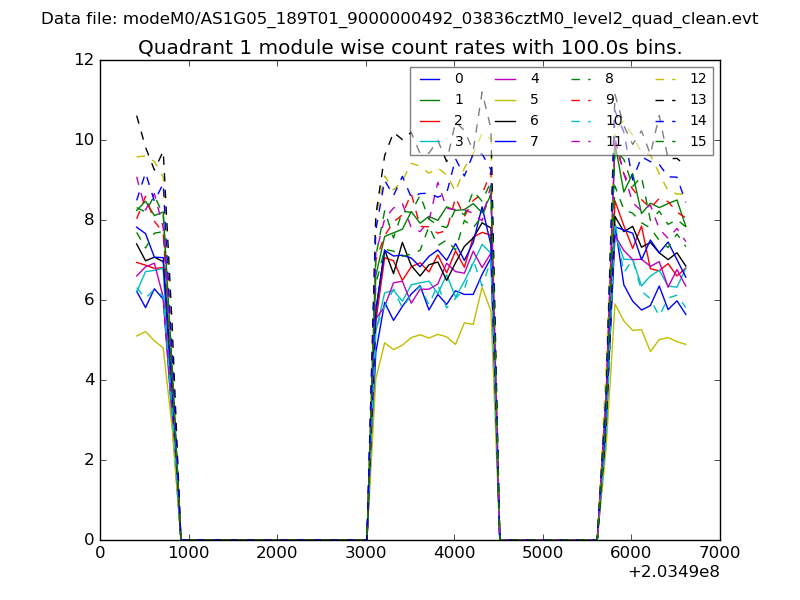
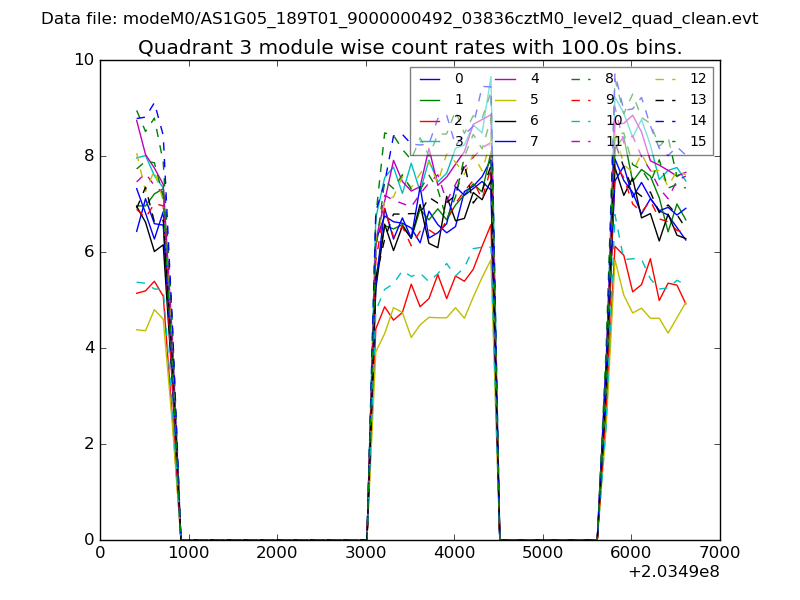
| Module-wise count rates for Quadrant A Data is divided into 100 sec bins |
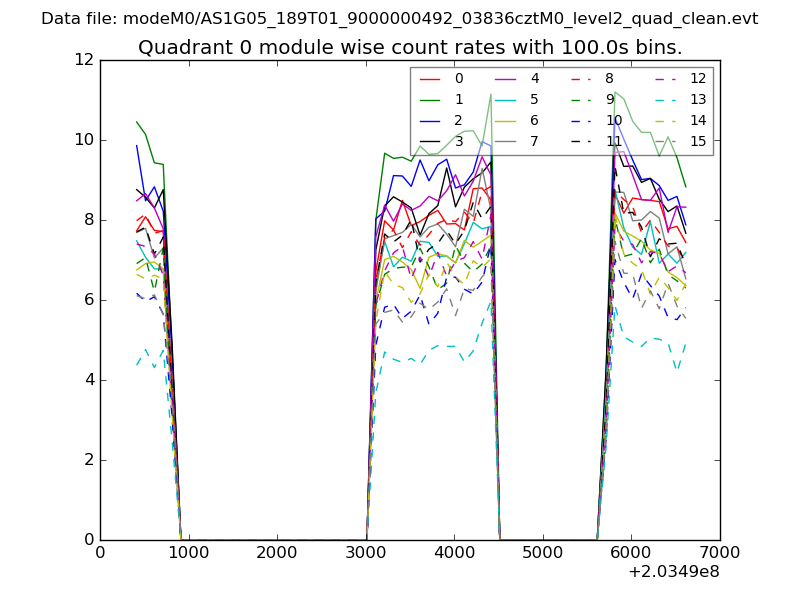 |
 |
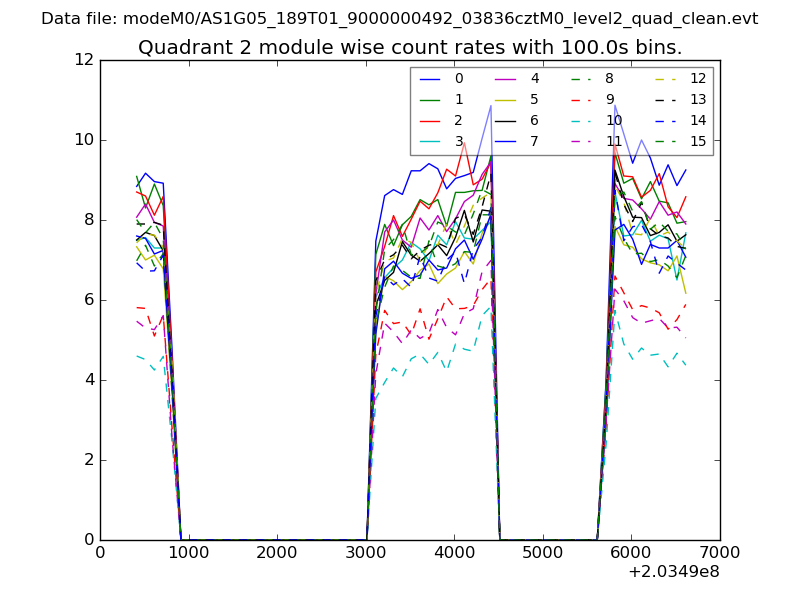
| Module-wise count rates for Quadrant B Data is divided into 100 sec bins |
 |
 |
| Module-wise count rates for Quadrant C Data is divided into 100 sec bins |
 |
 |
| Module-wise count rates for Quadrant D Data is divided into 100 sec bins |
 |
 |
| Parameter | Plot |
|---|---|
| CZT HV Monitor | 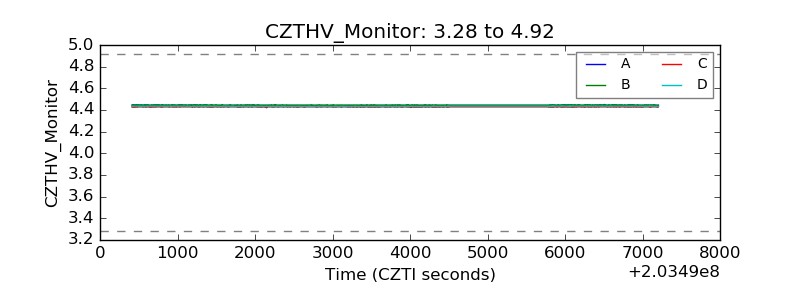 |
| D_VDD | 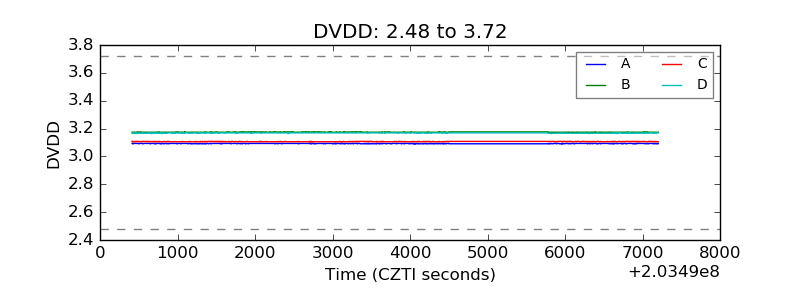 |
| Temperature 1 | 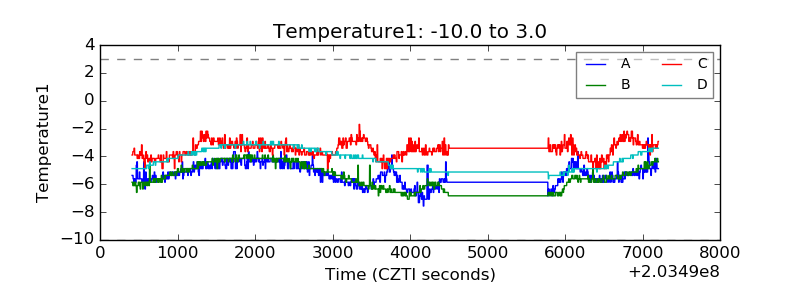 |
| Veto HV Monitor | 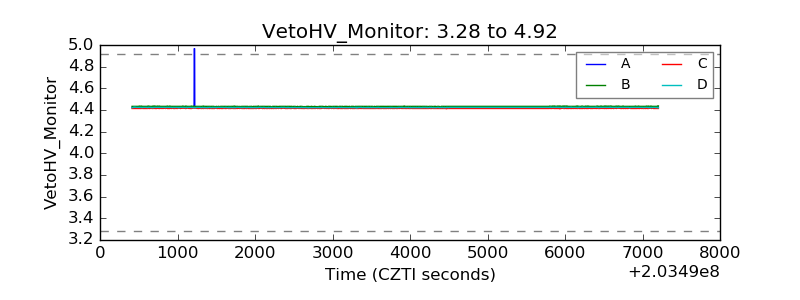 |
| Veto LLD | 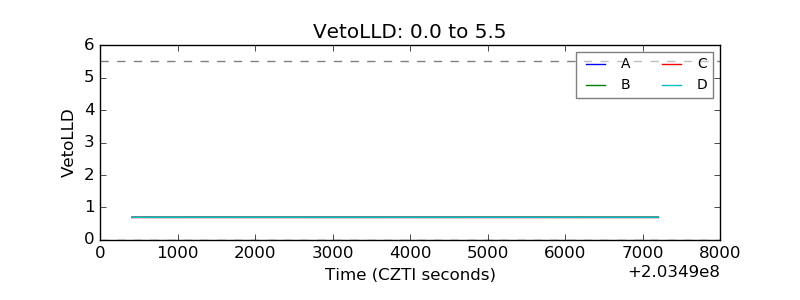 |
| Alpha Counter | 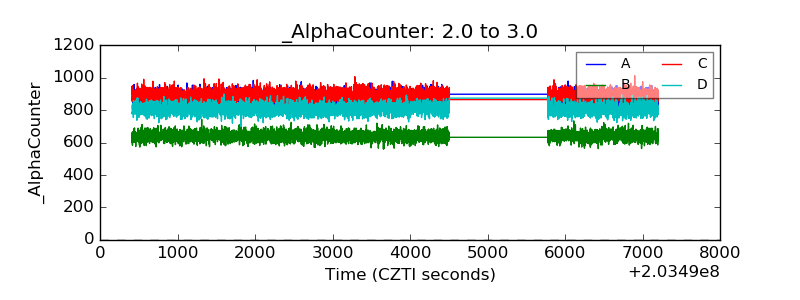 |
| _CPM_Rate | 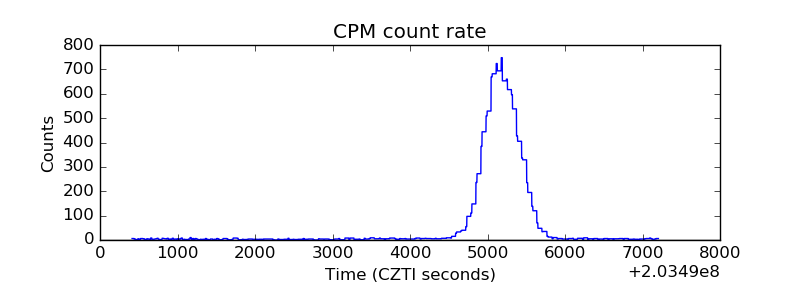 |
| CZT Counter | 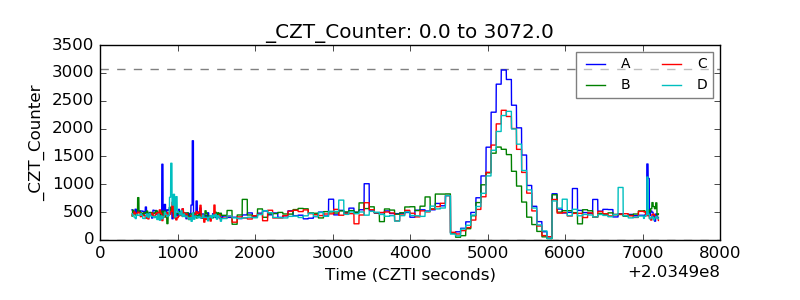 |
| +2.5 Volts monitor |  |
| +5 Volts monitor |  |
| Veto Counter | 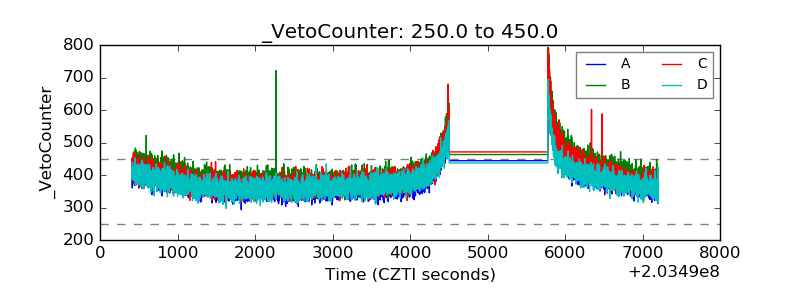 |