| Param | Original file | Final file |
|---|---|---|
| Filename | modeM0/AS1G05_189T01_9000000492_03837cztM0_level2.evt | modeM0/AS1G05_189T01_9000000492_03837cztM0_level2_quad_clean.evt |
| Size (bytes) | 463,731,840 | 68,676,480 |
| Size | 442.2 MB | 65.5 MB |
| Events in quadrant A | 3,646,321 | 418,751 |
| Events in quadrant B | 3,347,075 | 424,460 |
| Events in quadrant C | 3,471,762 | 407,533 |
| Events in quadrant D | 3,158,407 | 396,495 |
| Mode M0 | |||
|---|---|---|---|
| Quadrant | BADHDUFLAG | Total packets | Discarded packets |
| A | 0 | 14709 | 2 |
| B | 0 | 13746 | 1 |
| C | 0 | 14557 | 1 |
| D | 0 | 13769 | 1 |
| Mode M9 | |||
|---|---|---|---|
| Quadrant | BADHDUFLAG | Total packets | Discarded packets |
| A | 0 | 11 | 0 |
| B | 0 | 11 | 0 |
| C | 0 | 11 | 0 |
| D | 0 | 11 | 0 |
| Mode SS | |||
|---|---|---|---|
| Quadrant | BADHDUFLAG | Total packets | Discarded packets |
| A | 0 | 126 | 0 |
| B | 0 | 126 | 0 |
| C | 0 | 126 | 0 |
| D | 0 | 126 | 0 |
| Quadrant | Total seconds | Saturated seconds | Saturation percentage |
|---|---|---|---|
| A | 6190 | 156 | 2.520194% |
| B | 6190 | 128 | 2.067851% |
| C | 6190 | 295 | 4.765751% |
| D | 6190 | 151 | 2.439418% |
Noise dominated data is calculated using 1-second bins in cleaned event files. If a bin has >2000 counts, and if more than 50% of those come from <1% of pixels, then it is considered to be noise-dominated and hence unusable.
| Quadrant | # 1 sec bins | Bins with >0 counts | Bins with >2000 counts | High rate bins dominated by noise | Noise dominated (total time) | Noise dominated (detector-on time) | Marked lightcurve |
|---|---|---|---|---|---|---|---|
| A | 7285 | 6190 | 29 | 29 | 0.40% | 0.47% | 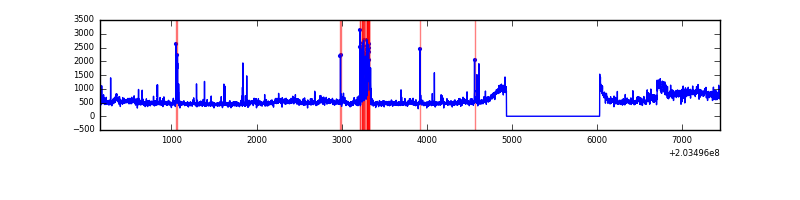 |
| B | 7285 | 6190 | 1 | 1 | 0.01% | 0.02% | 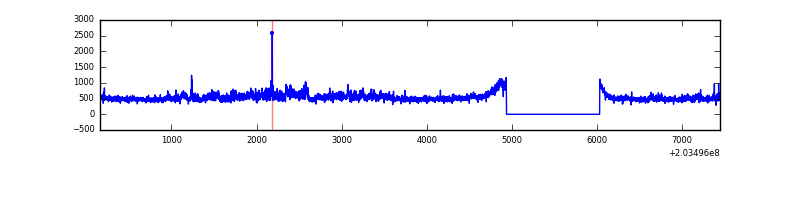 |
| C | 7285 | 6190 | 211 | 211 | 2.90% | 3.41% | 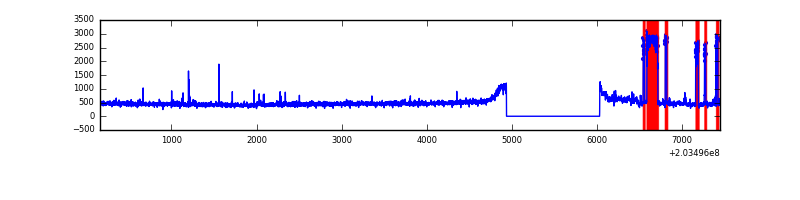 |
| D | 7285 | 6190 | 23 | 23 | 0.32% | 0.37% | 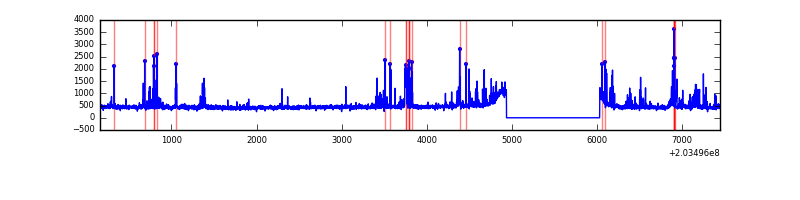 |
Top three noisy pixels from each quadrant. If the there are fewer than three noisy pixels in the level2.evt file, extra rows are filled as -1
| Pixel properties | Quadrant properties | ||||||
|---|---|---|---|---|---|---|---|
| Quadrant | DetID | PixID | Counts | Sigma | Mean | Median | Sigma |
| A | 15 | 234 | 645809 | 4166.44 | 757 | 743 | 154.8 |
| A | 13 | 251 | 73121 | 467.49 | 757 | 743 | 154.8 |
| A | 0 | 50 | 9916 | 59.25 | 757 | 743 | 154.8 |
| B | 15 | 204 | 349688 | 2349.01 | 762 | 745 | 148.5 |
| B | 14 | 167 | 21377 | 138.89 | 762 | 745 | 148.5 |
| B | 12 | 111 | 12913 | 81.91 | 762 | 745 | 148.5 |
| C | 1 | 241 | 648931 | 3888.65 | 709 | 713 | 166.7 |
| C | 10 | 65 | 20144 | 116.57 | 709 | 713 | 166.7 |
| C | 1 | 16 | 15523 | 88.85 | 709 | 713 | 166.7 |
| D | 13 | 248 | 171624 | 969.36 | 725 | 704 | 176.3 |
| D | 2 | 14 | 91879 | 517.09 | 725 | 704 | 176.3 |
| D | 11 | 132 | 32627 | 181.05 | 725 | 704 | 176.3 |
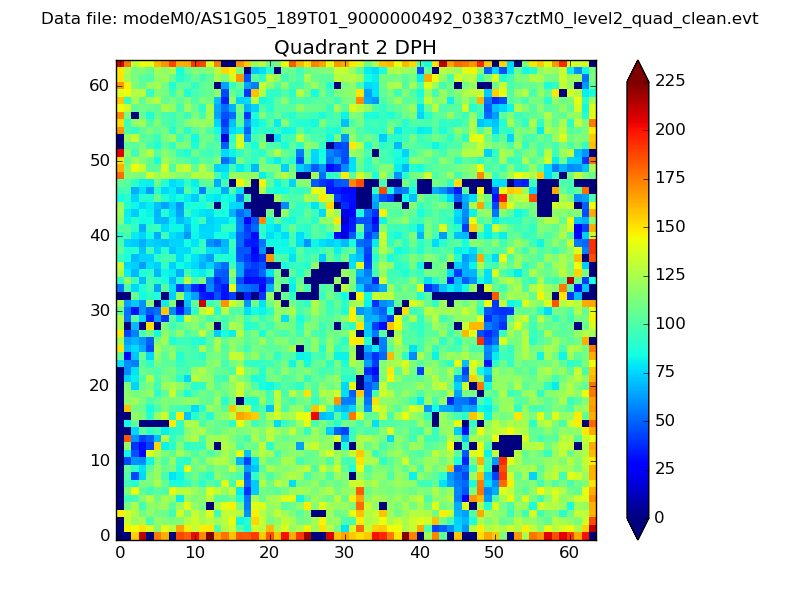
Histogram calculated using DETX and DETY for each event in the final _common_clean file
| Quadrant A | 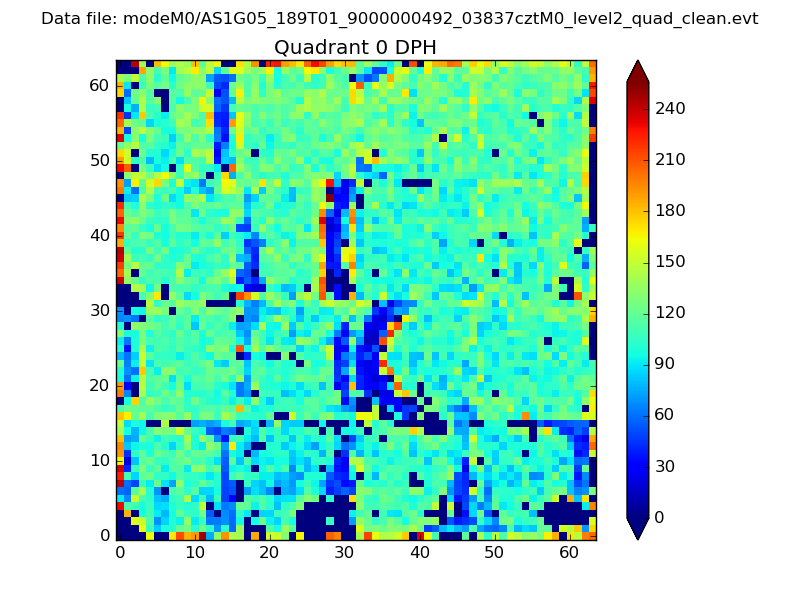 |
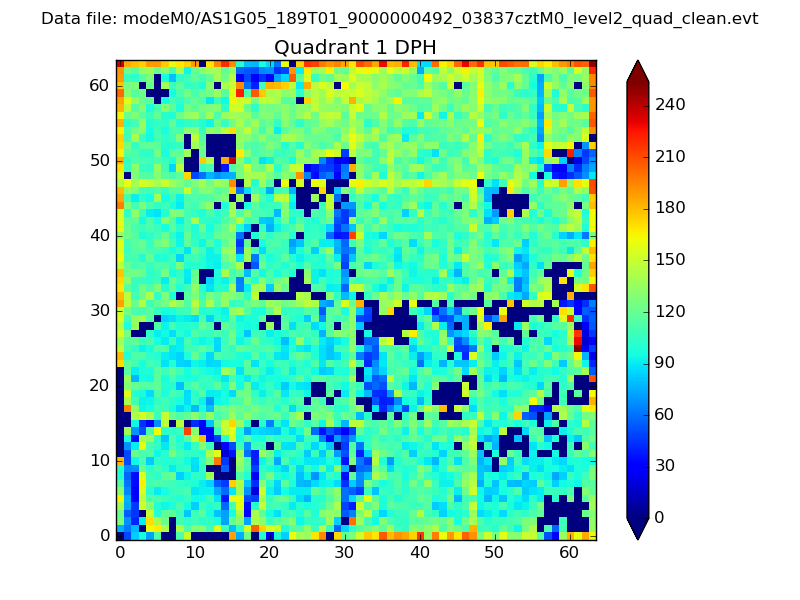 |
Quadrant B |
|---|---|---|---|
| Quadrant D | 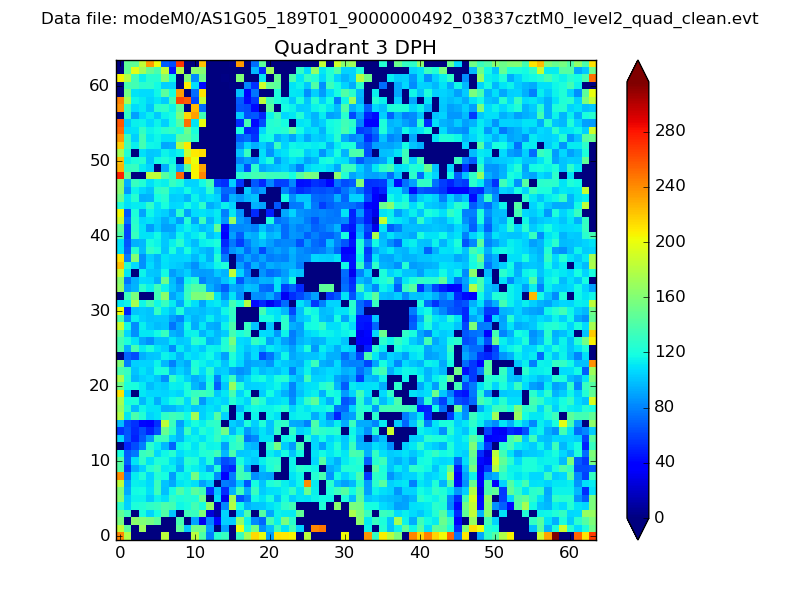 |
 |
Quadrant C |
| Plot type | Count rate plots | Images |
|---|---|---|
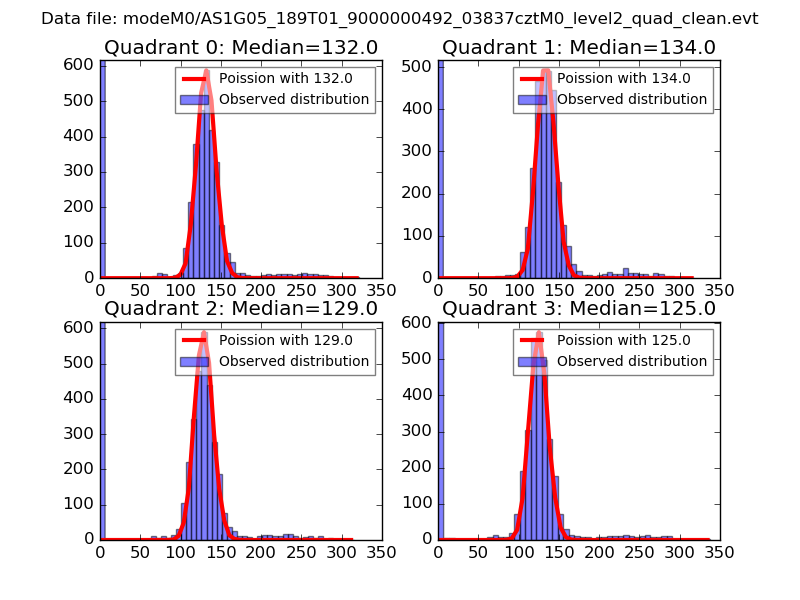
| Comparison with Poisson distribution Blue bars denote a histogram of data divided into 1 sec bins. Red curve is a Poisson curve with rate = median count rate of data. |
 |
 |
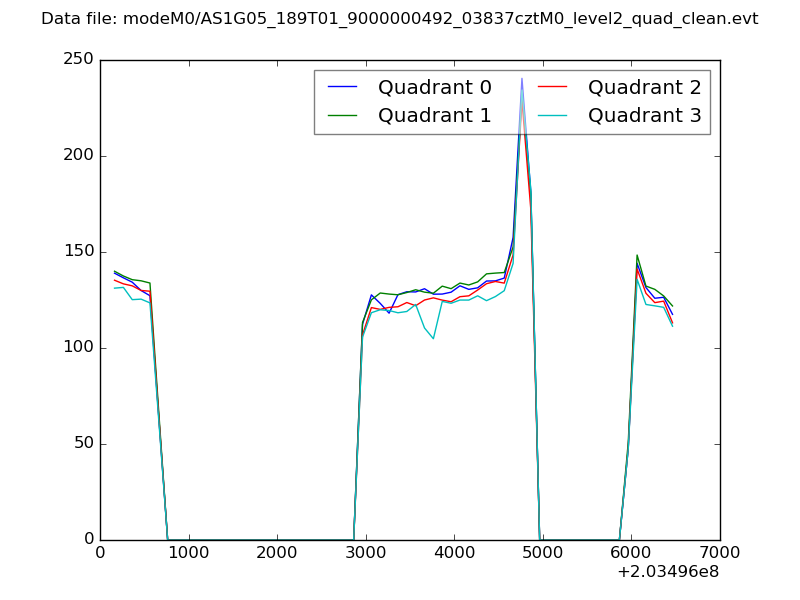
| Quadrant-wise count rates Data is divided into 100 sec bins |
 |
|
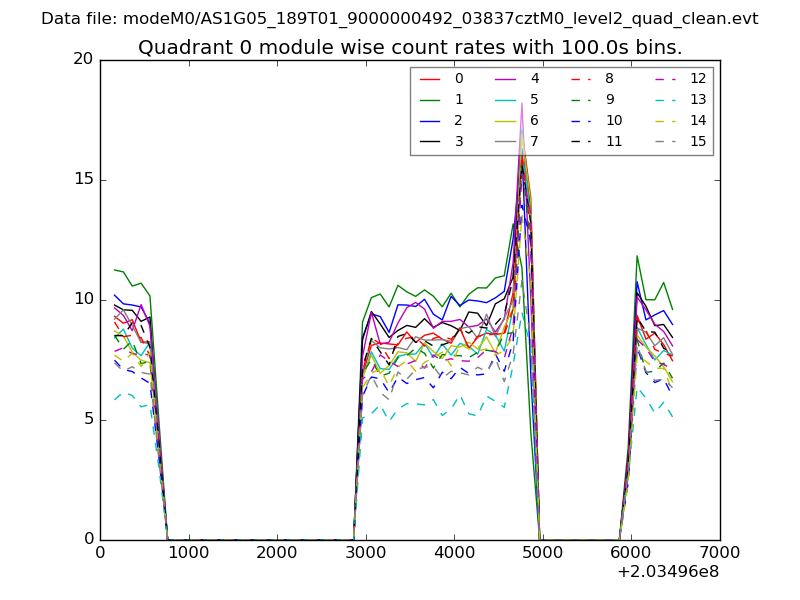
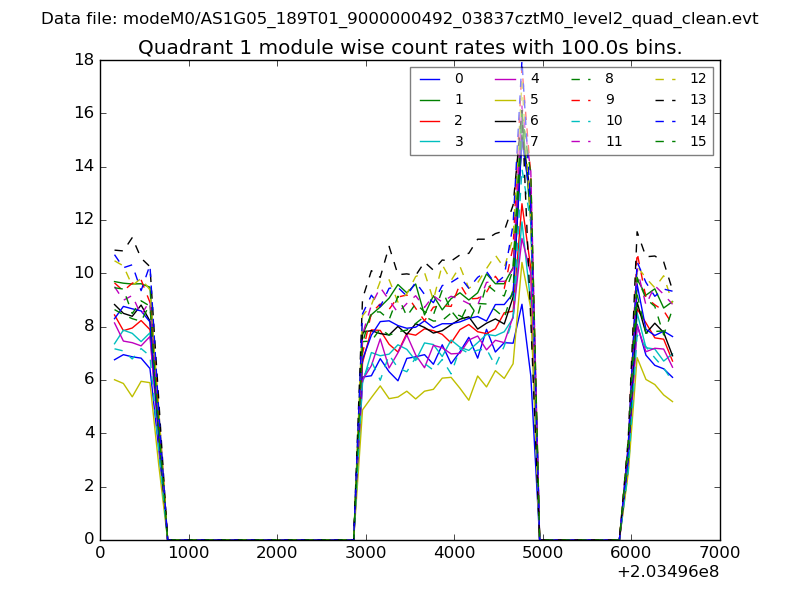
| Module-wise count rates for Quadrant A Data is divided into 100 sec bins |
 |
 |
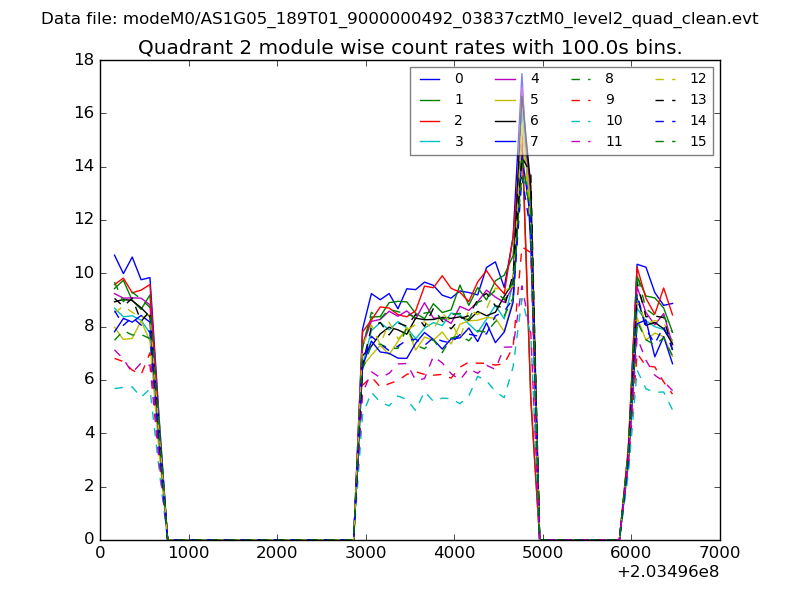
| Module-wise count rates for Quadrant B Data is divided into 100 sec bins |
 |
 |
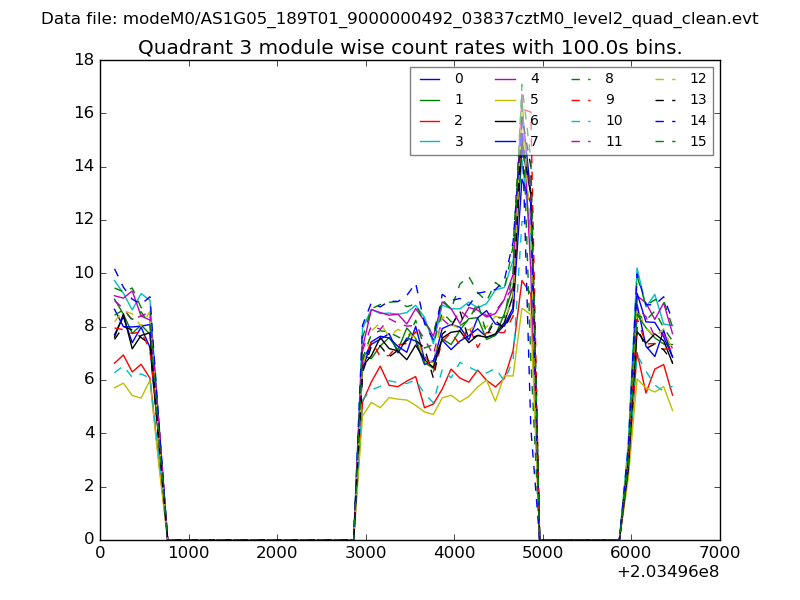
| Module-wise count rates for Quadrant C Data is divided into 100 sec bins |
 |
 |
| Module-wise count rates for Quadrant D Data is divided into 100 sec bins |
 |
 |
| Parameter | Plot |
|---|---|
| CZT HV Monitor | 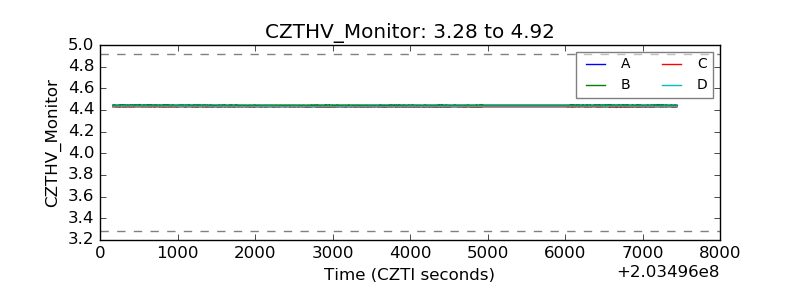 |
| D_VDD | 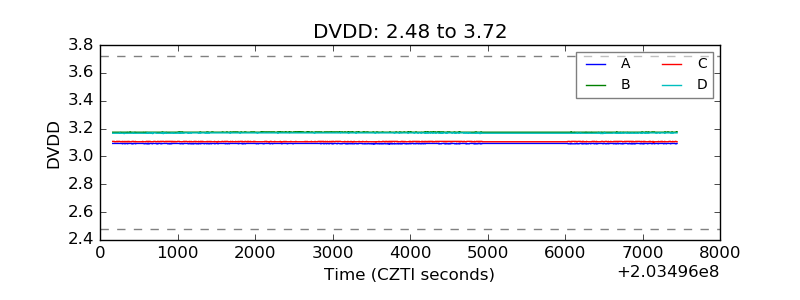 |
| Temperature 1 | 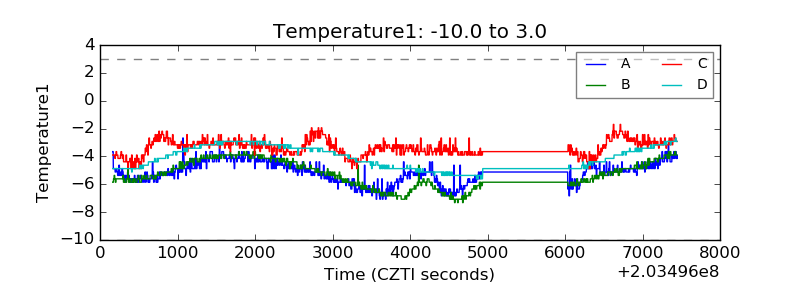 |
| Veto HV Monitor | 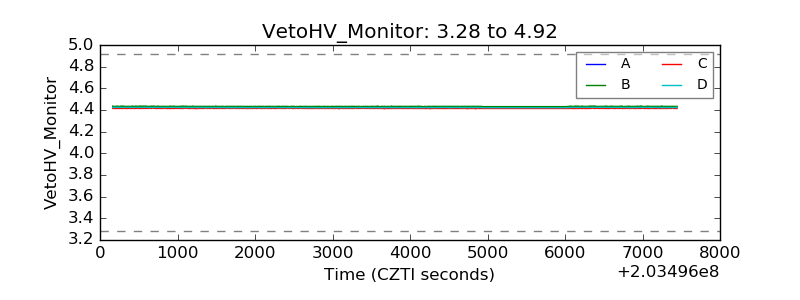 |
| Veto LLD | 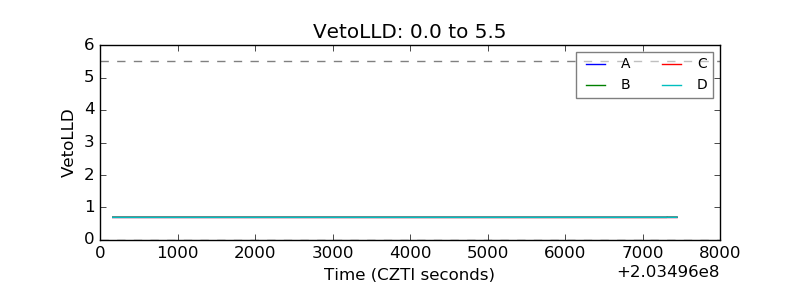 |
| Alpha Counter | 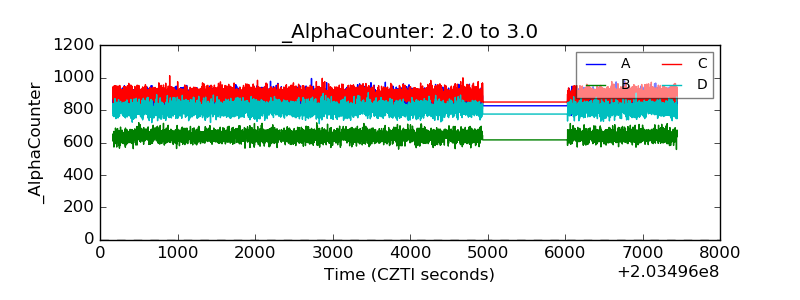 |
| _CPM_Rate | 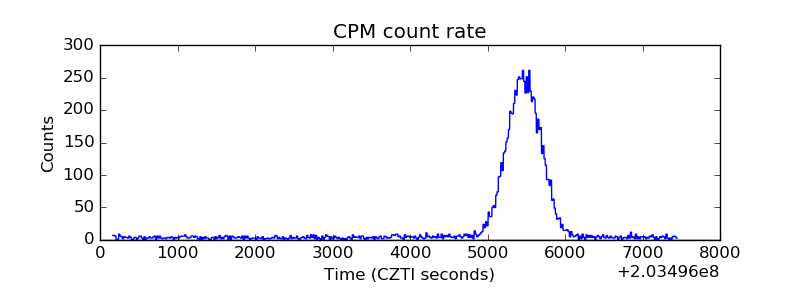 |
| CZT Counter | 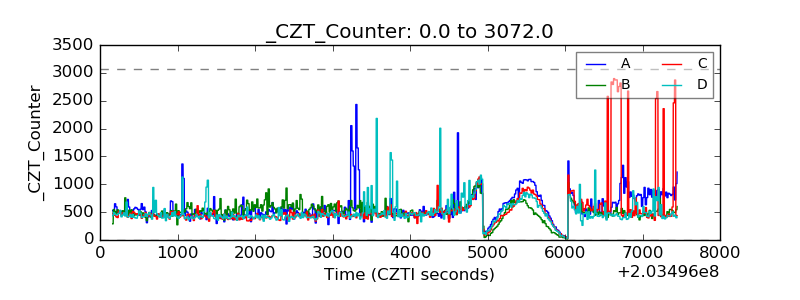 |
| +2.5 Volts monitor |  |
| +5 Volts monitor |  |
| _ROLL_ROT | 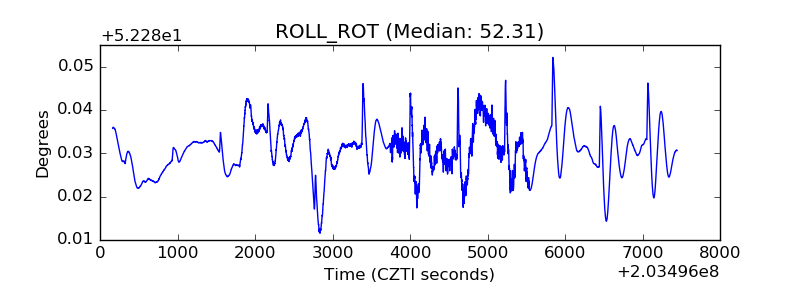 |
| _Roll_DEC | 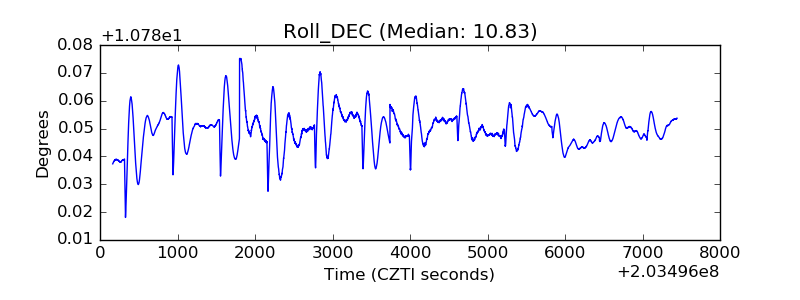 |
| _Roll_RA | 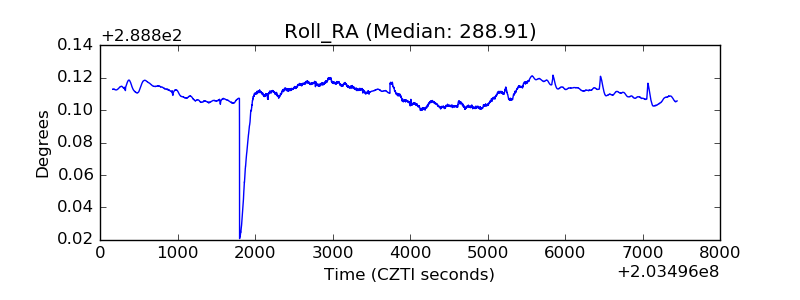 |
| Veto Counter | 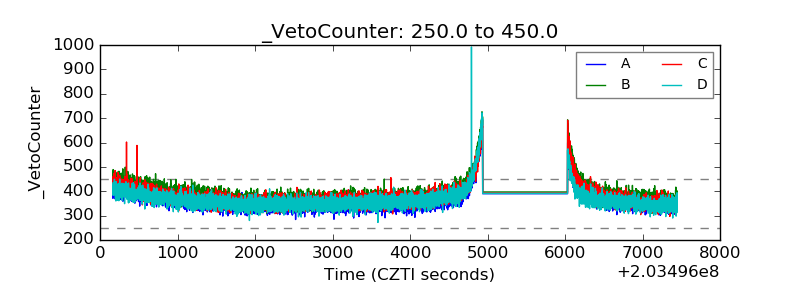 |