| Param | Original file | Final file |
|---|---|---|
| Filename | modeM0/AS1G05_189T01_9000000492_03838cztM0_level2.evt | modeM0/AS1G05_189T01_9000000492_03838cztM0_level2_quad_clean.evt |
| Size (bytes) | 651,127,680 | 59,376,960 |
| Size | 621.0 MB | 56.6 MB |
| Events in quadrant A | 4,873,905 | 348,941 |
| Events in quadrant B | 3,319,775 | 356,539 |
| Events in quadrant C | 7,679,537 | 293,040 |
| Events in quadrant D | 3,398,205 | 337,332 |
| Mode M0 | |||
|---|---|---|---|
| Quadrant | BADHDUFLAG | Total packets | Discarded packets |
| A | 0 | 18916 | 2 |
| B | 0 | 13960 | 1 |
| C | 0 | 27299 | 1 |
| D | 0 | 14873 | 1 |
| Mode M9 | |||
|---|---|---|---|
| Quadrant | BADHDUFLAG | Total packets | Discarded packets |
| A | 0 | 8 | 0 |
| B | 0 | 8 | 0 |
| C | 0 | 8 | 0 |
| D | 0 | 8 | 0 |
| Mode SS | |||
|---|---|---|---|
| Quadrant | BADHDUFLAG | Total packets | Discarded packets |
| A | 0 | 132 | 0 |
| B | 0 | 132 | 0 |
| C | 0 | 132 | 0 |
| D | 0 | 132 | 0 |
| Quadrant | Total seconds | Saturated seconds | Saturation percentage |
|---|---|---|---|
| A | 6619 | 624 | 9.427406% |
| B | 6619 | 149 | 2.251095% |
| C | 6619 | 1842 | 27.828977% |
| D | 6619 | 192 | 2.900740% |
Noise dominated data is calculated using 1-second bins in cleaned event files. If a bin has >2000 counts, and if more than 50% of those come from <1% of pixels, then it is considered to be noise-dominated and hence unusable.
| Quadrant | # 1 sec bins | Bins with >0 counts | Bins with >2000 counts | High rate bins dominated by noise | Noise dominated (total time) | Noise dominated (detector-on time) | Marked lightcurve |
|---|---|---|---|---|---|---|---|
| A | 7349 | 6619 | 421 | 421 | 5.73% | 6.36% | 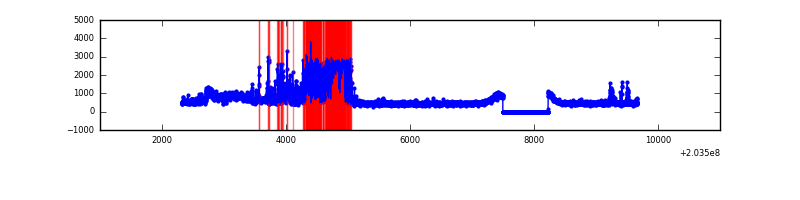 |
| B | 7349 | 6619 | 0 | 0 | 0.00% | 0.00% | 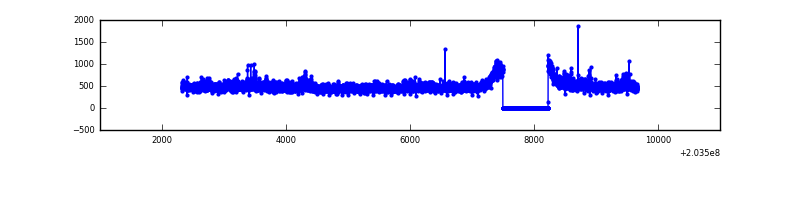 |
| C | 7349 | 6619 | 1714 | 1714 | 23.32% | 25.90% | 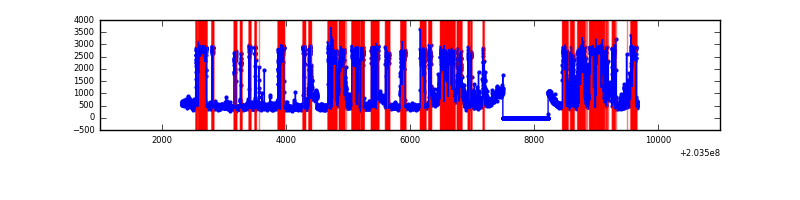 |
| D | 7349 | 6619 | 71 | 71 | 0.97% | 1.07% | 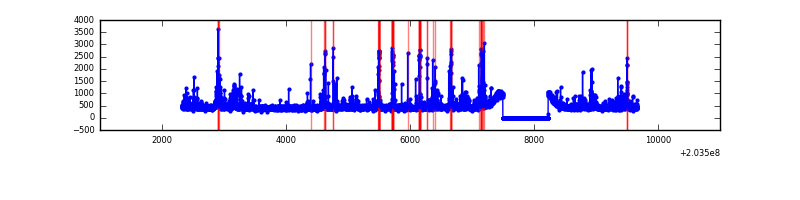 |
Top three noisy pixels from each quadrant. If the there are fewer than three noisy pixels in the level2.evt file, extra rows are filled as -1
| Pixel properties | Quadrant properties | ||||||
|---|---|---|---|---|---|---|---|
| Quadrant | DetID | PixID | Counts | Sigma | Mean | Median | Sigma |
| A | 15 | 234 | 1852600 | 11722.3 | 769 | 753 | 158.0 |
| A | 0 | 50 | 27167 | 167.2 | 769 | 753 | 158.0 |
| A | 13 | 251 | 22884 | 140.09 | 769 | 753 | 158.0 |
| B | 15 | 204 | 161746 | 1018.23 | 803 | 786 | 158.1 |
| B | 14 | 167 | 25360 | 155.45 | 803 | 786 | 158.1 |
| B | 4 | 81 | 16053 | 96.58 | 803 | 786 | 158.1 |
| C | 1 | 241 | 4873483 | 31791.83 | 649 | 652 | 153.3 |
| C | 14 | 234 | 141142 | 916.6 | 649 | 652 | 153.3 |
| C | 2 | 53 | 92050 | 596.31 | 649 | 652 | 153.3 |
| D | 13 | 248 | 265570 | 1413.42 | 765 | 745 | 187.4 |
| D | 13 | 223 | 115523 | 612.59 | 765 | 745 | 187.4 |
| D | 2 | 14 | 51733 | 272.13 | 765 | 745 | 187.4 |
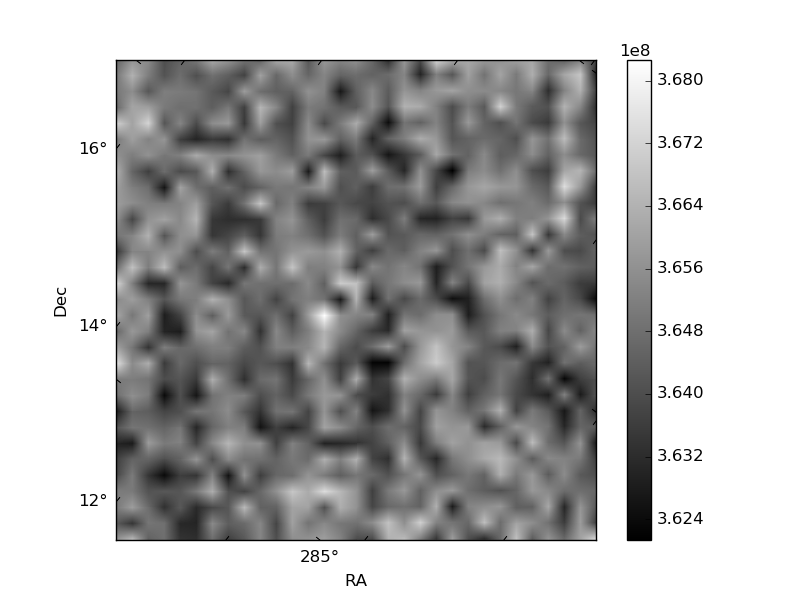
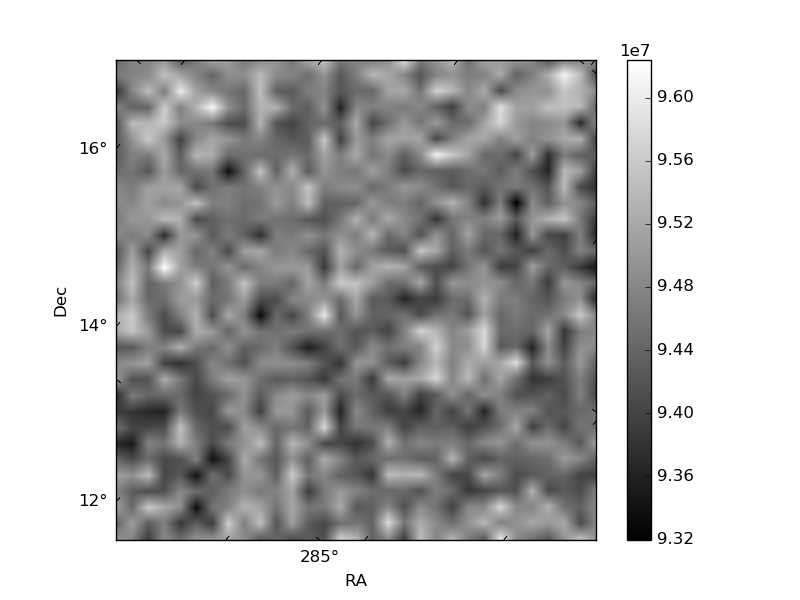
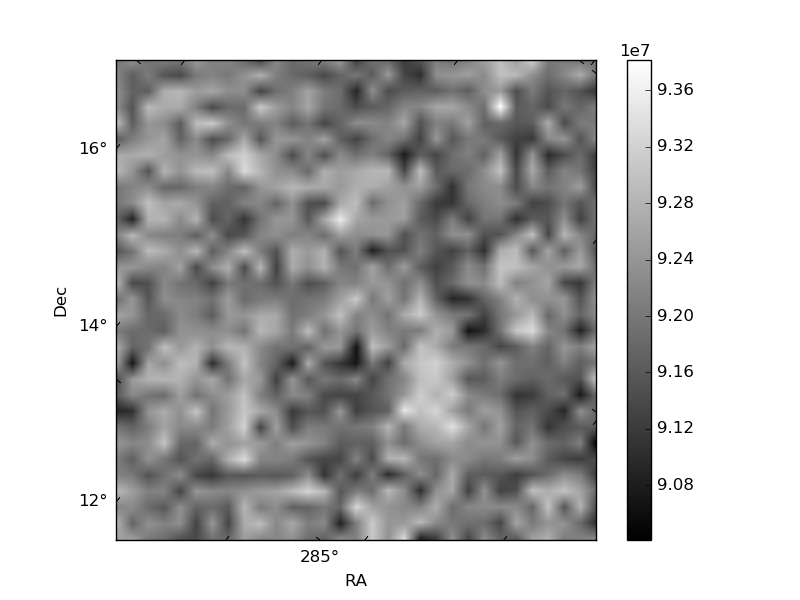
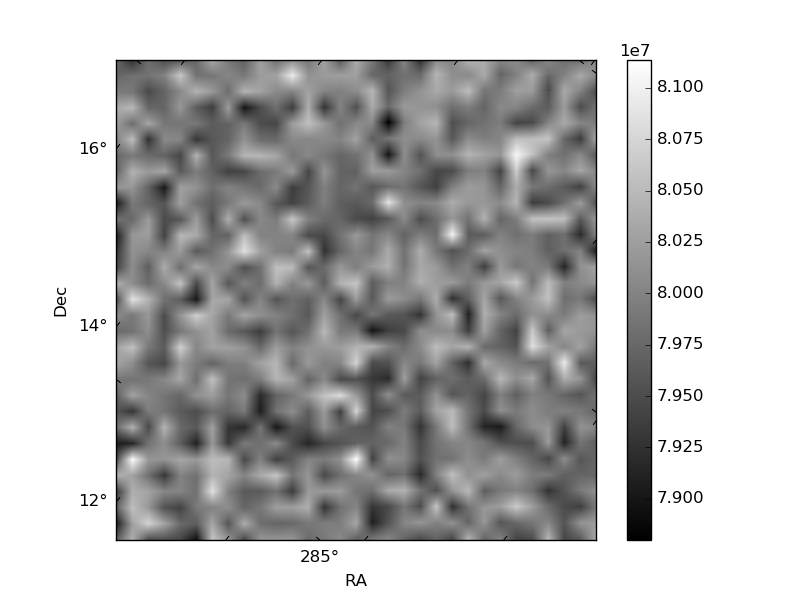
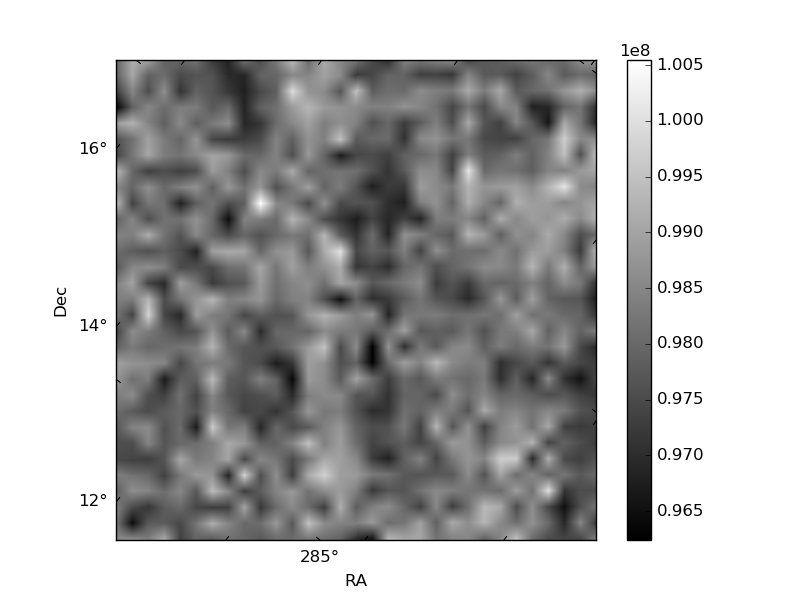
Histogram calculated using DETX and DETY for each event in the final _common_clean file
| Quadrant A | 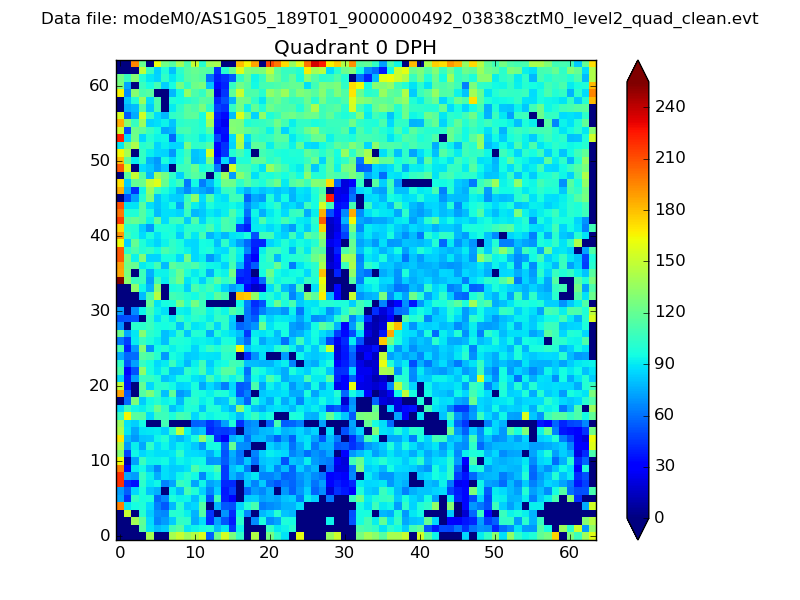 |
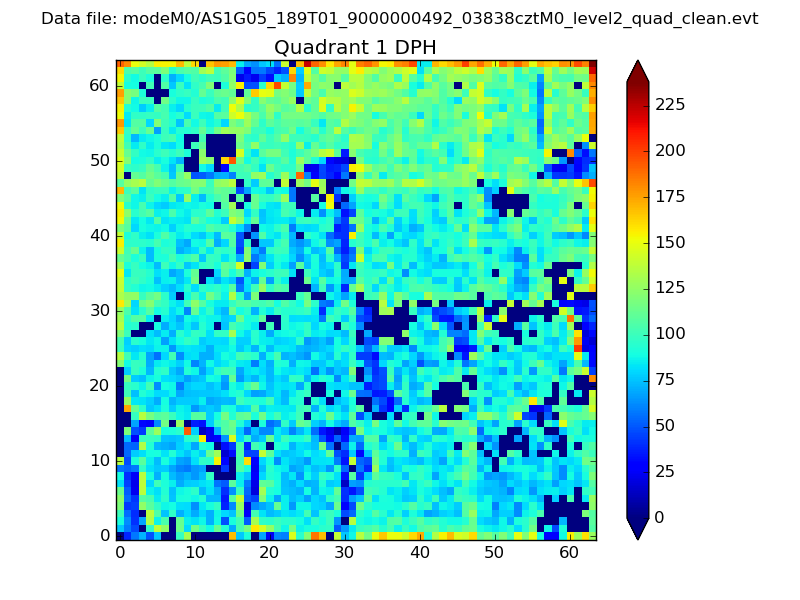 |
Quadrant B |
|---|---|---|---|
| Quadrant D | 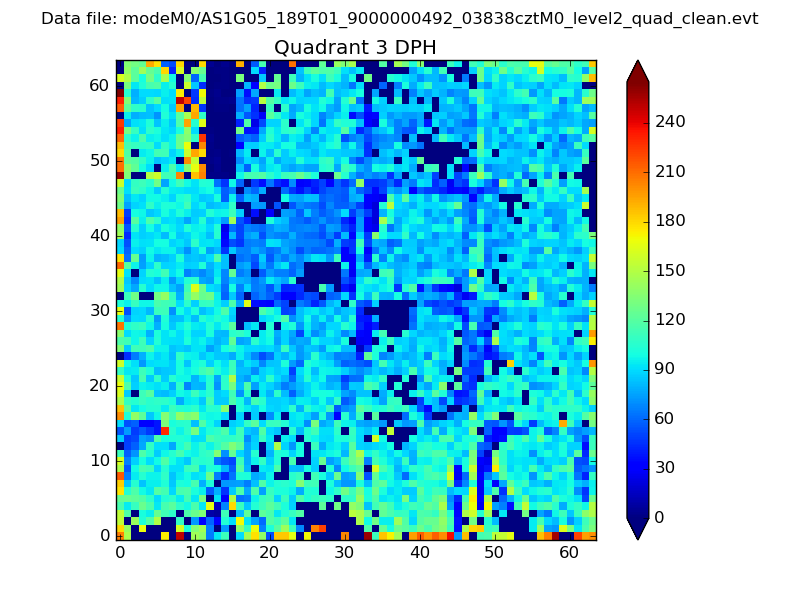 |
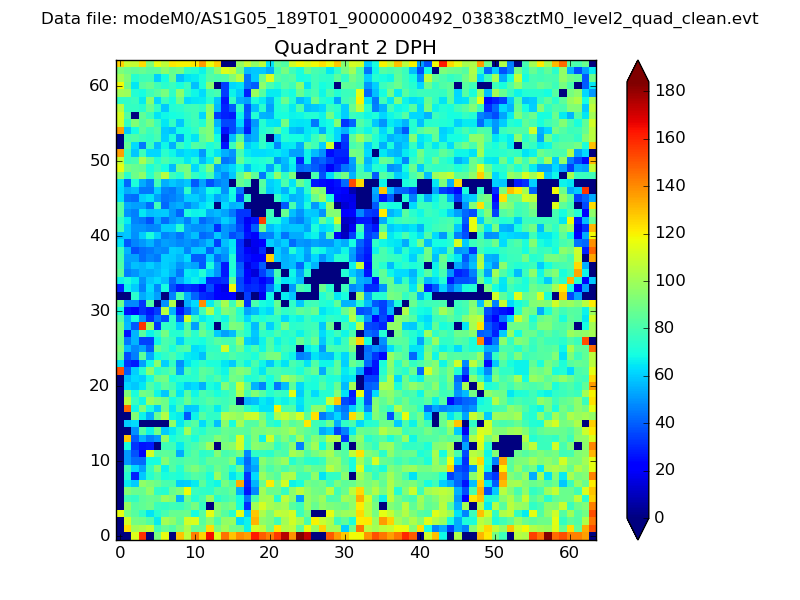 |
Quadrant C |
| Plot type | Count rate plots | Images |
|---|---|---|
| Comparison with Poisson distribution Blue bars denote a histogram of data divided into 1 sec bins. Red curve is a Poisson curve with rate = median count rate of data. |
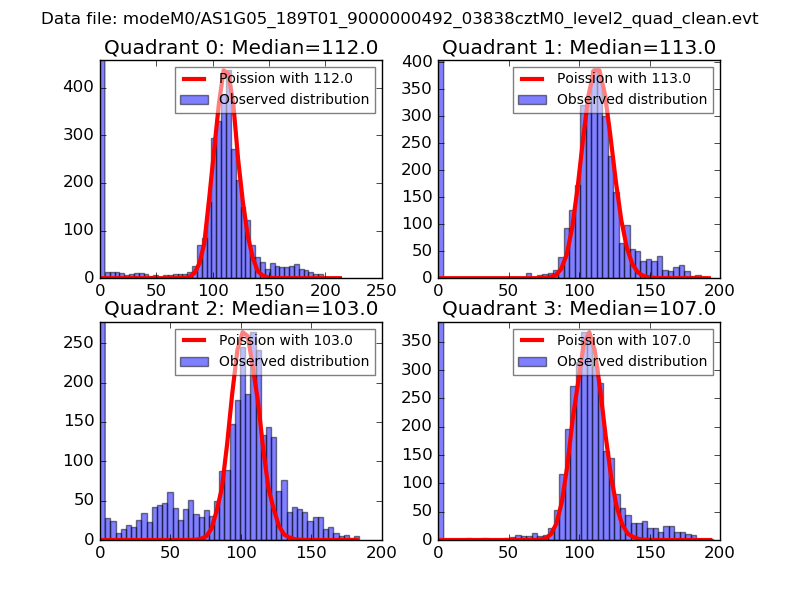 |
 |
| Quadrant-wise count rates Data is divided into 100 sec bins |
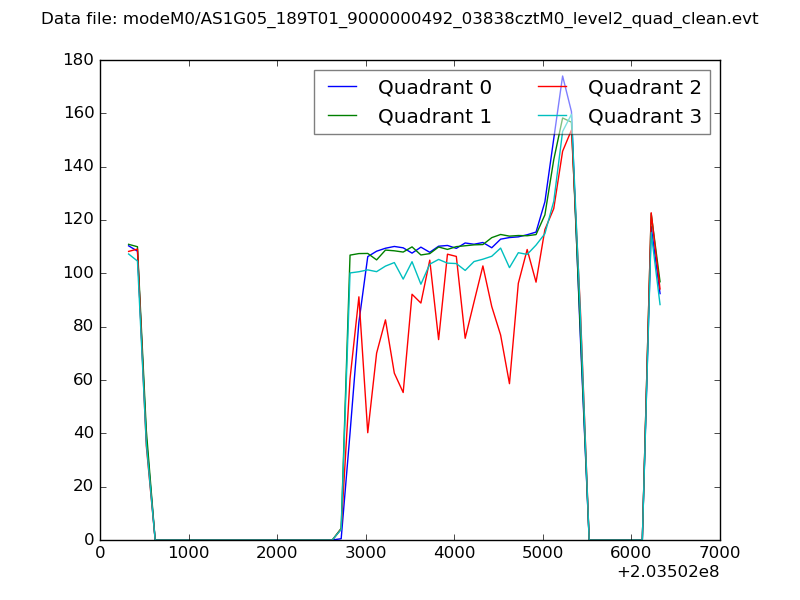 |
|
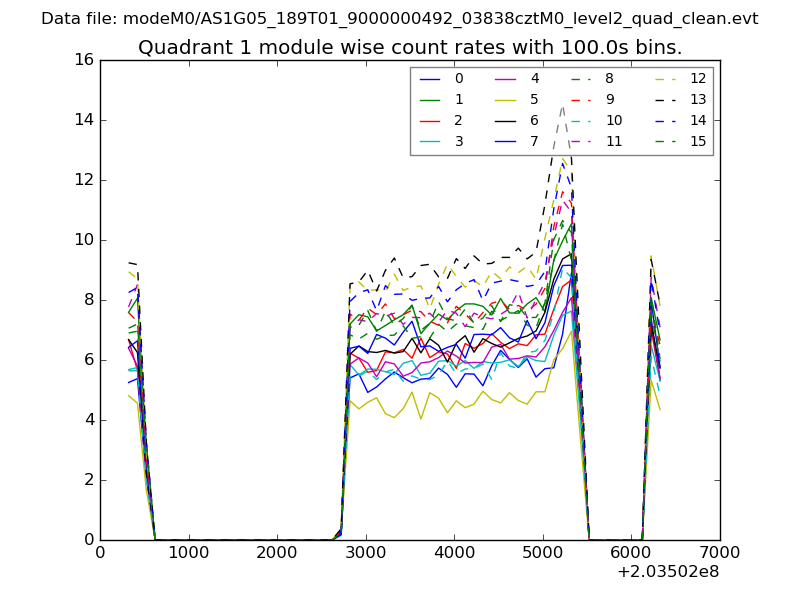
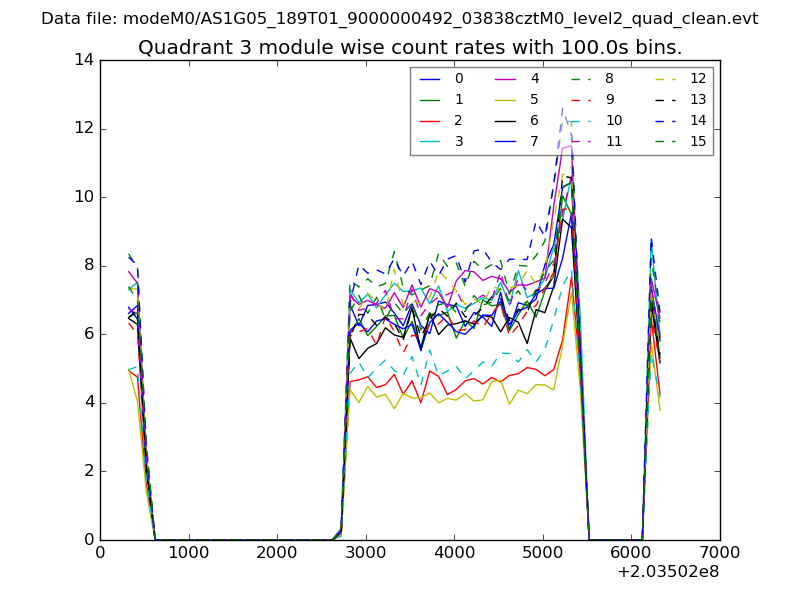
| Module-wise count rates for Quadrant A Data is divided into 100 sec bins |
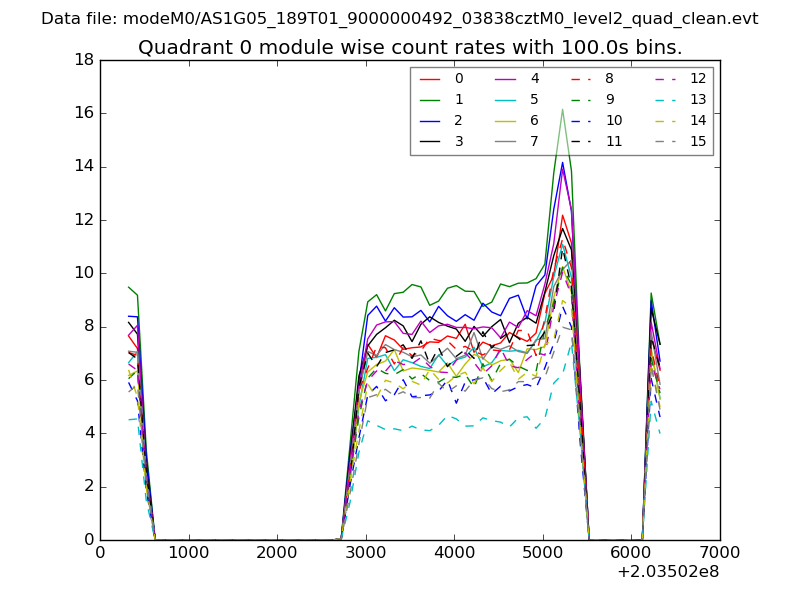 |
 |
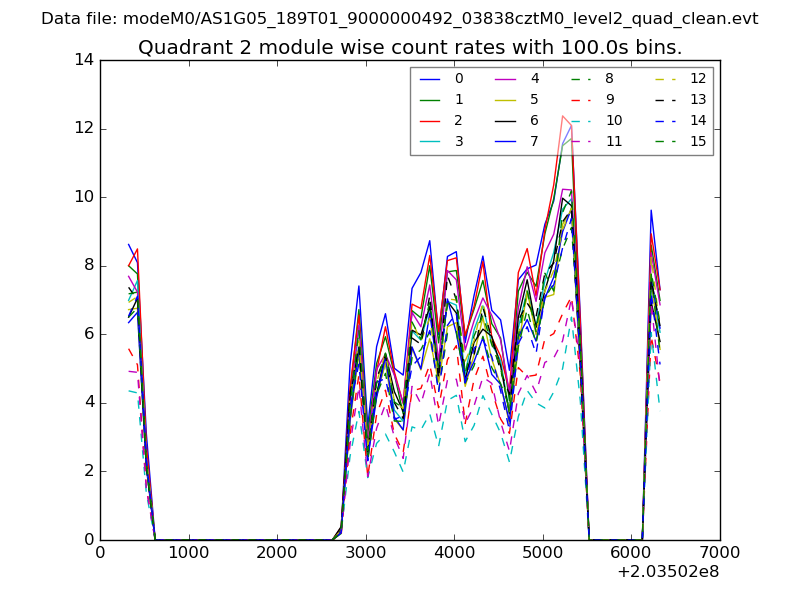
| Module-wise count rates for Quadrant B Data is divided into 100 sec bins |
 |
 |
| Module-wise count rates for Quadrant C Data is divided into 100 sec bins |
 |
 |
| Module-wise count rates for Quadrant D Data is divided into 100 sec bins |
 |
 |
| Parameter | Plot |
|---|---|
| CZT HV Monitor | 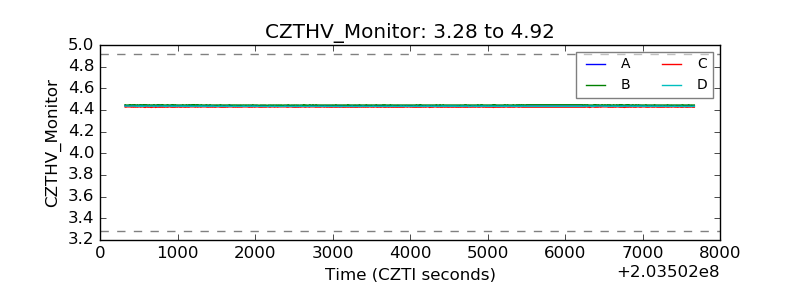 |
| D_VDD | 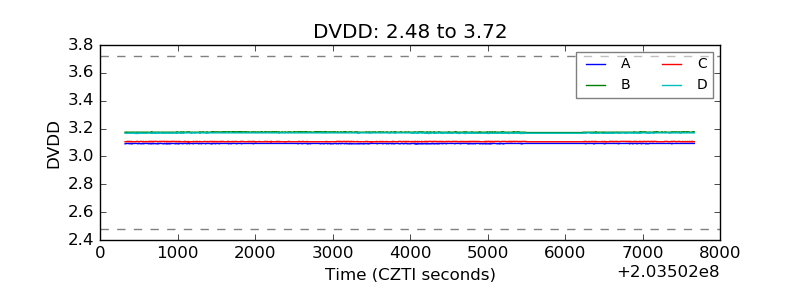 |
| Temperature 1 | 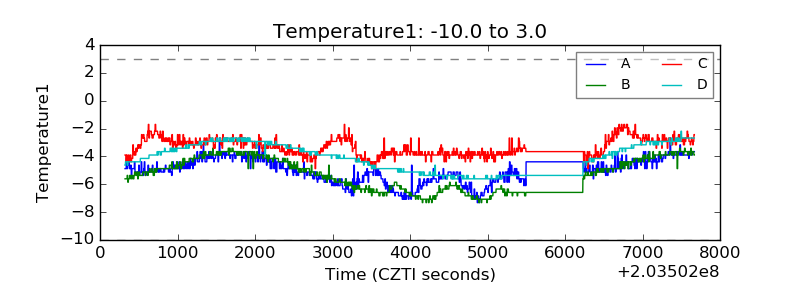 |
| Veto HV Monitor | 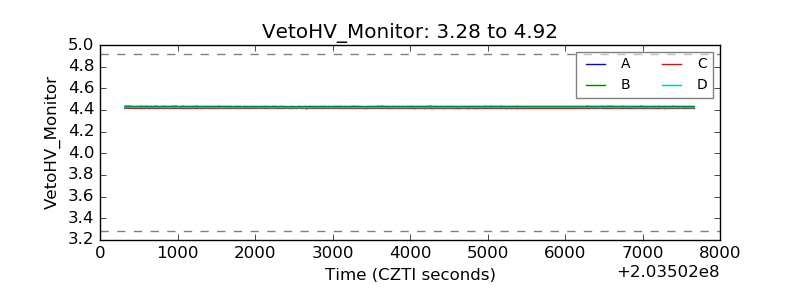 |
| Veto LLD | 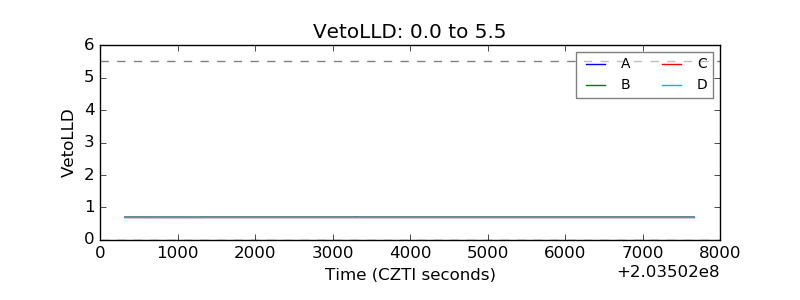 |
| Alpha Counter | 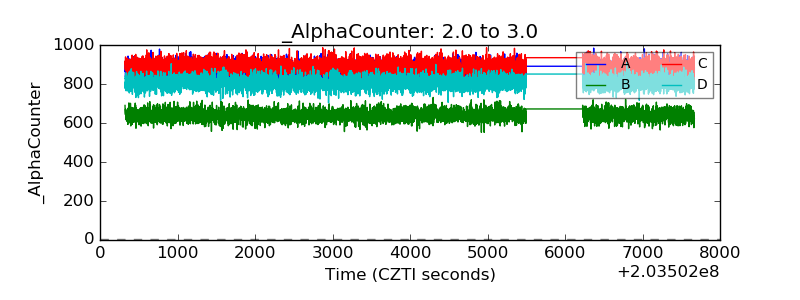 |
| _CPM_Rate | 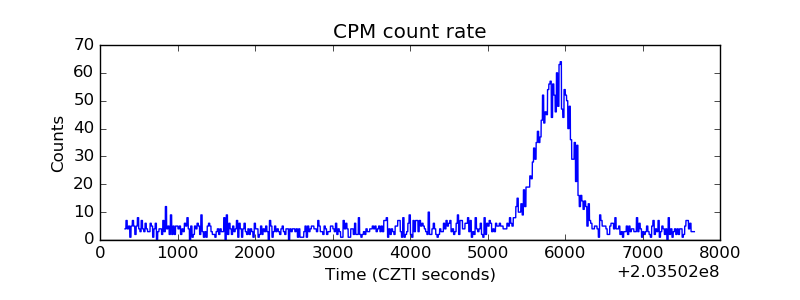 |
| CZT Counter |  |
| +2.5 Volts monitor |  |
| +5 Volts monitor |  |
| Veto Counter | 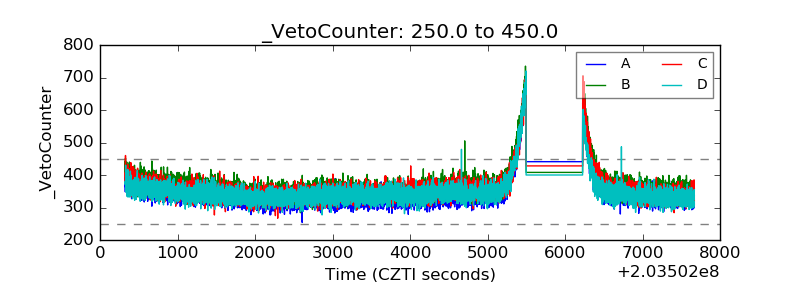 |