| Param | Original file | Final file |
|---|---|---|
| Filename | modeM0/AS1G05_189T01_9000000492_03839cztM0_level2.evt | modeM0/AS1G05_189T01_9000000492_03839cztM0_level2_quad_clean.evt |
| Size (bytes) | 679,253,760 | 67,510,080 |
| Size | 647.8 MB | 64.4 MB |
| Events in quadrant A | 3,917,544 | 399,037 |
| Events in quadrant B | 4,140,437 | 398,631 |
| Events in quadrant C | 8,356,007 | 336,490 |
| Events in quadrant D | 3,643,444 | 381,741 |
| Mode M0 | |||
|---|---|---|---|
| Quadrant | BADHDUFLAG | Total packets | Discarded packets |
| A | 0 | 16714 | 3 |
| B | 0 | 17247 | 2 |
| C | 0 | 30001 | 2 |
| D | 0 | 16445 | 2 |
| Mode M9 | |||
|---|---|---|---|
| Quadrant | BADHDUFLAG | Total packets | Discarded packets |
| A | 0 | 6 | 0 |
| B | 0 | 6 | 0 |
| C | 0 | 6 | 0 |
| D | 0 | 7 | 0 |
| Mode SS | |||
|---|---|---|---|
| Quadrant | BADHDUFLAG | Total packets | Discarded packets |
| A | 0 | 154 | 0 |
| B | 0 | 154 | 0 |
| C | 0 | 154 | 0 |
| D | 0 | 154 | 0 |
| Quadrant | Total seconds | Saturated seconds | Saturation percentage |
|---|---|---|---|
| A | 7585 | 294 | 3.876071% |
| B | 7585 | 298 | 3.928807% |
| C | 7585 | 1950 | 25.708635% |
| D | 7585 | 267 | 3.520105% |
Noise dominated data is calculated using 1-second bins in cleaned event files. If a bin has >2000 counts, and if more than 50% of those come from <1% of pixels, then it is considered to be noise-dominated and hence unusable.
| Quadrant | # 1 sec bins | Bins with >0 counts | Bins with >2000 counts | High rate bins dominated by noise | Noise dominated (total time) | Noise dominated (detector-on time) | Marked lightcurve |
|---|---|---|---|---|---|---|---|
| A | 7785 | 7585 | 3 | 3 | 0.04% | 0.04% | 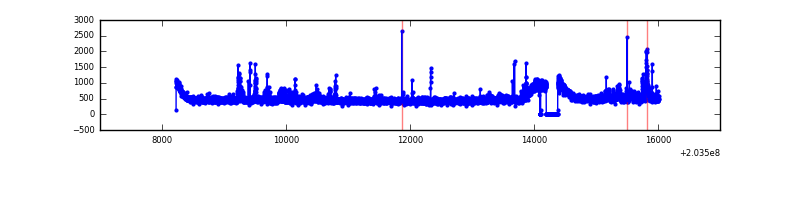 |
| B | 7785 | 7585 | 6 | 6 | 0.08% | 0.08% | 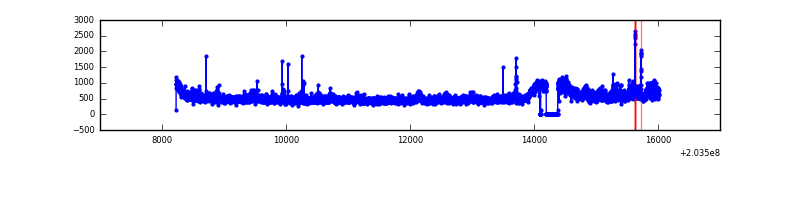 |
| C | 7785 | 7585 | 1694 | 1694 | 21.76% | 22.33% | 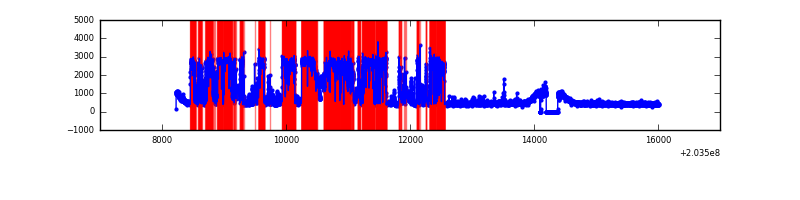 |
| D | 7785 | 7585 | 22 | 22 | 0.28% | 0.29% | 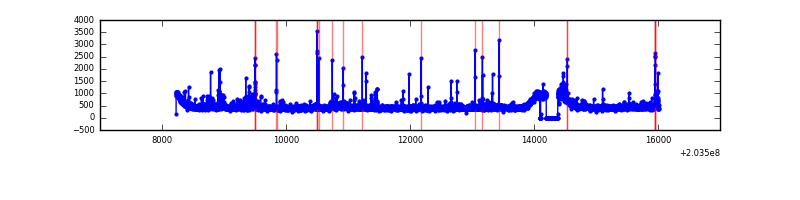 |
Top three noisy pixels from each quadrant. If the there are fewer than three noisy pixels in the level2.evt file, extra rows are filled as -1
| Pixel properties | Quadrant properties | ||||||
|---|---|---|---|---|---|---|---|
| Quadrant | DetID | PixID | Counts | Sigma | Mean | Median | Sigma |
| A | 15 | 234 | 280792 | 1463.59 | 924 | 902 | 191.2 |
| A | 0 | 50 | 37631 | 192.06 | 924 | 902 | 191.2 |
| A | 13 | 251 | 22243 | 111.6 | 924 | 902 | 191.2 |
| B | 15 | 204 | 401203 | 2200.24 | 929 | 907 | 181.9 |
| B | 14 | 167 | 82560 | 448.81 | 929 | 907 | 181.9 |
| B | 4 | 81 | 50532 | 272.77 | 929 | 907 | 181.9 |
| C | 1 | 241 | 5078996 | 27572.73 | 780 | 785 | 184.2 |
| C | 14 | 234 | 141325 | 763.08 | 780 | 785 | 184.2 |
| C | 2 | 53 | 35653 | 189.32 | 780 | 785 | 184.2 |
| D | 13 | 248 | 134086 | 609.14 | 894 | 867 | 218.7 |
| D | 13 | 223 | 47154 | 211.65 | 894 | 867 | 218.7 |
| D | 8 | 112 | 25900 | 114.46 | 894 | 867 | 218.7 |
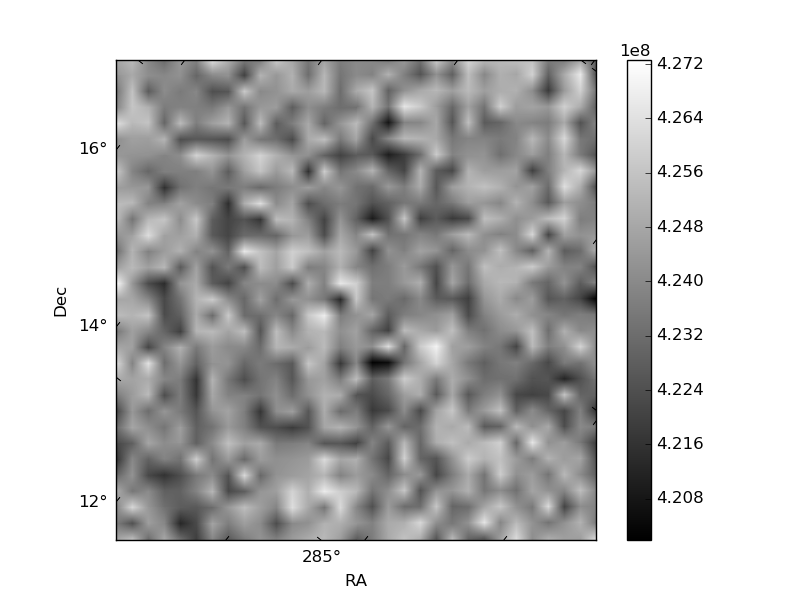
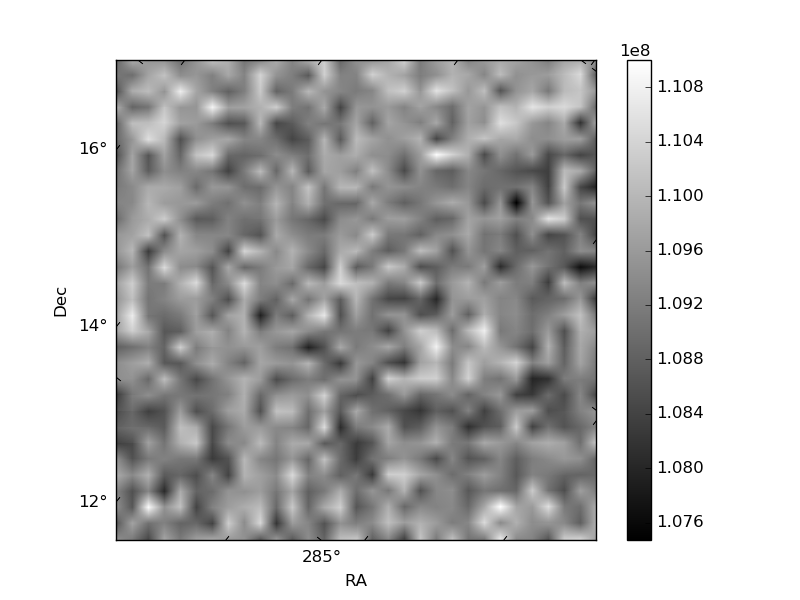
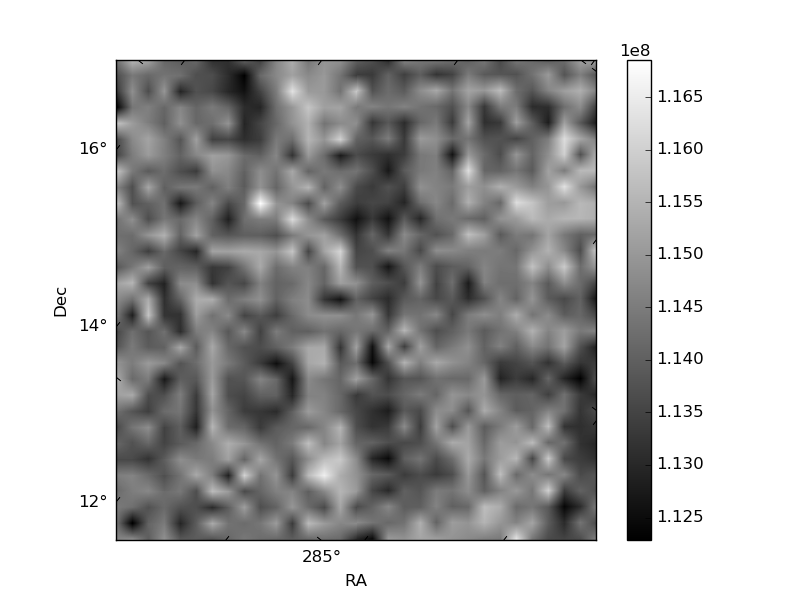
Histogram calculated using DETX and DETY for each event in the final _common_clean file
| Quadrant A | 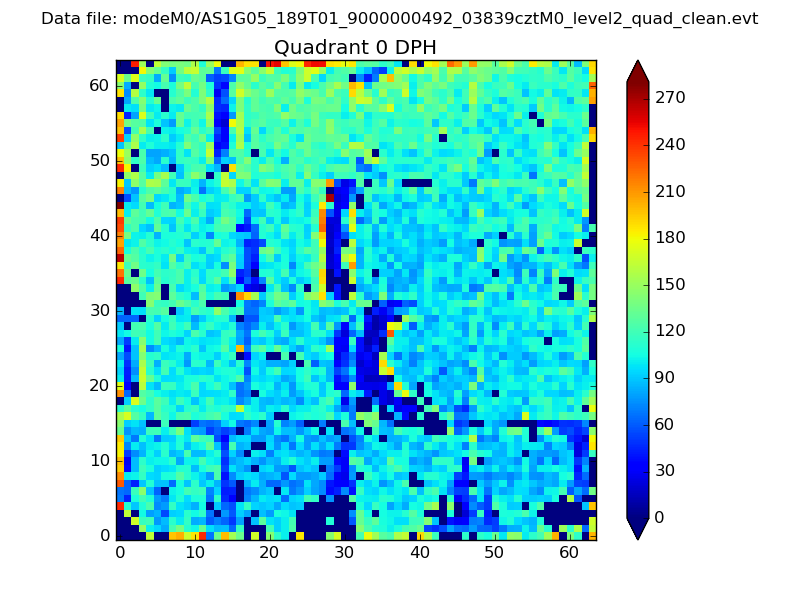 |
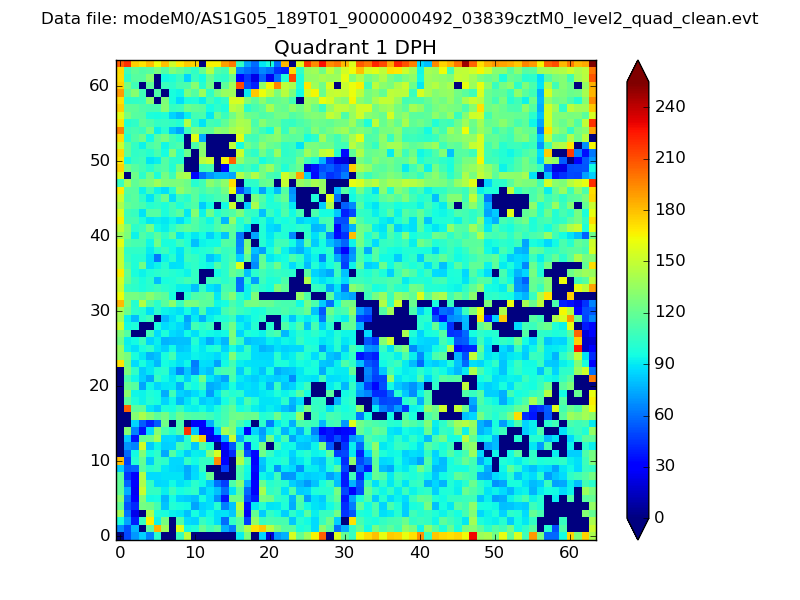 |
Quadrant B |
|---|---|---|---|
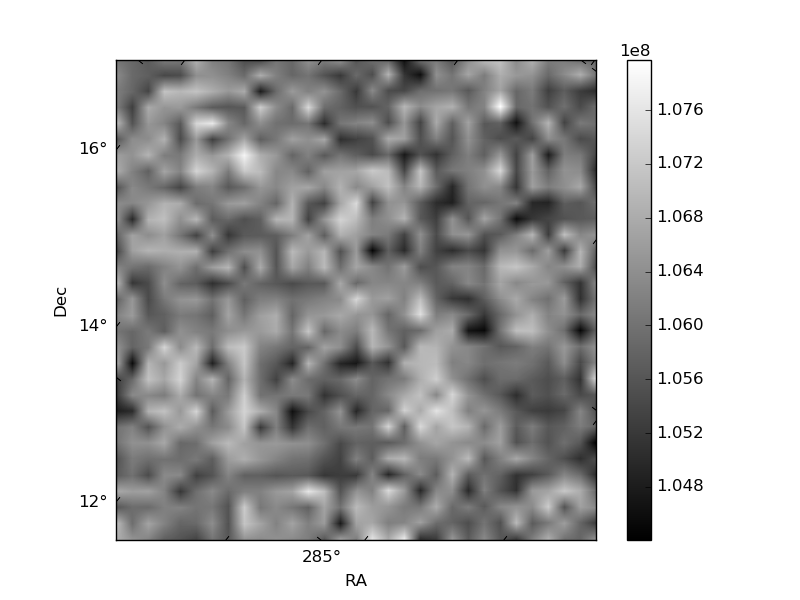
| Quadrant D | 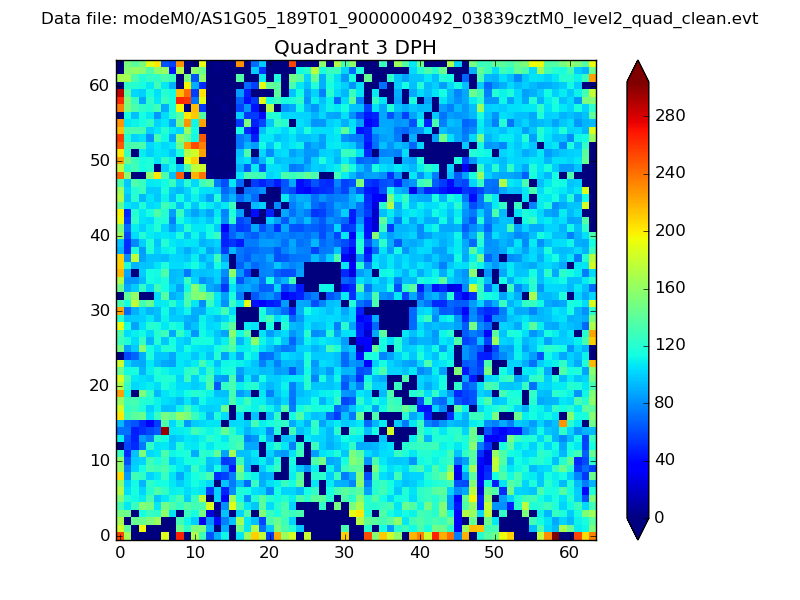 |
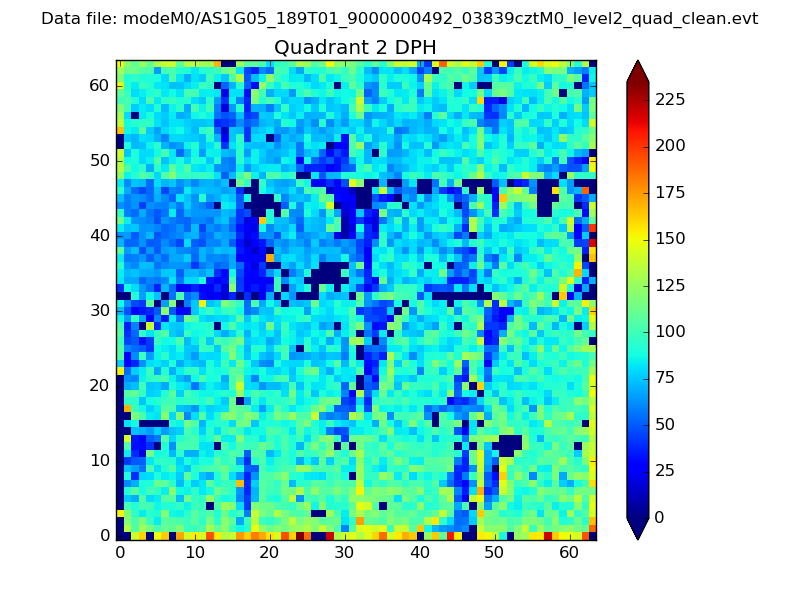 |
Quadrant C |
| Plot type | Count rate plots | Images |
|---|---|---|
| Comparison with Poisson distribution Blue bars denote a histogram of data divided into 1 sec bins. Red curve is a Poisson curve with rate = median count rate of data. |
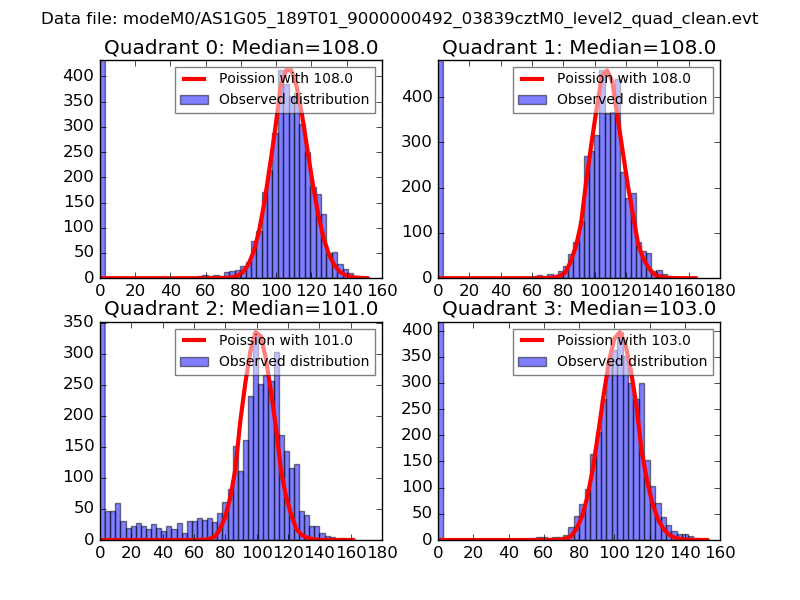 |
 |
| Quadrant-wise count rates Data is divided into 100 sec bins |
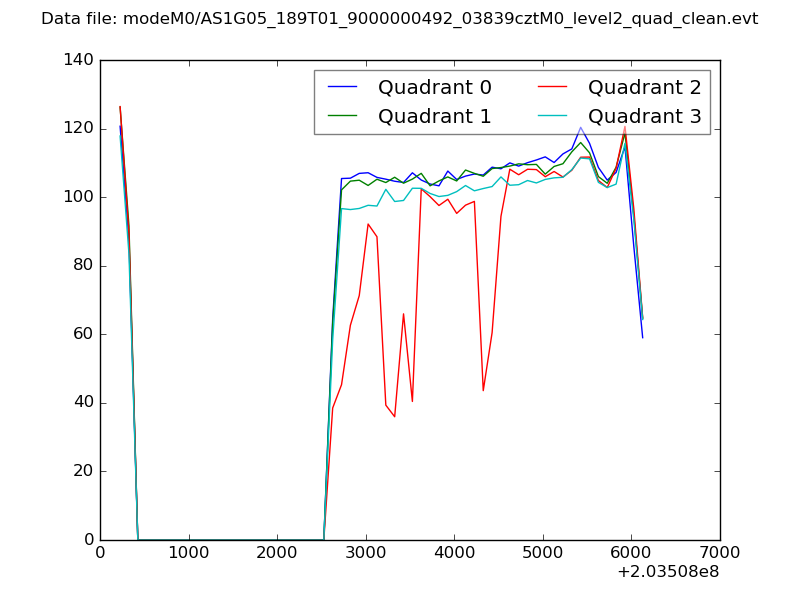 |
|
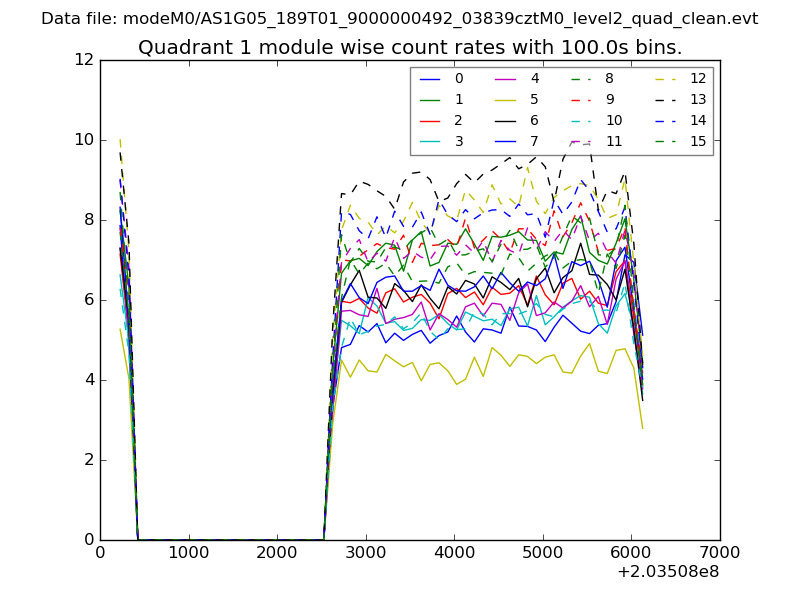
| Module-wise count rates for Quadrant A Data is divided into 100 sec bins |
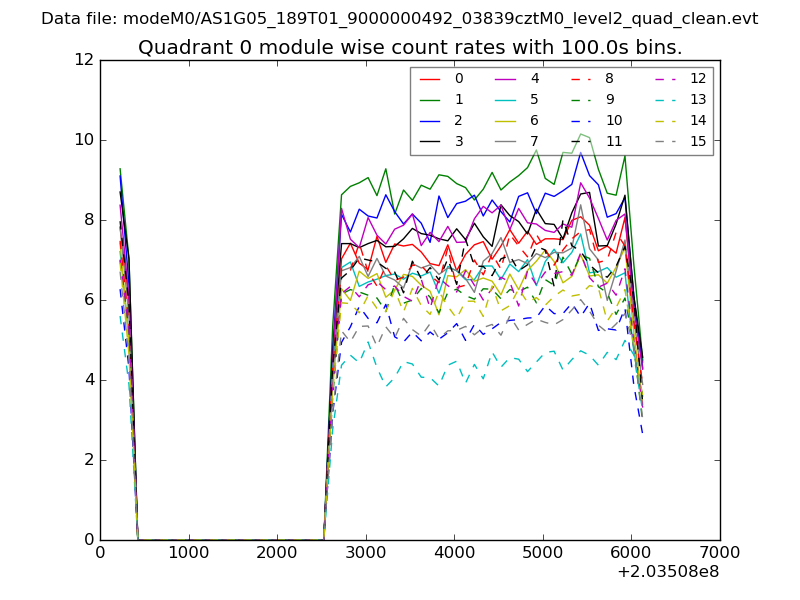 |
 |
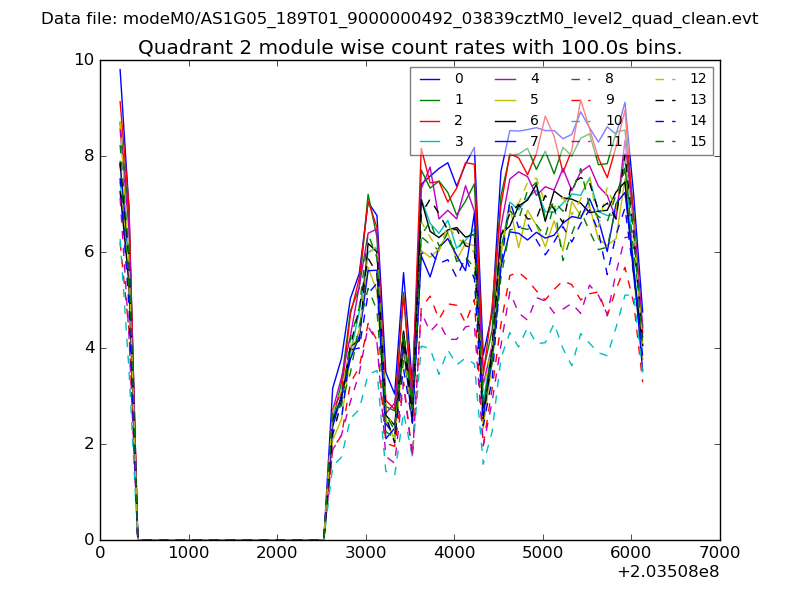
| Module-wise count rates for Quadrant B Data is divided into 100 sec bins |
 |
 |
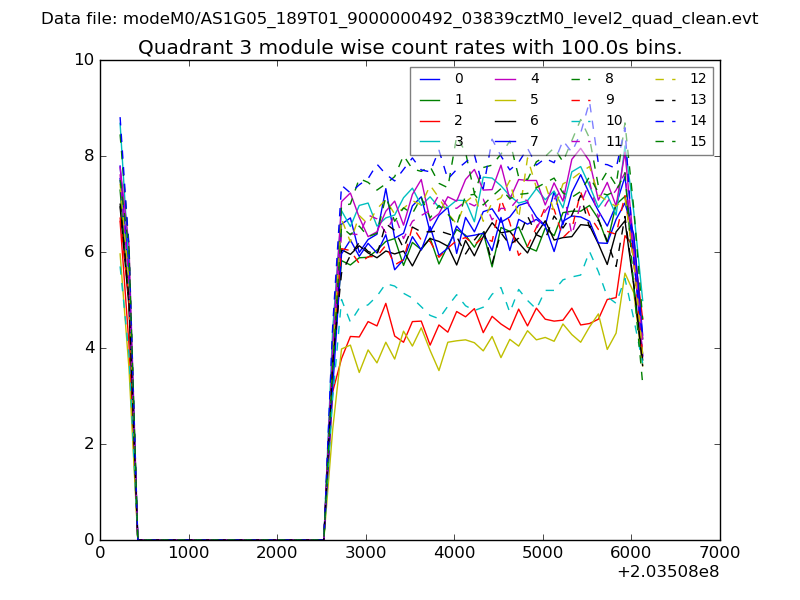
| Module-wise count rates for Quadrant C Data is divided into 100 sec bins |
 |
 |
| Module-wise count rates for Quadrant D Data is divided into 100 sec bins |
 |
 |
| Parameter | Plot |
|---|---|
| CZT HV Monitor | 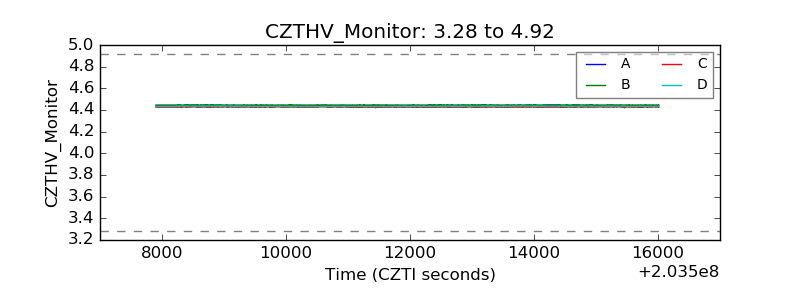 |
| D_VDD | 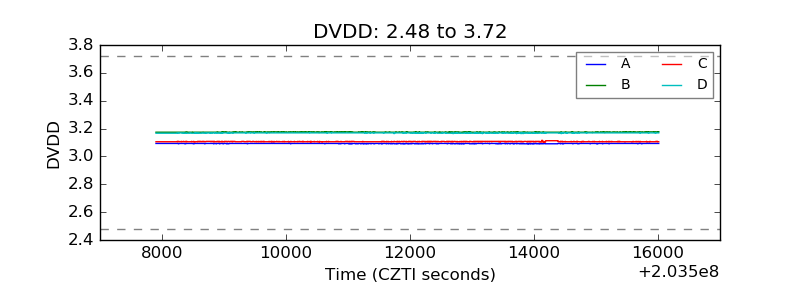 |
| Temperature 1 | 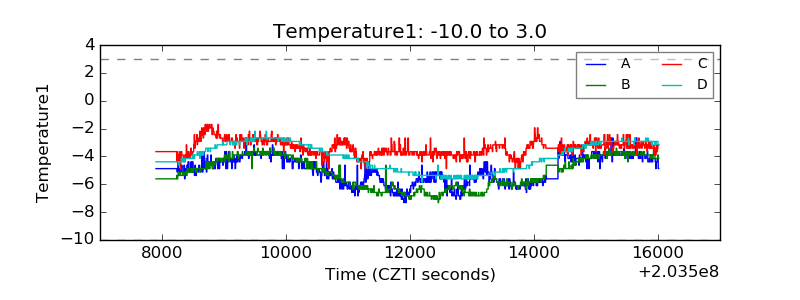 |
| Veto HV Monitor | 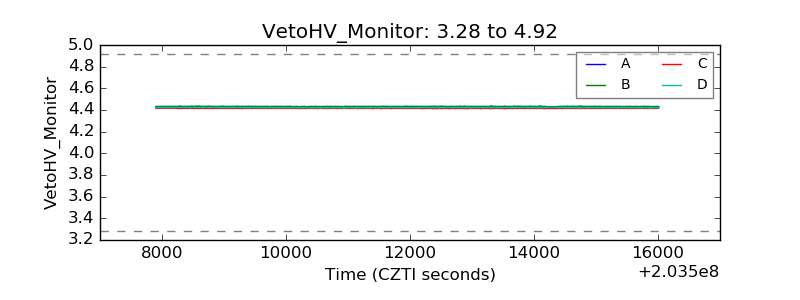 |
| Veto LLD | 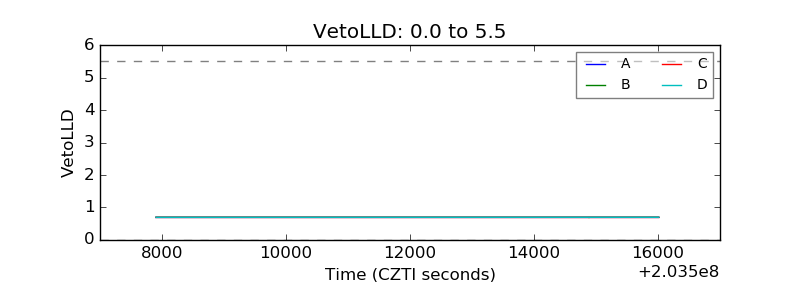 |
| Alpha Counter | 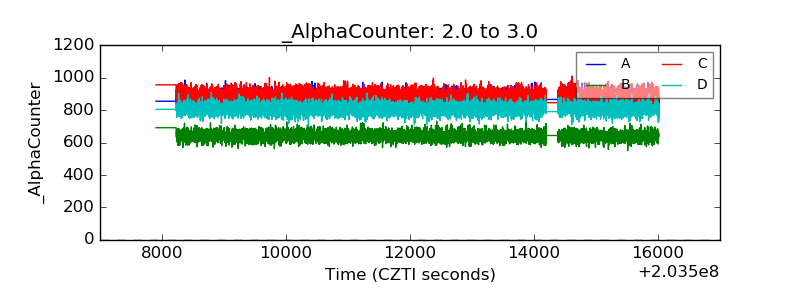 |
| _CPM_Rate | 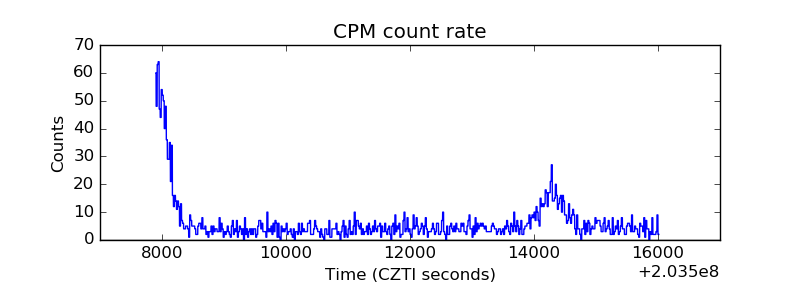 |
| CZT Counter | 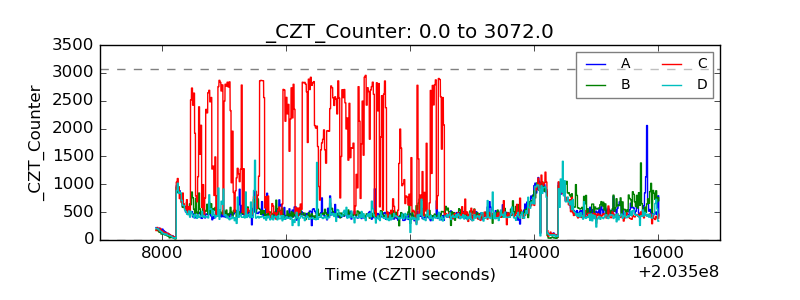 |
| +2.5 Volts monitor |  |
| +5 Volts monitor | 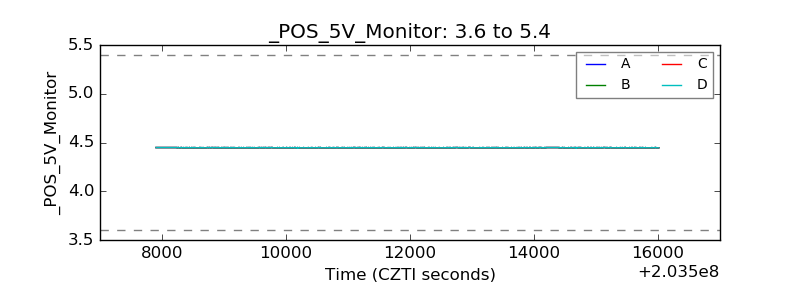 |
| Veto Counter | 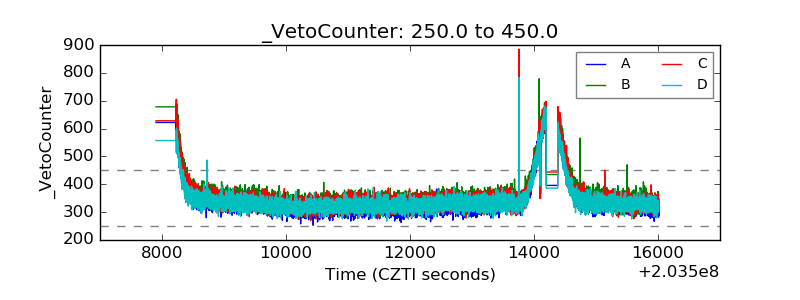 |