| Param | Original file | Final file |
|---|---|---|
| Filename | modeM0/AS1G05_189T01_9000000492_03840cztM0_level2.evt | modeM0/AS1G05_189T01_9000000492_03840cztM0_level2_quad_clean.evt |
| Size (bytes) | 711,270,720 | 82,932,480 |
| Size | 678.3 MB | 79.1 MB |
| Events in quadrant A | 5,824,026 | 477,918 |
| Events in quadrant B | 5,115,294 | 481,296 |
| Events in quadrant C | 5,564,155 | 469,915 |
| Events in quadrant D | 4,434,224 | 463,513 |
| Mode M0 | |||
|---|---|---|---|
| Quadrant | BADHDUFLAG | Total packets | Discarded packets |
| A | 0 | 23200 | 3 |
| B | 0 | 20892 | 2 |
| C | 0 | 23048 | 2 |
| D | 0 | 19717 | 2 |
| Mode M9 | |||
|---|---|---|---|
| Quadrant | BADHDUFLAG | Total packets | Discarded packets |
| A | 0 | 4 | 0 |
| B | 0 | 4 | 0 |
| C | 0 | 4 | 0 |
| D | 0 | 4 | 0 |
| Mode SS | |||
|---|---|---|---|
| Quadrant | BADHDUFLAG | Total packets | Discarded packets |
| A | 0 | 180 | 0 |
| B | 0 | 180 | 0 |
| C | 0 | 180 | 0 |
| D | 0 | 180 | 0 |
| Quadrant | Total seconds | Saturated seconds | Saturation percentage |
|---|---|---|---|
| A | 8920 | 612 | 6.860987% |
| B | 8920 | 468 | 5.246637% |
| C | 8920 | 500 | 5.605381% |
| D | 8920 | 381 | 4.271300% |
Noise dominated data is calculated using 1-second bins in cleaned event files. If a bin has >2000 counts, and if more than 50% of those come from <1% of pixels, then it is considered to be noise-dominated and hence unusable.
| Quadrant | # 1 sec bins | Bins with >0 counts | Bins with >2000 counts | High rate bins dominated by noise | Noise dominated (total time) | Noise dominated (detector-on time) | Marked lightcurve |
|---|---|---|---|---|---|---|---|
| A | 9155 | 8921 | 138 | 138 | 1.51% | 1.55% | 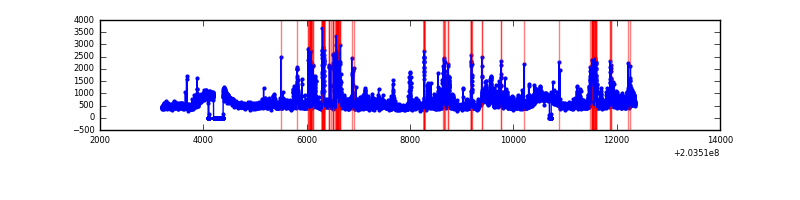 |
| B | 9155 | 8921 | 10 | 10 | 0.11% | 0.11% | 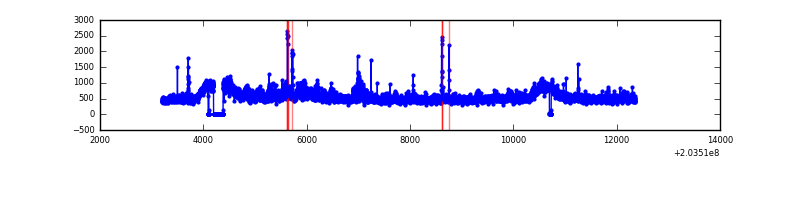 |
| C | 9155 | 8920 | 52 | 52 | 0.57% | 0.58% | 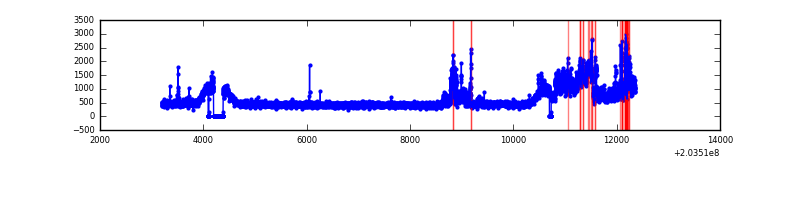 |
| D | 9155 | 8921 | 41 | 41 | 0.45% | 0.46% | 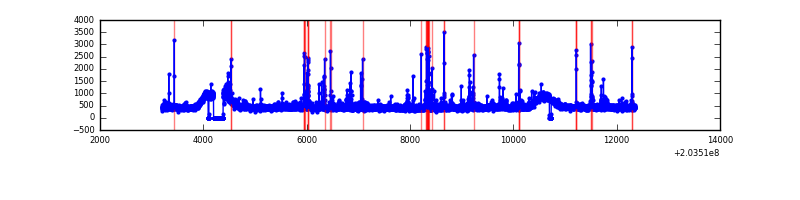 |
Top three noisy pixels from each quadrant. If the there are fewer than three noisy pixels in the level2.evt file, extra rows are filled as -1
| Pixel properties | Quadrant properties | ||||||
|---|---|---|---|---|---|---|---|
| Quadrant | DetID | PixID | Counts | Sigma | Mean | Median | Sigma |
| A | 15 | 234 | 1409146 | 6223.65 | 1096 | 1068 | 226.2 |
| A | 13 | 251 | 118719 | 520.01 | 1096 | 1068 | 226.2 |
| A | 8 | 15 | 40933 | 176.2 | 1096 | 1068 | 226.2 |
| B | 15 | 204 | 653248 | 2999.77 | 1110 | 1084 | 217.4 |
| B | 14 | 167 | 101748 | 463.03 | 1110 | 1084 | 217.4 |
| B | 4 | 81 | 25539 | 112.49 | 1110 | 1084 | 217.4 |
| C | 2 | 53 | 1358925 | 5444.93 | 1058 | 1061 | 249.4 |
| C | 1 | 16 | 35714 | 138.96 | 1058 | 1061 | 249.4 |
| C | 1 | 241 | 14594 | 54.27 | 1058 | 1061 | 249.4 |
| D | 13 | 248 | 186028 | 704.01 | 1069 | 1036 | 262.8 |
| D | 7 | 39 | 57888 | 216.36 | 1069 | 1036 | 262.8 |
| D | 8 | 112 | 39780 | 147.45 | 1069 | 1036 | 262.8 |
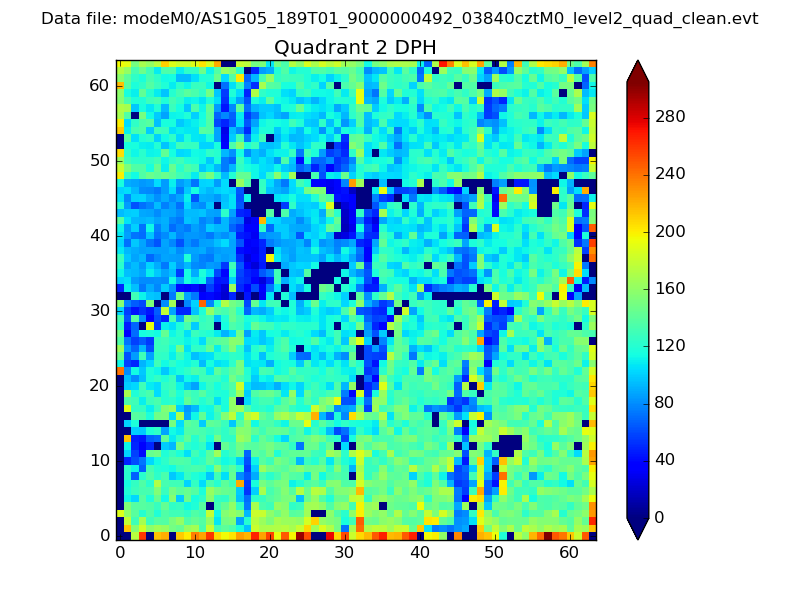
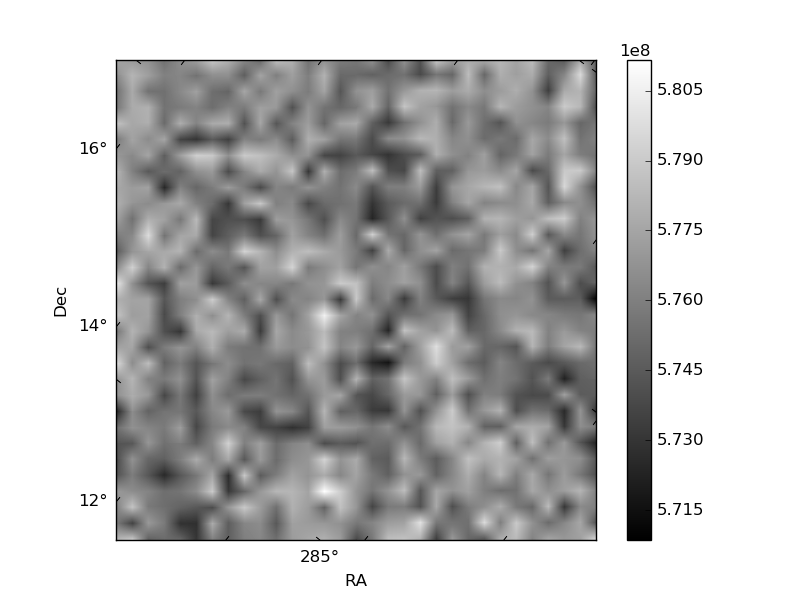
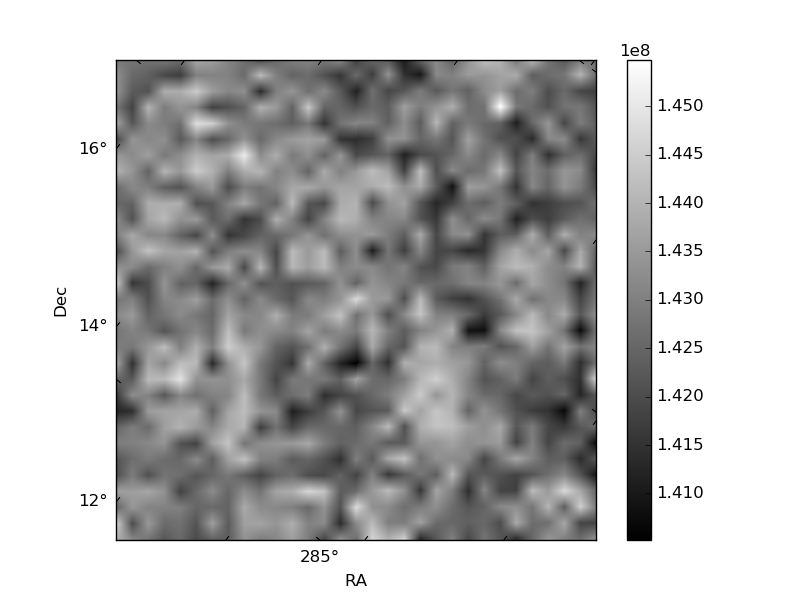
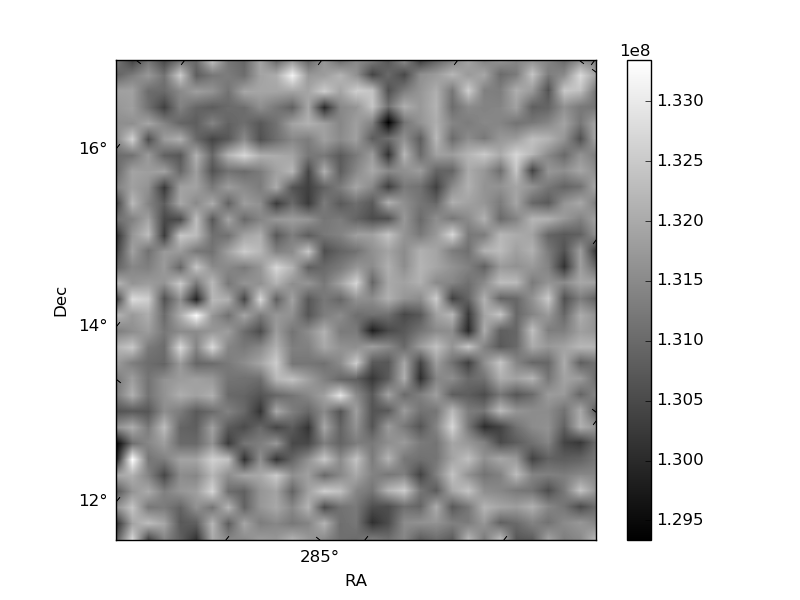
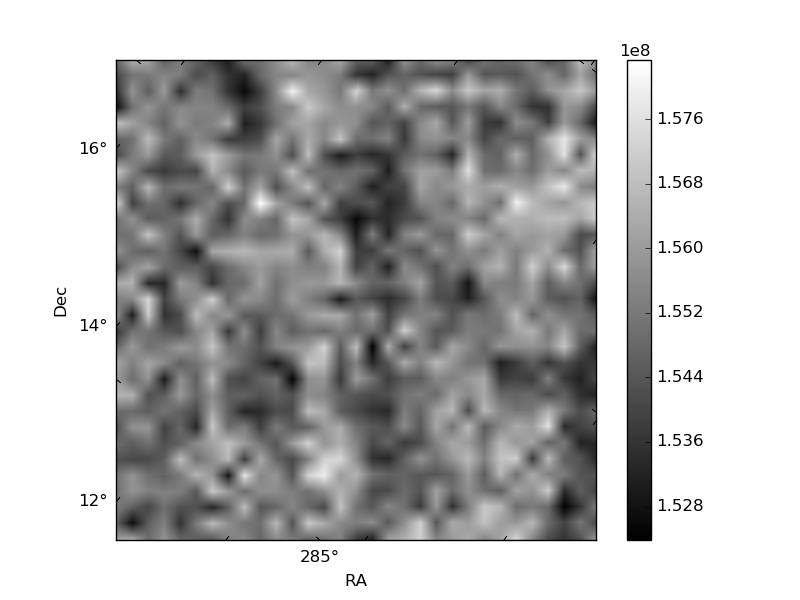
Histogram calculated using DETX and DETY for each event in the final _common_clean file
| Quadrant A | 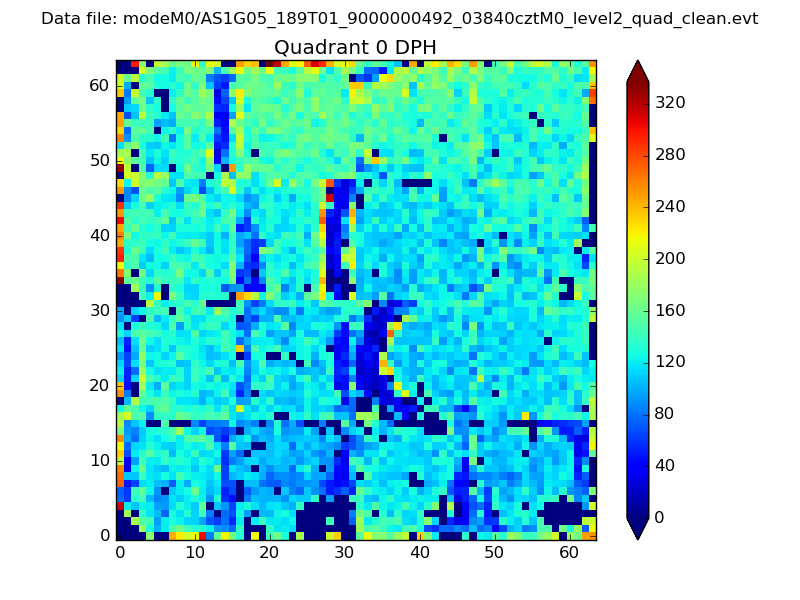 |
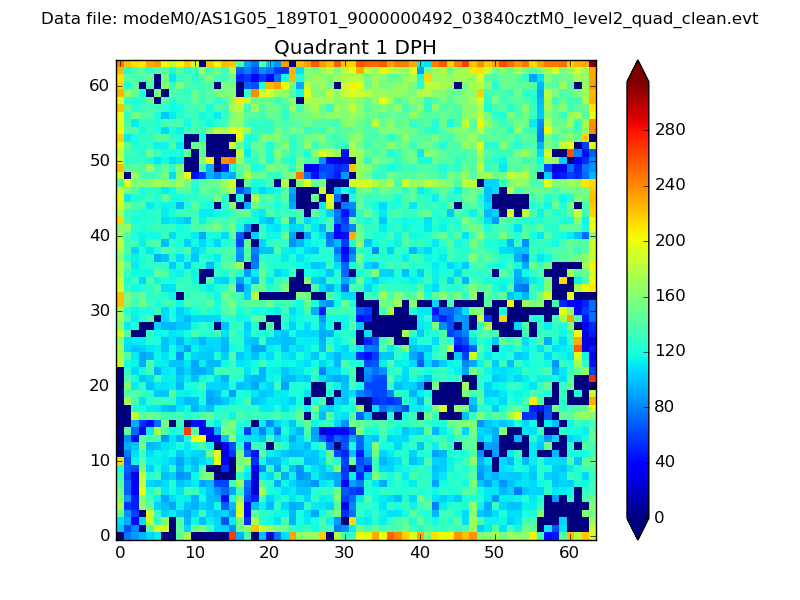 |
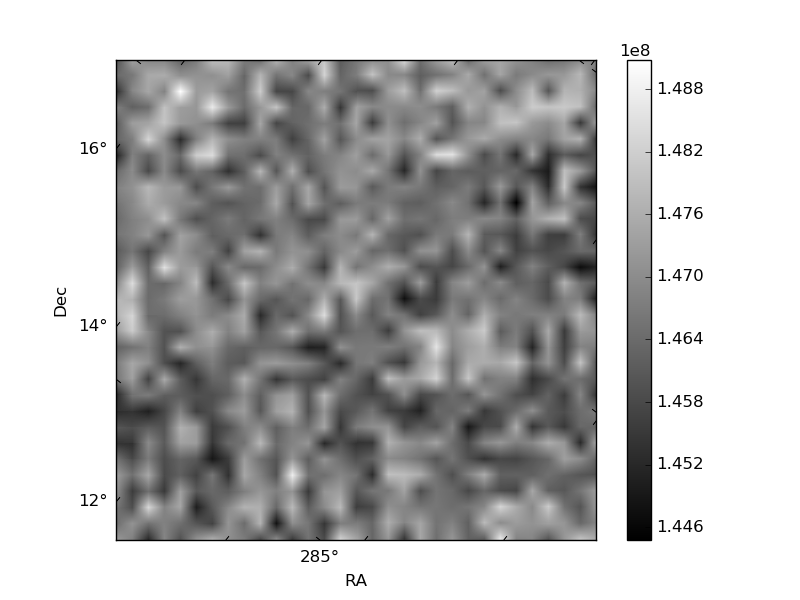
Quadrant B |
|---|---|---|---|
| Quadrant D | 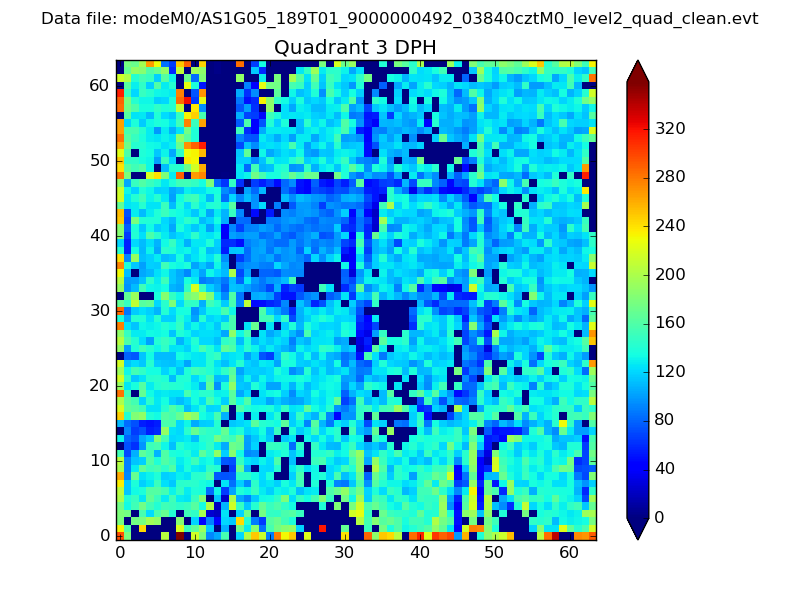 |
 |
Quadrant C |
| Plot type | Count rate plots | Images |
|---|---|---|
| Comparison with Poisson distribution Blue bars denote a histogram of data divided into 1 sec bins. Red curve is a Poisson curve with rate = median count rate of data. |
 |
 |
| Quadrant-wise count rates Data is divided into 100 sec bins |
 |
|
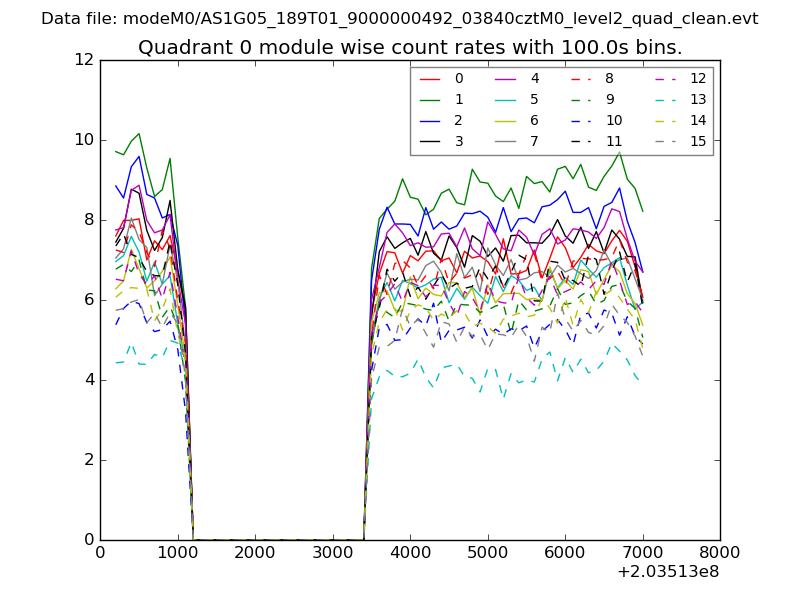
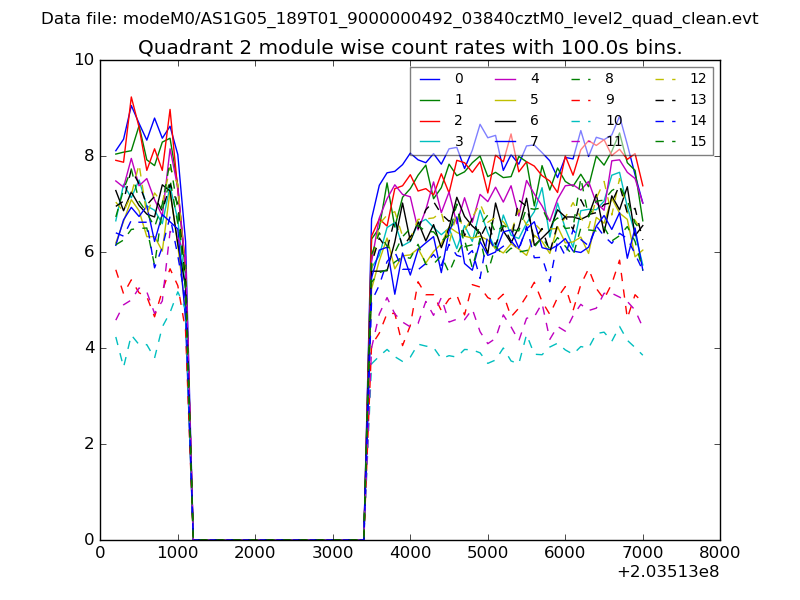
| Module-wise count rates for Quadrant A Data is divided into 100 sec bins |
 |
 |
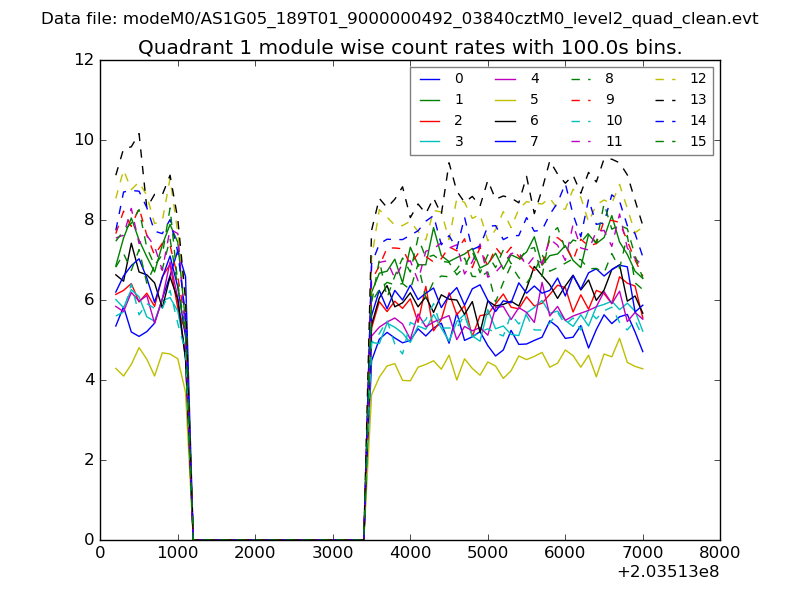
| Module-wise count rates for Quadrant B Data is divided into 100 sec bins |
 |
 |
| Module-wise count rates for Quadrant C Data is divided into 100 sec bins |
 |
 |
| Module-wise count rates for Quadrant D Data is divided into 100 sec bins |
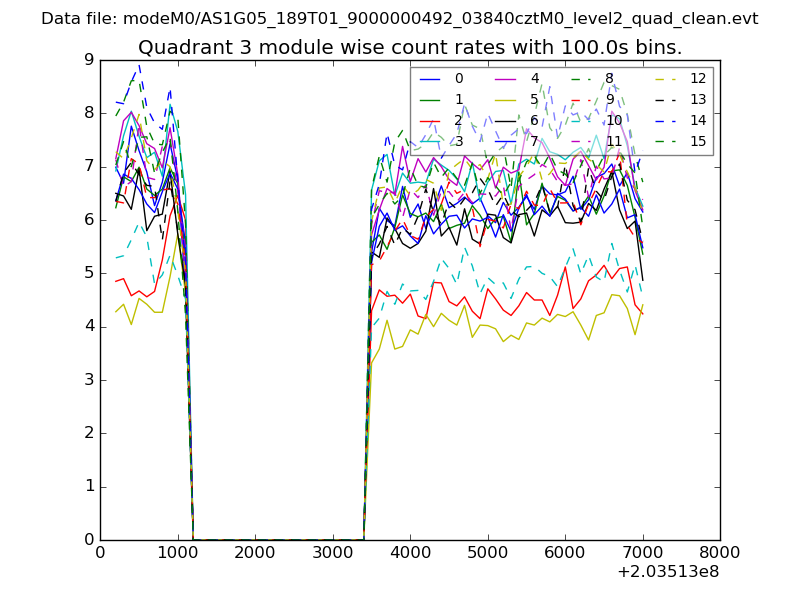 |
 |
| Parameter | Plot |
|---|---|
| CZT HV Monitor | 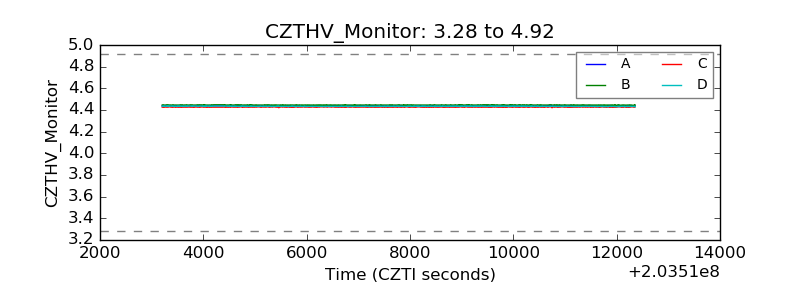 |
| D_VDD | 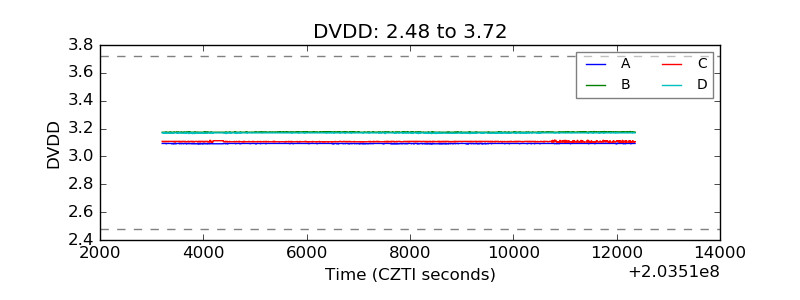 |
| Temperature 1 | 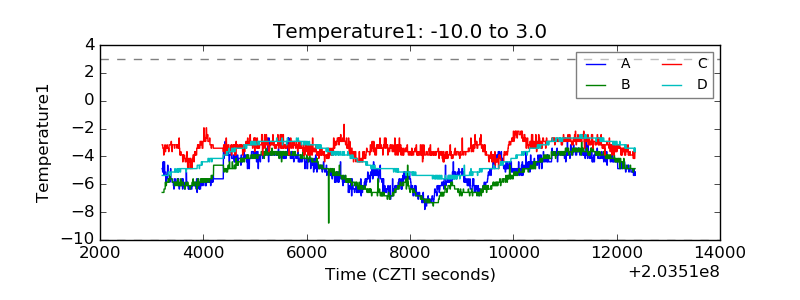 |
| Veto HV Monitor | 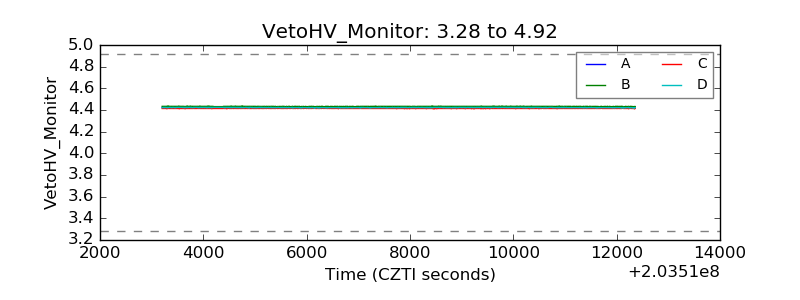 |
| Veto LLD | 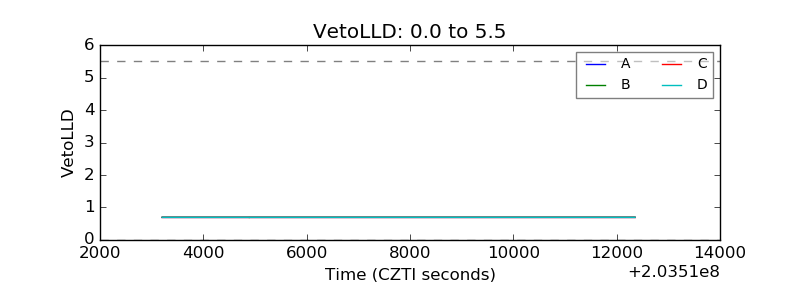 |
| Alpha Counter |  |
| _CPM_Rate | 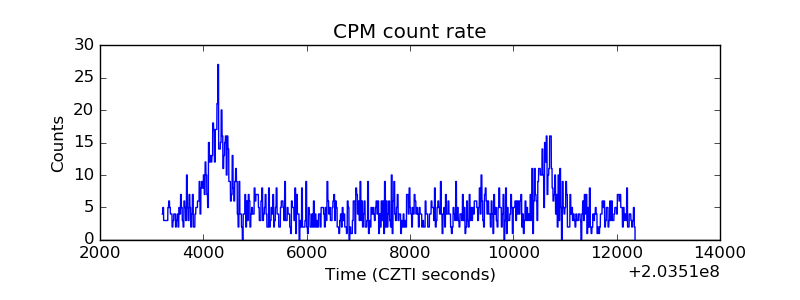 |
| CZT Counter | 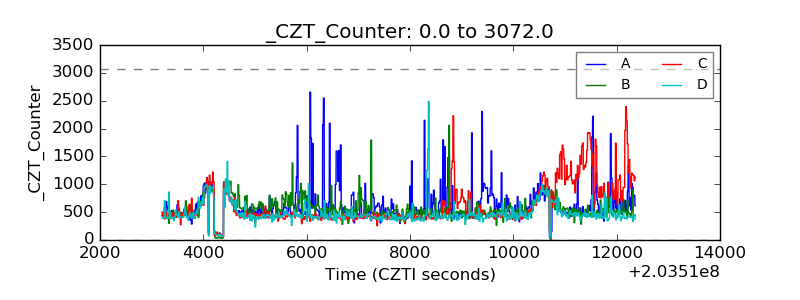 |
| +2.5 Volts monitor |  |
| +5 Volts monitor |  |
| Veto Counter | 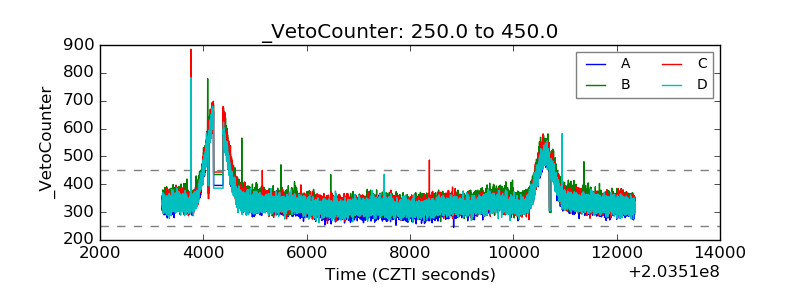 |